- Hypothesis Testing: Definition, Uses, Limitations + Examples

Hypothesis testing is as old as the scientific method and is at the heart of the research process.
Research exists to validate or disprove assumptions about various phenomena. The process of validation involves testing and it is in this context that we will explore hypothesis testing.

What is a Hypothesis?
A hypothesis is a calculated prediction or assumption about a population parameter based on limited evidence. The whole idea behind hypothesis formulation is testing—this means the researcher subjects his or her calculated assumption to a series of evaluations to know whether they are true or false.
Typically, every research starts with a hypothesis—the investigator makes a claim and experiments to prove that this claim is true or false . For instance, if you predict that students who drink milk before class perform better than those who don’t, then this becomes a hypothesis that can be confirmed or refuted using an experiment.
Read: What is Empirical Research Study? [Examples & Method]
What are the Types of Hypotheses?
1. simple hypothesis.
Also known as a basic hypothesis, a simple hypothesis suggests that an independent variable is responsible for a corresponding dependent variable. In other words, an occurrence of the independent variable inevitably leads to an occurrence of the dependent variable.
Typically, simple hypotheses are considered as generally true, and they establish a causal relationship between two variables.
Examples of Simple Hypothesis
- Drinking soda and other sugary drinks can cause obesity.
- Smoking cigarettes daily leads to lung cancer.
2. Complex Hypothesis
A complex hypothesis is also known as a modal. It accounts for the causal relationship between two independent variables and the resulting dependent variables. This means that the combination of the independent variables leads to the occurrence of the dependent variables .
Examples of Complex Hypotheses
- Adults who do not smoke and drink are less likely to develop liver-related conditions.
- Global warming causes icebergs to melt which in turn causes major changes in weather patterns.
3. Null Hypothesis
As the name suggests, a null hypothesis is formed when a researcher suspects that there’s no relationship between the variables in an observation. In this case, the purpose of the research is to approve or disapprove this assumption.
Examples of Null Hypothesis
- This is no significant change in a student’s performance if they drink coffee or tea before classes.
- There’s no significant change in the growth of a plant if one uses distilled water only or vitamin-rich water.
Read: Research Report: Definition, Types + [Writing Guide]
4. Alternative Hypothesis
To disapprove a null hypothesis, the researcher has to come up with an opposite assumption—this assumption is known as the alternative hypothesis. This means if the null hypothesis says that A is false, the alternative hypothesis assumes that A is true.
An alternative hypothesis can be directional or non-directional depending on the direction of the difference. A directional alternative hypothesis specifies the direction of the tested relationship, stating that one variable is predicted to be larger or smaller than the null value while a non-directional hypothesis only validates the existence of a difference without stating its direction.
Examples of Alternative Hypotheses
- Starting your day with a cup of tea instead of a cup of coffee can make you more alert in the morning.
- The growth of a plant improves significantly when it receives distilled water instead of vitamin-rich water.
5. Logical Hypothesis
Logical hypotheses are some of the most common types of calculated assumptions in systematic investigations. It is an attempt to use your reasoning to connect different pieces in research and build a theory using little evidence. In this case, the researcher uses any data available to him, to form a plausible assumption that can be tested.
Examples of Logical Hypothesis
- Waking up early helps you to have a more productive day.
- Beings from Mars would not be able to breathe the air in the atmosphere of the Earth.
6. Empirical Hypothesis
After forming a logical hypothesis, the next step is to create an empirical or working hypothesis. At this stage, your logical hypothesis undergoes systematic testing to prove or disprove the assumption. An empirical hypothesis is subject to several variables that can trigger changes and lead to specific outcomes.
Examples of Empirical Testing
- People who eat more fish run faster than people who eat meat.
- Women taking vitamin E grow hair faster than those taking vitamin K.
7. Statistical Hypothesis
When forming a statistical hypothesis, the researcher examines the portion of a population of interest and makes a calculated assumption based on the data from this sample. A statistical hypothesis is most common with systematic investigations involving a large target audience. Here, it’s impossible to collect responses from every member of the population so you have to depend on data from your sample and extrapolate the results to the wider population.
Examples of Statistical Hypothesis
- 45% of students in Louisiana have middle-income parents.
- 80% of the UK’s population gets a divorce because of irreconcilable differences.
What is Hypothesis Testing?
Hypothesis testing is an assessment method that allows researchers to determine the plausibility of a hypothesis. It involves testing an assumption about a specific population parameter to know whether it’s true or false. These population parameters include variance, standard deviation, and median.
Typically, hypothesis testing starts with developing a null hypothesis and then performing several tests that support or reject the null hypothesis. The researcher uses test statistics to compare the association or relationship between two or more variables.
Explore: Research Bias: Definition, Types + Examples
Researchers also use hypothesis testing to calculate the coefficient of variation and determine if the regression relationship and the correlation coefficient are statistically significant.
How Hypothesis Testing Works
The basis of hypothesis testing is to examine and analyze the null hypothesis and alternative hypothesis to know which one is the most plausible assumption. Since both assumptions are mutually exclusive, only one can be true. In other words, the occurrence of a null hypothesis destroys the chances of the alternative coming to life, and vice-versa.
Interesting: 21 Chrome Extensions for Academic Researchers in 2021
What Are The Stages of Hypothesis Testing?
To successfully confirm or refute an assumption, the researcher goes through five (5) stages of hypothesis testing;
- Determine the null hypothesis
- Specify the alternative hypothesis
- Set the significance level
- Calculate the test statistics and corresponding P-value
- Draw your conclusion
- Determine the Null Hypothesis
Like we mentioned earlier, hypothesis testing starts with creating a null hypothesis which stands as an assumption that a certain statement is false or implausible. For example, the null hypothesis (H0) could suggest that different subgroups in the research population react to a variable in the same way.
- Specify the Alternative Hypothesis
Once you know the variables for the null hypothesis, the next step is to determine the alternative hypothesis. The alternative hypothesis counters the null assumption by suggesting the statement or assertion is true. Depending on the purpose of your research, the alternative hypothesis can be one-sided or two-sided.
Using the example we established earlier, the alternative hypothesis may argue that the different sub-groups react differently to the same variable based on several internal and external factors.
- Set the Significance Level
Many researchers create a 5% allowance for accepting the value of an alternative hypothesis, even if the value is untrue. This means that there is a 0.05 chance that one would go with the value of the alternative hypothesis, despite the truth of the null hypothesis.
Something to note here is that the smaller the significance level, the greater the burden of proof needed to reject the null hypothesis and support the alternative hypothesis.
Explore: What is Data Interpretation? + [Types, Method & Tools]
- Calculate the Test Statistics and Corresponding P-Value
Test statistics in hypothesis testing allow you to compare different groups between variables while the p-value accounts for the probability of obtaining sample statistics if your null hypothesis is true. In this case, your test statistics can be the mean, median and similar parameters.
If your p-value is 0.65, for example, then it means that the variable in your hypothesis will happen 65 in100 times by pure chance. Use this formula to determine the p-value for your data:

- Draw Your Conclusions
After conducting a series of tests, you should be able to agree or refute the hypothesis based on feedback and insights from your sample data.
Applications of Hypothesis Testing in Research
Hypothesis testing isn’t only confined to numbers and calculations; it also has several real-life applications in business, manufacturing, advertising, and medicine.
In a factory or other manufacturing plants, hypothesis testing is an important part of quality and production control before the final products are approved and sent out to the consumer.
During ideation and strategy development, C-level executives use hypothesis testing to evaluate their theories and assumptions before any form of implementation. For example, they could leverage hypothesis testing to determine whether or not some new advertising campaign, marketing technique, etc. causes increased sales.
In addition, hypothesis testing is used during clinical trials to prove the efficacy of a drug or new medical method before its approval for widespread human usage.
What is an Example of Hypothesis Testing?
An employer claims that her workers are of above-average intelligence. She takes a random sample of 20 of them and gets the following results:
Mean IQ Scores: 110
Standard Deviation: 15
Mean Population IQ: 100
Step 1: Using the value of the mean population IQ, we establish the null hypothesis as 100.
Step 2: State that the alternative hypothesis is greater than 100.
Step 3: State the alpha level as 0.05 or 5%
Step 4: Find the rejection region area (given by your alpha level above) from the z-table. An area of .05 is equal to a z-score of 1.645.
Step 5: Calculate the test statistics using this formula

Z = (110–100) ÷ (15÷√20)
10 ÷ 3.35 = 2.99
If the value of the test statistics is higher than the value of the rejection region, then you should reject the null hypothesis. If it is less, then you cannot reject the null.
In this case, 2.99 > 1.645 so we reject the null.
Importance/Benefits of Hypothesis Testing
The most significant benefit of hypothesis testing is it allows you to evaluate the strength of your claim or assumption before implementing it in your data set. Also, hypothesis testing is the only valid method to prove that something “is or is not”. Other benefits include:
- Hypothesis testing provides a reliable framework for making any data decisions for your population of interest.
- It helps the researcher to successfully extrapolate data from the sample to the larger population.
- Hypothesis testing allows the researcher to determine whether the data from the sample is statistically significant.
- Hypothesis testing is one of the most important processes for measuring the validity and reliability of outcomes in any systematic investigation.
- It helps to provide links to the underlying theory and specific research questions.
Criticism and Limitations of Hypothesis Testing
Several limitations of hypothesis testing can affect the quality of data you get from this process. Some of these limitations include:
- The interpretation of a p-value for observation depends on the stopping rule and definition of multiple comparisons. This makes it difficult to calculate since the stopping rule is subject to numerous interpretations, plus “multiple comparisons” are unavoidably ambiguous.
- Conceptual issues often arise in hypothesis testing, especially if the researcher merges Fisher and Neyman-Pearson’s methods which are conceptually distinct.
- In an attempt to focus on the statistical significance of the data, the researcher might ignore the estimation and confirmation by repeated experiments.
- Hypothesis testing can trigger publication bias, especially when it requires statistical significance as a criterion for publication.
- When used to detect whether a difference exists between groups, hypothesis testing can trigger absurd assumptions that affect the reliability of your observation.
Connect to Formplus, Get Started Now - It's Free!
- alternative hypothesis
- alternative vs null hypothesis
- complex hypothesis
- empirical hypothesis
- hypothesis testing
- logical hypothesis
- simple hypothesis
- statistical hypothesis
- busayo.longe
You may also like:
Type I vs Type II Errors: Causes, Examples & Prevention
This article will discuss the two different types of errors in hypothesis testing and how you can prevent them from occurring in your research
Alternative vs Null Hypothesis: Pros, Cons, Uses & Examples
We are going to discuss alternative hypotheses and null hypotheses in this post and how they work in research.
What is Pure or Basic Research? + [Examples & Method]
Simple guide on pure or basic research, its methods, characteristics, advantages, and examples in science, medicine, education and psychology
Internal Validity in Research: Definition, Threats, Examples
In this article, we will discuss the concept of internal validity, some clear examples, its importance, and how to test it.
Formplus - For Seamless Data Collection
Collect data the right way with a versatile data collection tool. try formplus and transform your work productivity today..

User Preferences
Content preview.
Arcu felis bibendum ut tristique et egestas quis:
- Ut enim ad minim veniam, quis nostrud exercitation ullamco laboris
- Duis aute irure dolor in reprehenderit in voluptate
- Excepteur sint occaecat cupidatat non proident
Keyboard Shortcuts
S.3 hypothesis testing.
In reviewing hypothesis tests, we start first with the general idea. Then, we keep returning to the basic procedures of hypothesis testing, each time adding a little more detail.
The general idea of hypothesis testing involves:
- Making an initial assumption.
- Collecting evidence (data).
- Based on the available evidence (data), deciding whether to reject or not reject the initial assumption.
Every hypothesis test — regardless of the population parameter involved — requires the above three steps.
Example S.3.1
Is normal body temperature really 98.6 degrees f section .
Consider the population of many, many adults. A researcher hypothesized that the average adult body temperature is lower than the often-advertised 98.6 degrees F. That is, the researcher wants an answer to the question: "Is the average adult body temperature 98.6 degrees? Or is it lower?" To answer his research question, the researcher starts by assuming that the average adult body temperature was 98.6 degrees F.
Then, the researcher went out and tried to find evidence that refutes his initial assumption. In doing so, he selects a random sample of 130 adults. The average body temperature of the 130 sampled adults is 98.25 degrees.
Then, the researcher uses the data he collected to make a decision about his initial assumption. It is either likely or unlikely that the researcher would collect the evidence he did given his initial assumption that the average adult body temperature is 98.6 degrees:
- If it is likely , then the researcher does not reject his initial assumption that the average adult body temperature is 98.6 degrees. There is not enough evidence to do otherwise.
- either the researcher's initial assumption is correct and he experienced a very unusual event;
- or the researcher's initial assumption is incorrect.
In statistics, we generally don't make claims that require us to believe that a very unusual event happened. That is, in the practice of statistics, if the evidence (data) we collected is unlikely in light of the initial assumption, then we reject our initial assumption.
Example S.3.2
Criminal trial analogy section .
One place where you can consistently see the general idea of hypothesis testing in action is in criminal trials held in the United States. Our criminal justice system assumes "the defendant is innocent until proven guilty." That is, our initial assumption is that the defendant is innocent.
In the practice of statistics, we make our initial assumption when we state our two competing hypotheses -- the null hypothesis ( H 0 ) and the alternative hypothesis ( H A ). Here, our hypotheses are:
- H 0 : Defendant is not guilty (innocent)
- H A : Defendant is guilty
In statistics, we always assume the null hypothesis is true . That is, the null hypothesis is always our initial assumption.
The prosecution team then collects evidence — such as finger prints, blood spots, hair samples, carpet fibers, shoe prints, ransom notes, and handwriting samples — with the hopes of finding "sufficient evidence" to make the assumption of innocence refutable.
In statistics, the data are the evidence.
The jury then makes a decision based on the available evidence:
- If the jury finds sufficient evidence — beyond a reasonable doubt — to make the assumption of innocence refutable, the jury rejects the null hypothesis and deems the defendant guilty. We behave as if the defendant is guilty.
- If there is insufficient evidence, then the jury does not reject the null hypothesis . We behave as if the defendant is innocent.
In statistics, we always make one of two decisions. We either "reject the null hypothesis" or we "fail to reject the null hypothesis."
Errors in Hypothesis Testing Section
Did you notice the use of the phrase "behave as if" in the previous discussion? We "behave as if" the defendant is guilty; we do not "prove" that the defendant is guilty. And, we "behave as if" the defendant is innocent; we do not "prove" that the defendant is innocent.
This is a very important distinction! We make our decision based on evidence not on 100% guaranteed proof. Again:
- If we reject the null hypothesis, we do not prove that the alternative hypothesis is true.
- If we do not reject the null hypothesis, we do not prove that the null hypothesis is true.
We merely state that there is enough evidence to behave one way or the other. This is always true in statistics! Because of this, whatever the decision, there is always a chance that we made an error .
Let's review the two types of errors that can be made in criminal trials:
Table S.3.2 shows how this corresponds to the two types of errors in hypothesis testing.
Note that, in statistics, we call the two types of errors by two different names -- one is called a "Type I error," and the other is called a "Type II error." Here are the formal definitions of the two types of errors:
There is always a chance of making one of these errors. But, a good scientific study will minimize the chance of doing so!
Making the Decision Section
Recall that it is either likely or unlikely that we would observe the evidence we did given our initial assumption. If it is likely , we do not reject the null hypothesis. If it is unlikely , then we reject the null hypothesis in favor of the alternative hypothesis. Effectively, then, making the decision reduces to determining "likely" or "unlikely."
In statistics, there are two ways to determine whether the evidence is likely or unlikely given the initial assumption:
- We could take the " critical value approach " (favored in many of the older textbooks).
- Or, we could take the " P -value approach " (what is used most often in research, journal articles, and statistical software).
In the next two sections, we review the procedures behind each of these two approaches. To make our review concrete, let's imagine that μ is the average grade point average of all American students who major in mathematics. We first review the critical value approach for conducting each of the following three hypothesis tests about the population mean $\mu$:
In Practice
- We would want to conduct the first hypothesis test if we were interested in concluding that the average grade point average of the group is more than 3.
- We would want to conduct the second hypothesis test if we were interested in concluding that the average grade point average of the group is less than 3.
- And, we would want to conduct the third hypothesis test if we were only interested in concluding that the average grade point average of the group differs from 3 (without caring whether it is more or less than 3).
Upon completing the review of the critical value approach, we review the P -value approach for conducting each of the above three hypothesis tests about the population mean \(\mu\). The procedures that we review here for both approaches easily extend to hypothesis tests about any other population parameter.
- How it works

Hypothesis Testing – A Complete Guide with Examples
Published by Alvin Nicolas at August 14th, 2021 , Revised On October 26, 2023
In statistics, hypothesis testing is a critical tool. It allows us to make informed decisions about populations based on sample data. Whether you are a researcher trying to prove a scientific point, a marketer analysing A/B test results, or a manufacturer ensuring quality control, hypothesis testing plays a pivotal role. This guide aims to introduce you to the concept and walk you through real-world examples.
What is a Hypothesis and a Hypothesis Testing?
A hypothesis is considered a belief or assumption that has to be accepted, rejected, proved or disproved. In contrast, a research hypothesis is a research question for a researcher that has to be proven correct or incorrect through investigation.
What is Hypothesis Testing?
Hypothesis testing is a scientific method used for making a decision and drawing conclusions by using a statistical approach. It is used to suggest new ideas by testing theories to know whether or not the sample data supports research. A research hypothesis is a predictive statement that has to be tested using scientific methods that join an independent variable to a dependent variable.
Example: The academic performance of student A is better than student B
Characteristics of the Hypothesis to be Tested
A hypothesis should be:
- Clear and precise
- Capable of being tested
- Able to relate to a variable
- Stated in simple terms
- Consistent with known facts
- Limited in scope and specific
- Tested in a limited timeframe
- Explain the facts in detail
What is a Null Hypothesis and Alternative Hypothesis?
A null hypothesis is a hypothesis when there is no significant relationship between the dependent and the participants’ independent variables .
In simple words, it’s a hypothesis that has been put forth but hasn’t been proved as yet. A researcher aims to disprove the theory. The abbreviation “Ho” is used to denote a null hypothesis.
If you want to compare two methods and assume that both methods are equally good, this assumption is considered the null hypothesis.
Example: In an automobile trial, you feel that the new vehicle’s mileage is similar to the previous model of the car, on average. You can write it as: Ho: there is no difference between the mileage of both vehicles. If your findings don’t support your hypothesis and you get opposite results, this outcome will be considered an alternative hypothesis.
If you assume that one method is better than another method, then it’s considered an alternative hypothesis. The alternative hypothesis is the theory that a researcher seeks to prove and is typically denoted by H1 or HA.
If you support a null hypothesis, it means you’re not supporting the alternative hypothesis. Similarly, if you reject a null hypothesis, it means you are recommending the alternative hypothesis.
Example: In an automobile trial, you feel that the new vehicle’s mileage is better than the previous model of the vehicle. You can write it as; Ha: the two vehicles have different mileage. On average/ the fuel consumption of the new vehicle model is better than the previous model.
If a null hypothesis is rejected during the hypothesis test, even if it’s true, then it is considered as a type-I error. On the other hand, if you don’t dismiss a hypothesis, even if it’s false because you could not identify its falseness, it’s considered a type-II error.
Hire an Expert Researcher
Orders completed by our expert writers are
- Formally drafted in academic style
- 100% Plagiarism free & 100% Confidential
- Never resold
- Include unlimited free revisions
- Completed to match exact client requirements

How to Conduct Hypothesis Testing?
Here is a step-by-step guide on how to conduct hypothesis testing.
Step 1: State the Null and Alternative Hypothesis
Once you develop a research hypothesis, it’s important to state it is as a Null hypothesis (Ho) and an Alternative hypothesis (Ha) to test it statistically.
A null hypothesis is a preferred choice as it provides the opportunity to test the theory. In contrast, you can accept the alternative hypothesis when the null hypothesis has been rejected.
Example: You want to identify a relationship between obesity of men and women and the modern living style. You develop a hypothesis that women, on average, gain weight quickly compared to men. Then you write it as: Ho: Women, on average, don’t gain weight quickly compared to men. Ha: Women, on average, gain weight quickly compared to men.
Step 2: Data Collection
Hypothesis testing follows the statistical method, and statistics are all about data. It’s challenging to gather complete information about a specific population you want to study. You need to gather the data obtained through a large number of samples from a specific population.
Example: Suppose you want to test the difference in the rate of obesity between men and women. You should include an equal number of men and women in your sample. Then investigate various aspects such as their lifestyle, eating patterns and profession, and any other variables that may influence average weight. You should also determine your study’s scope, whether it applies to a specific group of population or worldwide population. You can use available information from various places, countries, and regions.
Step 3: Select Appropriate Statistical Test
There are many types of statistical tests , but we discuss the most two common types below, such as One-sided and two-sided tests.
Note: Your choice of the type of test depends on the purpose of your study
One-sided Test
In the one-sided test, the values of rejecting a null hypothesis are located in one tail of the probability distribution. The set of values is less or higher than the critical value of the test. It is also called a one-tailed test of significance.
Example: If you want to test that all mangoes in a basket are ripe. You can write it as: Ho: All mangoes in the basket, on average, are ripe. If you find all ripe mangoes in the basket, the null hypothesis you developed will be true.
Two-sided Test
In the two-sided test, the values of rejecting a null hypothesis are located on both tails of the probability distribution. The set of values is less or higher than the first critical value of the test and higher than the second critical value test. It is also called a two-tailed test of significance.
Example: Nothing can be explicitly said whether all mangoes are ripe in the basket. If you reject the null hypothesis (Ho: All mangoes in the basket, on average, are ripe), then it means all mangoes in the basket are not likely to be ripe. A few mangoes could be raw as well.
Get statistical analysis help at an affordable price
- An expert statistician will complete your work
- Rigorous quality checks
- Confidentiality and reliability
- Any statistical software of your choice
- Free Plagiarism Report

Step 4: Select the Level of Significance
When you reject a null hypothesis, even if it’s true during a statistical hypothesis, it is considered the significance level . It is the probability of a type one error. The significance should be as minimum as possible to avoid the type-I error, which is considered severe and should be avoided.
If the significance level is minimum, then it prevents the researchers from false claims.
The significance level is denoted by P, and it has given the value of 0.05 (P=0.05)
If the P-Value is less than 0.05, then the difference will be significant. If the P-value is higher than 0.05, then the difference is non-significant.
Example: Suppose you apply a one-sided test to test whether women gain weight quickly compared to men. You get to know about the average weight between men and women and the factors promoting weight gain.
Step 5: Find out Whether the Null Hypothesis is Rejected or Supported
After conducting a statistical test, you should identify whether your null hypothesis is rejected or accepted based on the test results. It would help if you observed the P-value for this.
Example: If you find the P-value of your test is less than 0.5/5%, then you need to reject your null hypothesis (Ho: Women, on average, don’t gain weight quickly compared to men). On the other hand, if a null hypothesis is rejected, then it means the alternative hypothesis might be true (Ha: Women, on average, gain weight quickly compared to men. If you find your test’s P-value is above 0.5/5%, then it means your null hypothesis is true.
Step 6: Present the Outcomes of your Study
The final step is to present the outcomes of your study . You need to ensure whether you have met the objectives of your research or not.
In the discussion section and conclusion , you can present your findings by using supporting evidence and conclude whether your null hypothesis was rejected or supported.
In the result section, you can summarise your study’s outcomes, including the average difference and P-value of the two groups.
If we talk about the findings, our study your results will be as follows:
Example: In the study of identifying whether women gain weight quickly compared to men, we found the P-value is less than 0.5. Hence, we can reject the null hypothesis (Ho: Women, on average, don’t gain weight quickly than men) and conclude that women may likely gain weight quickly than men.
Did you know in your academic paper you should not mention whether you have accepted or rejected the null hypothesis?
Always remember that you either conclude to reject Ho in favor of Haor do not reject Ho . It would help if you never rejected Ha or even accept Ha .
Suppose your null hypothesis is rejected in the hypothesis testing. If you conclude reject Ho in favor of Haor do not reject Ho, then it doesn’t mean that the null hypothesis is true. It only means that there is a lack of evidence against Ho in favour of Ha. If your null hypothesis is not true, then the alternative hypothesis is likely to be true.
Example: We found that the P-value is less than 0.5. Hence, we can conclude reject Ho in favour of Ha (Ho: Women, on average, don’t gain weight quickly than men) reject Ho in favour of Ha. However, rejected in favour of Ha means (Ha: women may likely to gain weight quickly than men)
Frequently Asked Questions
What are the 3 types of hypothesis test.
The 3 types of hypothesis tests are:
- One-Sample Test : Compare sample data to a known population value.
- Two-Sample Test : Compare means between two sample groups.
- ANOVA : Analyze variance among multiple groups to determine significant differences.
What is a hypothesis?
A hypothesis is a proposed explanation or prediction about a phenomenon, often based on observations. It serves as a starting point for research or experimentation, providing a testable statement that can either be supported or refuted through data and analysis. In essence, it’s an educated guess that drives scientific inquiry.
What are null hypothesis?
A null hypothesis (often denoted as H0) suggests that there is no effect or difference in a study or experiment. It represents a default position or status quo. Statistical tests evaluate data to determine if there’s enough evidence to reject this null hypothesis.
What is the probability value?
The probability value, or p-value, is a measure used in statistics to determine the significance of an observed effect. It indicates the probability of obtaining the observed results, or more extreme, if the null hypothesis were true. A small p-value (typically <0.05) suggests evidence against the null hypothesis, warranting its rejection.
What is p value?
The p-value is a fundamental concept in statistical hypothesis testing. It represents the probability of observing a test statistic as extreme, or more so, than the one calculated from sample data, assuming the null hypothesis is true. A low p-value suggests evidence against the null, possibly justifying its rejection.
What is a t test?
A t-test is a statistical test used to compare the means of two groups. It determines if observed differences between the groups are statistically significant or if they likely occurred by chance. Commonly applied in research, there are different t-tests, including independent, paired, and one-sample, tailored to various data scenarios.
When to reject null hypothesis?
Reject the null hypothesis when the test statistic falls into a predefined rejection region or when the p-value is less than the chosen significance level (commonly 0.05). This suggests that the observed data is unlikely under the null hypothesis, indicating evidence for the alternative hypothesis. Always consider the study’s context.
You May Also Like
This article provides the key advantages of primary research over secondary research so you can make an informed decision.
Discourse analysis is an essential aspect of studying a language. It is used in various disciplines of social science and humanities such as linguistic, sociolinguistics, and psycholinguistic.
In correlational research, a researcher measures the relationship between two or more variables or sets of scores without having control over the variables.
USEFUL LINKS
LEARNING RESOURCES

COMPANY DETAILS

- How It Works
Hypothesis Testing
When you conduct a piece of quantitative research, you are inevitably attempting to answer a research question or hypothesis that you have set. One method of evaluating this research question is via a process called hypothesis testing , which is sometimes also referred to as significance testing . Since there are many facets to hypothesis testing, we start with the example we refer to throughout this guide.
An example of a lecturer's dilemma
Two statistics lecturers, Sarah and Mike, think that they use the best method to teach their students. Each lecturer has 50 statistics students who are studying a graduate degree in management. In Sarah's class, students have to attend one lecture and one seminar class every week, whilst in Mike's class students only have to attend one lecture. Sarah thinks that seminars, in addition to lectures, are an important teaching method in statistics, whilst Mike believes that lectures are sufficient by themselves and thinks that students are better off solving problems by themselves in their own time. This is the first year that Sarah has given seminars, but since they take up a lot of her time, she wants to make sure that she is not wasting her time and that seminars improve her students' performance.
The research hypothesis
The first step in hypothesis testing is to set a research hypothesis. In Sarah and Mike's study, the aim is to examine the effect that two different teaching methods – providing both lectures and seminar classes (Sarah), and providing lectures by themselves (Mike) – had on the performance of Sarah's 50 students and Mike's 50 students. More specifically, they want to determine whether performance is different between the two different teaching methods. Whilst Mike is skeptical about the effectiveness of seminars, Sarah clearly believes that giving seminars in addition to lectures helps her students do better than those in Mike's class. This leads to the following research hypothesis:
Before moving onto the second step of the hypothesis testing process, we need to take you on a brief detour to explain why you need to run hypothesis testing at all. This is explained next.
Sample to population
If you have measured individuals (or any other type of "object") in a study and want to understand differences (or any other type of effect), you can simply summarize the data you have collected. For example, if Sarah and Mike wanted to know which teaching method was the best, they could simply compare the performance achieved by the two groups of students – the group of students that took lectures and seminar classes, and the group of students that took lectures by themselves – and conclude that the best method was the teaching method which resulted in the highest performance. However, this is generally of only limited appeal because the conclusions could only apply to students in this study. However, if those students were representative of all statistics students on a graduate management degree, the study would have wider appeal.
In statistics terminology, the students in the study are the sample and the larger group they represent (i.e., all statistics students on a graduate management degree) is called the population . Given that the sample of statistics students in the study are representative of a larger population of statistics students, you can use hypothesis testing to understand whether any differences or effects discovered in the study exist in the population. In layman's terms, hypothesis testing is used to establish whether a research hypothesis extends beyond those individuals examined in a single study.
Another example could be taking a sample of 200 breast cancer sufferers in order to test a new drug that is designed to eradicate this type of cancer. As much as you are interested in helping these specific 200 cancer sufferers, your real goal is to establish that the drug works in the population (i.e., all breast cancer sufferers).
As such, by taking a hypothesis testing approach, Sarah and Mike want to generalize their results to a population rather than just the students in their sample. However, in order to use hypothesis testing, you need to re-state your research hypothesis as a null and alternative hypothesis. Before you can do this, it is best to consider the process/structure involved in hypothesis testing and what you are measuring. This structure is presented on the next page .

- school Campus Bookshelves
- menu_book Bookshelves
- perm_media Learning Objects
- login Login
- how_to_reg Request Instructor Account
- hub Instructor Commons
- Download Page (PDF)
- Download Full Book (PDF)
- Periodic Table
- Physics Constants
- Scientific Calculator
- Reference & Cite
- Tools expand_more
- Readability
selected template will load here
This action is not available.
1.2: The 7-Step Process of Statistical Hypothesis Testing
- Last updated
- Save as PDF
- Page ID 33320

- Penn State's Department of Statistics
- The Pennsylvania State University
We will cover the seven steps one by one.
Step 1: State the Null Hypothesis
The null hypothesis can be thought of as the opposite of the "guess" the researchers made: in this example, the biologist thinks the plant height will be different for the fertilizers. So the null would be that there will be no difference among the groups of plants. Specifically, in more statistical language the null for an ANOVA is that the means are the same. We state the null hypothesis as: \[H_{0}: \ \mu_{1} = \mu_{2} = \ldots = \mu_{T}\] for \(T\) levels of an experimental treatment.
Why do we do this? Why not simply test the working hypothesis directly? The answer lies in the Popperian Principle of Falsification. Karl Popper (a philosopher) discovered that we can't conclusively confirm a hypothesis, but we can conclusively negate one. So we set up a null hypothesis which is effectively the opposite of the working hypothesis. The hope is that based on the strength of the data, we will be able to negate or reject the null hypothesis and accept an alternative hypothesis. In other words, we usually see the working hypothesis in \(H_{A}\).
Step 2: State the Alternative Hypothesis
\[H_{A}: \ \text{treatment level means not all equal}\]
The reason we state the alternative hypothesis this way is that if the null is rejected, there are many possibilities.
For example, \(\mu_{1} \neq \mu_{2} = \ldots = \mu_{T}\) is one possibility, as is \(\mu_{1} = \mu_{2} \neq \mu_{3} = \ldots = \mu_{T}\). Many people make the mistake of stating the alternative hypothesis as \(mu_{1} \neq mu_{2} \neq \ldots \neq \mu_{T}\), which says that every mean differs from every other mean. This is a possibility, but only one of many possibilities. To cover all alternative outcomes, we resort to a verbal statement of "not all equal" and then follow up with mean comparisons to find out where differences among means exist. In our example, this means that fertilizer 1 may result in plants that are really tall, but fertilizers 2, 3, and the plants with no fertilizers don't differ from one another. A simpler way of thinking about this is that at least one mean is different from all others.
Step 3: Set \(\alpha\)
If we look at what can happen in a hypothesis test, we can construct the following contingency table:
You should be familiar with type I and type II errors from your introductory course. It is important to note that we want to set \(\alpha\) before the experiment ( a priori ) because the Type I error is the more grievous error to make. The typical value of \(\alpha\) is 0.05, establishing a 95% confidence level. For this course, we will assume \(\alpha\) =0.05, unless stated otherwise.
Step 4: Collect Data
Remember the importance of recognizing whether data is collected through an experimental design or observational study.
Step 5: Calculate a test statistic
For categorical treatment level means, we use an \(F\) statistic, named after R.A. Fisher. We will explore the mechanics of computing the \(F\) statistic beginning in Chapter 2. The \(F\) value we get from the data is labeled \(F_{\text{calculated}}\).
Step 6: Construct Acceptance / Rejection regions
As with all other test statistics, a threshold (critical) value of \(F\) is established. This \(F\) value can be obtained from statistical tables or software and is referred to as \(F_{\text{critical}}\) or \(F_{\alpha}\). As a reminder, this critical value is the minimum value for the test statistic (in this case the F test) for us to be able to reject the null.
The \(F\) distribution, \(F_{\alpha}\), and the location of acceptance and rejection regions are shown in the graph below:
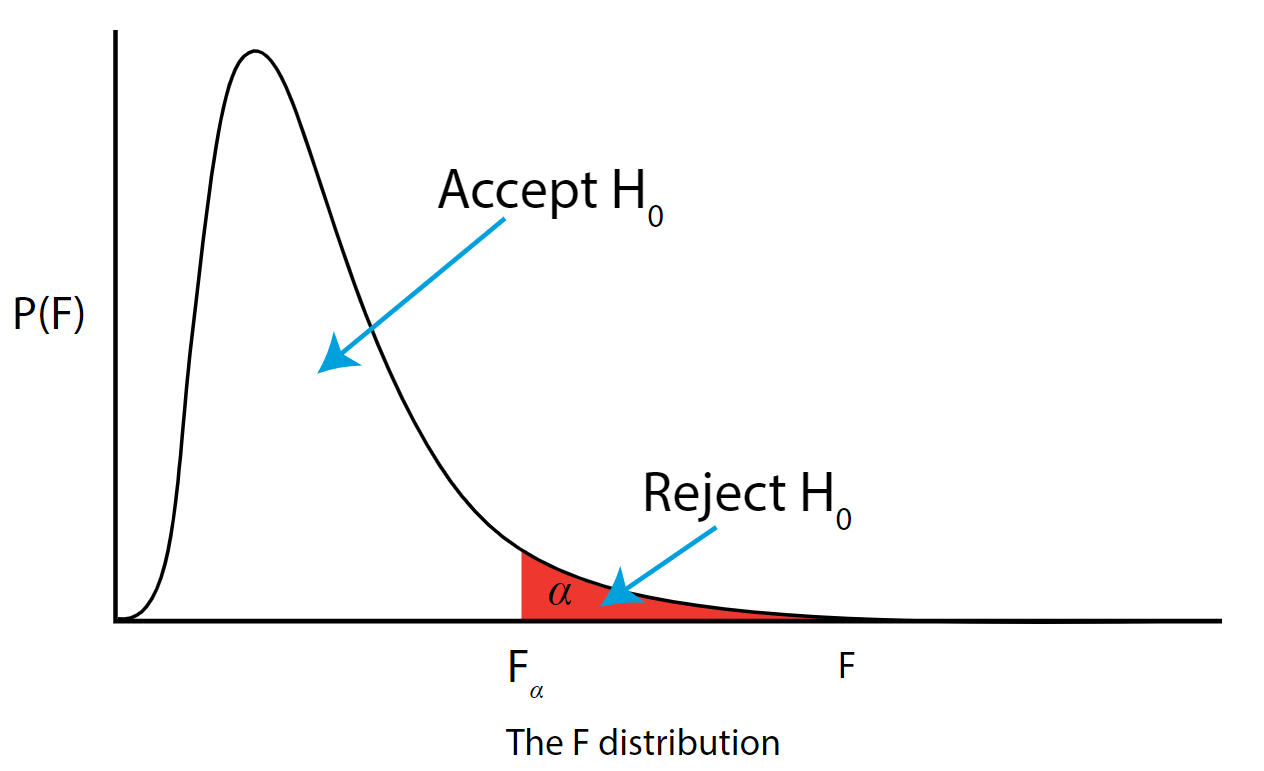.png?revision=1&size=bestfit&width=629&height=383 "what is a hypothesis testing in research")
Step 7: Based on steps 5 and 6, draw a conclusion about H0
If the \(F_{\text{\calculated}}\) from the data is larger than the \(F_{\alpha}\), then you are in the rejection region and you can reject the null hypothesis with \((1 - \alpha)\) level of confidence.
Note that modern statistical software condenses steps 6 and 7 by providing a \(p\)-value. The \(p\)-value here is the probability of getting an \(F_{\text{calculated}}\) even greater than what you observe assuming the null hypothesis is true. If by chance, the \(F_{\text{calculated}} = F_{\alpha}\), then the \(p\)-value would exactly equal \(\alpha\). With larger \(F_{\text{calculated}}\) values, we move further into the rejection region and the \(p\) - value becomes less than \(\alpha\). So the decision rule is as follows:
If the \(p\) - value obtained from the ANOVA is less than \(\alpha\), then reject \(H_{0}\) and accept \(H_{A}\).
If you are not familiar with this material, we suggest that you review course materials from your basic statistics course.
- Bipolar Disorder
- Therapy Center
- When To See a Therapist
- Types of Therapy
- Best Online Therapy
- Best Couples Therapy
- Best Family Therapy
- Managing Stress
- Sleep and Dreaming
- Understanding Emotions
- Self-Improvement
- Healthy Relationships
- Student Resources
- Personality Types
- Guided Meditations
- Verywell Mind Insights
- 2024 Verywell Mind 25
- Mental Health in the Classroom
- Editorial Process
- Meet Our Review Board
- Crisis Support
How to Write a Great Hypothesis
Hypothesis Definition, Format, Examples, and Tips
Kendra Cherry, MS, is a psychosocial rehabilitation specialist, psychology educator, and author of the "Everything Psychology Book."
:max_bytes(150000):strip_icc():format(webp)/IMG_9791-89504ab694d54b66bbd72cb84ffb860e.jpg "what is a hypothesis testing in research")
Amy Morin, LCSW, is a psychotherapist and international bestselling author. Her books, including "13 Things Mentally Strong People Don't Do," have been translated into more than 40 languages. Her TEDx talk, "The Secret of Becoming Mentally Strong," is one of the most viewed talks of all time.
:max_bytes(150000):strip_icc():format(webp)/VW-MIND-Amy-2b338105f1ee493f94d7e333e410fa76.jpg "what is a hypothesis testing in research")
Verywell / Alex Dos Diaz
- The Scientific Method
Hypothesis Format
Falsifiability of a hypothesis.
- Operationalization
Hypothesis Types
Hypotheses examples.
- Collecting Data
A hypothesis is a tentative statement about the relationship between two or more variables. It is a specific, testable prediction about what you expect to happen in a study. It is a preliminary answer to your question that helps guide the research process.
Consider a study designed to examine the relationship between sleep deprivation and test performance. The hypothesis might be: "This study is designed to assess the hypothesis that sleep-deprived people will perform worse on a test than individuals who are not sleep-deprived."
At a Glance
A hypothesis is crucial to scientific research because it offers a clear direction for what the researchers are looking to find. This allows them to design experiments to test their predictions and add to our scientific knowledge about the world. This article explores how a hypothesis is used in psychology research, how to write a good hypothesis, and the different types of hypotheses you might use.
The Hypothesis in the Scientific Method
In the scientific method , whether it involves research in psychology, biology, or some other area, a hypothesis represents what the researchers think will happen in an experiment. The scientific method involves the following steps:
- Forming a question
- Performing background research
- Creating a hypothesis
- Designing an experiment
- Collecting data
- Analyzing the results
- Drawing conclusions
- Communicating the results
The hypothesis is a prediction, but it involves more than a guess. Most of the time, the hypothesis begins with a question which is then explored through background research. At this point, researchers then begin to develop a testable hypothesis.
Unless you are creating an exploratory study, your hypothesis should always explain what you expect to happen.
In a study exploring the effects of a particular drug, the hypothesis might be that researchers expect the drug to have some type of effect on the symptoms of a specific illness. In psychology, the hypothesis might focus on how a certain aspect of the environment might influence a particular behavior.
Remember, a hypothesis does not have to be correct. While the hypothesis predicts what the researchers expect to see, the goal of the research is to determine whether this guess is right or wrong. When conducting an experiment, researchers might explore numerous factors to determine which ones might contribute to the ultimate outcome.
In many cases, researchers may find that the results of an experiment do not support the original hypothesis. When writing up these results, the researchers might suggest other options that should be explored in future studies.
In many cases, researchers might draw a hypothesis from a specific theory or build on previous research. For example, prior research has shown that stress can impact the immune system. So a researcher might hypothesize: "People with high-stress levels will be more likely to contract a common cold after being exposed to the virus than people who have low-stress levels."
In other instances, researchers might look at commonly held beliefs or folk wisdom. "Birds of a feather flock together" is one example of folk adage that a psychologist might try to investigate. The researcher might pose a specific hypothesis that "People tend to select romantic partners who are similar to them in interests and educational level."
Elements of a Good Hypothesis
So how do you write a good hypothesis? When trying to come up with a hypothesis for your research or experiments, ask yourself the following questions:
- Is your hypothesis based on your research on a topic?
- Can your hypothesis be tested?
- Does your hypothesis include independent and dependent variables?
Before you come up with a specific hypothesis, spend some time doing background research. Once you have completed a literature review, start thinking about potential questions you still have. Pay attention to the discussion section in the journal articles you read . Many authors will suggest questions that still need to be explored.
How to Formulate a Good Hypothesis
To form a hypothesis, you should take these steps:
- Collect as many observations about a topic or problem as you can.
- Evaluate these observations and look for possible causes of the problem.
- Create a list of possible explanations that you might want to explore.
- After you have developed some possible hypotheses, think of ways that you could confirm or disprove each hypothesis through experimentation. This is known as falsifiability.
In the scientific method , falsifiability is an important part of any valid hypothesis. In order to test a claim scientifically, it must be possible that the claim could be proven false.
Students sometimes confuse the idea of falsifiability with the idea that it means that something is false, which is not the case. What falsifiability means is that if something was false, then it is possible to demonstrate that it is false.
One of the hallmarks of pseudoscience is that it makes claims that cannot be refuted or proven false.
The Importance of Operational Definitions
A variable is a factor or element that can be changed and manipulated in ways that are observable and measurable. However, the researcher must also define how the variable will be manipulated and measured in the study.
Operational definitions are specific definitions for all relevant factors in a study. This process helps make vague or ambiguous concepts detailed and measurable.
For example, a researcher might operationally define the variable " test anxiety " as the results of a self-report measure of anxiety experienced during an exam. A "study habits" variable might be defined by the amount of studying that actually occurs as measured by time.
These precise descriptions are important because many things can be measured in various ways. Clearly defining these variables and how they are measured helps ensure that other researchers can replicate your results.
Replicability
One of the basic principles of any type of scientific research is that the results must be replicable.
Replication means repeating an experiment in the same way to produce the same results. By clearly detailing the specifics of how the variables were measured and manipulated, other researchers can better understand the results and repeat the study if needed.
Some variables are more difficult than others to define. For example, how would you operationally define a variable such as aggression ? For obvious ethical reasons, researchers cannot create a situation in which a person behaves aggressively toward others.
To measure this variable, the researcher must devise a measurement that assesses aggressive behavior without harming others. The researcher might utilize a simulated task to measure aggressiveness in this situation.
Hypothesis Checklist
- Does your hypothesis focus on something that you can actually test?
- Does your hypothesis include both an independent and dependent variable?
- Can you manipulate the variables?
- Can your hypothesis be tested without violating ethical standards?
The hypothesis you use will depend on what you are investigating and hoping to find. Some of the main types of hypotheses that you might use include:
- Simple hypothesis : This type of hypothesis suggests there is a relationship between one independent variable and one dependent variable.
- Complex hypothesis : This type suggests a relationship between three or more variables, such as two independent and dependent variables.
- Null hypothesis : This hypothesis suggests no relationship exists between two or more variables.
- Alternative hypothesis : This hypothesis states the opposite of the null hypothesis.
- Statistical hypothesis : This hypothesis uses statistical analysis to evaluate a representative population sample and then generalizes the findings to the larger group.
- Logical hypothesis : This hypothesis assumes a relationship between variables without collecting data or evidence.
A hypothesis often follows a basic format of "If {this happens} then {this will happen}." One way to structure your hypothesis is to describe what will happen to the dependent variable if you change the independent variable .
The basic format might be: "If {these changes are made to a certain independent variable}, then we will observe {a change in a specific dependent variable}."
A few examples of simple hypotheses:
- "Students who eat breakfast will perform better on a math exam than students who do not eat breakfast."
- "Students who experience test anxiety before an English exam will get lower scores than students who do not experience test anxiety."
- "Motorists who talk on the phone while driving will be more likely to make errors on a driving course than those who do not talk on the phone."
- "Children who receive a new reading intervention will have higher reading scores than students who do not receive the intervention."
Examples of a complex hypothesis include:
- "People with high-sugar diets and sedentary activity levels are more likely to develop depression."
- "Younger people who are regularly exposed to green, outdoor areas have better subjective well-being than older adults who have limited exposure to green spaces."
Examples of a null hypothesis include:
- "There is no difference in anxiety levels between people who take St. John's wort supplements and those who do not."
- "There is no difference in scores on a memory recall task between children and adults."
- "There is no difference in aggression levels between children who play first-person shooter games and those who do not."
Examples of an alternative hypothesis:
- "People who take St. John's wort supplements will have less anxiety than those who do not."
- "Adults will perform better on a memory task than children."
- "Children who play first-person shooter games will show higher levels of aggression than children who do not."
Collecting Data on Your Hypothesis
Once a researcher has formed a testable hypothesis, the next step is to select a research design and start collecting data. The research method depends largely on exactly what they are studying. There are two basic types of research methods: descriptive research and experimental research.
Descriptive Research Methods
Descriptive research such as case studies , naturalistic observations , and surveys are often used when conducting an experiment is difficult or impossible. These methods are best used to describe different aspects of a behavior or psychological phenomenon.
Once a researcher has collected data using descriptive methods, a correlational study can examine how the variables are related. This research method might be used to investigate a hypothesis that is difficult to test experimentally.
Experimental Research Methods
Experimental methods are used to demonstrate causal relationships between variables. In an experiment, the researcher systematically manipulates a variable of interest (known as the independent variable) and measures the effect on another variable (known as the dependent variable).
Unlike correlational studies, which can only be used to determine if there is a relationship between two variables, experimental methods can be used to determine the actual nature of the relationship—whether changes in one variable actually cause another to change.
The hypothesis is a critical part of any scientific exploration. It represents what researchers expect to find in a study or experiment. In situations where the hypothesis is unsupported by the research, the research still has value. Such research helps us better understand how different aspects of the natural world relate to one another. It also helps us develop new hypotheses that can then be tested in the future.
Thompson WH, Skau S. On the scope of scientific hypotheses . R Soc Open Sci . 2023;10(8):230607. doi:10.1098/rsos.230607
Taran S, Adhikari NKJ, Fan E. Falsifiability in medicine: what clinicians can learn from Karl Popper [published correction appears in Intensive Care Med. 2021 Jun 17;:]. Intensive Care Med . 2021;47(9):1054-1056. doi:10.1007/s00134-021-06432-z
Eyler AA. Research Methods for Public Health . 1st ed. Springer Publishing Company; 2020. doi:10.1891/9780826182067.0004
Nosek BA, Errington TM. What is replication ? PLoS Biol . 2020;18(3):e3000691. doi:10.1371/journal.pbio.3000691
Aggarwal R, Ranganathan P. Study designs: Part 2 - Descriptive studies . Perspect Clin Res . 2019;10(1):34-36. doi:10.4103/picr.PICR_154_18
Nevid J. Psychology: Concepts and Applications. Wadworth, 2013.
By Kendra Cherry, MSEd Kendra Cherry, MS, is a psychosocial rehabilitation specialist, psychology educator, and author of the "Everything Psychology Book."
Tutorial Playlist
Statistics tutorial, everything you need to know about the probability density function in statistics, the best guide to understand central limit theorem, an in-depth guide to measures of central tendency : mean, median and mode, the ultimate guide to understand conditional probability.
A Comprehensive Look at Percentile in Statistics
The Best Guide to Understand Bayes Theorem
Everything you need to know about the normal distribution, an in-depth explanation of cumulative distribution function, a complete guide to chi-square test, a complete guide on hypothesis testing in statistics, understanding the fundamentals of arithmetic and geometric progression, the definitive guide to understand spearman’s rank correlation, a comprehensive guide to understand mean squared error, all you need to know about the empirical rule in statistics, the complete guide to skewness and kurtosis, a holistic look at bernoulli distribution.
All You Need to Know About Bias in Statistics
A Complete Guide to Get a Grasp of Time Series Analysis
The Key Differences Between Z-Test Vs. T-Test
The Complete Guide to Understand Pearson's Correlation
A complete guide on the types of statistical studies, everything you need to know about poisson distribution, your best guide to understand correlation vs. regression, the most comprehensive guide for beginners on what is correlation, what is hypothesis testing in statistics types and examples.
Lesson 10 of 24 By Avijeet Biswal

Table of Contents
In today’s data-driven world , decisions are based on data all the time. Hypothesis plays a crucial role in that process, whether it may be making business decisions, in the health sector, academia, or in quality improvement. Without hypothesis & hypothesis tests, you risk drawing the wrong conclusions and making bad decisions. In this tutorial, you will look at Hypothesis Testing in Statistics.
What Is Hypothesis Testing in Statistics?
Hypothesis Testing is a type of statistical analysis in which you put your assumptions about a population parameter to the test. It is used to estimate the relationship between 2 statistical variables.
Let's discuss few examples of statistical hypothesis from real-life -
- A teacher assumes that 60% of his college's students come from lower-middle-class families.
- A doctor believes that 3D (Diet, Dose, and Discipline) is 90% effective for diabetic patients.
Now that you know about hypothesis testing, look at the two types of hypothesis testing in statistics.
Hypothesis Testing Formula
Z = ( x̅ – μ0 ) / (σ /√n)
- Here, x̅ is the sample mean,
- μ0 is the population mean,
- σ is the standard deviation,
- n is the sample size.
How Hypothesis Testing Works?
An analyst performs hypothesis testing on a statistical sample to present evidence of the plausibility of the null hypothesis. Measurements and analyses are conducted on a random sample of the population to test a theory. Analysts use a random population sample to test two hypotheses: the null and alternative hypotheses.
The null hypothesis is typically an equality hypothesis between population parameters; for example, a null hypothesis may claim that the population means return equals zero. The alternate hypothesis is essentially the inverse of the null hypothesis (e.g., the population means the return is not equal to zero). As a result, they are mutually exclusive, and only one can be correct. One of the two possibilities, however, will always be correct.
Your Dream Career is Just Around The Corner!
Null Hypothesis and Alternate Hypothesis
The Null Hypothesis is the assumption that the event will not occur. A null hypothesis has no bearing on the study's outcome unless it is rejected.
H0 is the symbol for it, and it is pronounced H-naught.
The Alternate Hypothesis is the logical opposite of the null hypothesis. The acceptance of the alternative hypothesis follows the rejection of the null hypothesis. H1 is the symbol for it.
Let's understand this with an example.
A sanitizer manufacturer claims that its product kills 95 percent of germs on average.
To put this company's claim to the test, create a null and alternate hypothesis.
H0 (Null Hypothesis): Average = 95%.
Alternative Hypothesis (H1): The average is less than 95%.
Another straightforward example to understand this concept is determining whether or not a coin is fair and balanced. The null hypothesis states that the probability of a show of heads is equal to the likelihood of a show of tails. In contrast, the alternate theory states that the probability of a show of heads and tails would be very different.
Become a Data Scientist with Hands-on Training!
Hypothesis Testing Calculation With Examples
Let's consider a hypothesis test for the average height of women in the United States. Suppose our null hypothesis is that the average height is 5'4". We gather a sample of 100 women and determine that their average height is 5'5". The standard deviation of population is 2.
To calculate the z-score, we would use the following formula:
z = ( x̅ – μ0 ) / (σ /√n)
z = (5'5" - 5'4") / (2" / √100)
z = 0.5 / (0.045)
We will reject the null hypothesis as the z-score of 11.11 is very large and conclude that there is evidence to suggest that the average height of women in the US is greater than 5'4".
Steps of Hypothesis Testing
Step 1: specify your null and alternate hypotheses.
It is critical to rephrase your original research hypothesis (the prediction that you wish to study) as a null (Ho) and alternative (Ha) hypothesis so that you can test it quantitatively. Your first hypothesis, which predicts a link between variables, is generally your alternate hypothesis. The null hypothesis predicts no link between the variables of interest.
Step 2: Gather Data
For a statistical test to be legitimate, sampling and data collection must be done in a way that is meant to test your hypothesis. You cannot draw statistical conclusions about the population you are interested in if your data is not representative.
Step 3: Conduct a Statistical Test
Other statistical tests are available, but they all compare within-group variance (how to spread out the data inside a category) against between-group variance (how different the categories are from one another). If the between-group variation is big enough that there is little or no overlap between groups, your statistical test will display a low p-value to represent this. This suggests that the disparities between these groups are unlikely to have occurred by accident. Alternatively, if there is a large within-group variance and a low between-group variance, your statistical test will show a high p-value. Any difference you find across groups is most likely attributable to chance. The variety of variables and the level of measurement of your obtained data will influence your statistical test selection.
Step 4: Determine Rejection Of Your Null Hypothesis
Your statistical test results must determine whether your null hypothesis should be rejected or not. In most circumstances, you will base your judgment on the p-value provided by the statistical test. In most circumstances, your preset level of significance for rejecting the null hypothesis will be 0.05 - that is, when there is less than a 5% likelihood that these data would be seen if the null hypothesis were true. In other circumstances, researchers use a lower level of significance, such as 0.01 (1%). This reduces the possibility of wrongly rejecting the null hypothesis.
Step 5: Present Your Results
The findings of hypothesis testing will be discussed in the results and discussion portions of your research paper, dissertation, or thesis. You should include a concise overview of the data and a summary of the findings of your statistical test in the results section. You can talk about whether your results confirmed your initial hypothesis or not in the conversation. Rejecting or failing to reject the null hypothesis is a formal term used in hypothesis testing. This is likely a must for your statistics assignments.
Types of Hypothesis Testing
To determine whether a discovery or relationship is statistically significant, hypothesis testing uses a z-test. It usually checks to see if two means are the same (the null hypothesis). Only when the population standard deviation is known and the sample size is 30 data points or more, can a z-test be applied.
A statistical test called a t-test is employed to compare the means of two groups. To determine whether two groups differ or if a procedure or treatment affects the population of interest, it is frequently used in hypothesis testing.
Chi-Square
You utilize a Chi-square test for hypothesis testing concerning whether your data is as predicted. To determine if the expected and observed results are well-fitted, the Chi-square test analyzes the differences between categorical variables from a random sample. The test's fundamental premise is that the observed values in your data should be compared to the predicted values that would be present if the null hypothesis were true.
Hypothesis Testing and Confidence Intervals
Both confidence intervals and hypothesis tests are inferential techniques that depend on approximating the sample distribution. Data from a sample is used to estimate a population parameter using confidence intervals. Data from a sample is used in hypothesis testing to examine a given hypothesis. We must have a postulated parameter to conduct hypothesis testing.
Bootstrap distributions and randomization distributions are created using comparable simulation techniques. The observed sample statistic is the focal point of a bootstrap distribution, whereas the null hypothesis value is the focal point of a randomization distribution.
A variety of feasible population parameter estimates are included in confidence ranges. In this lesson, we created just two-tailed confidence intervals. There is a direct connection between these two-tail confidence intervals and these two-tail hypothesis tests. The results of a two-tailed hypothesis test and two-tailed confidence intervals typically provide the same results. In other words, a hypothesis test at the 0.05 level will virtually always fail to reject the null hypothesis if the 95% confidence interval contains the predicted value. A hypothesis test at the 0.05 level will nearly certainly reject the null hypothesis if the 95% confidence interval does not include the hypothesized parameter.
Simple and Composite Hypothesis Testing
Depending on the population distribution, you can classify the statistical hypothesis into two types.
Simple Hypothesis: A simple hypothesis specifies an exact value for the parameter.
Composite Hypothesis: A composite hypothesis specifies a range of values.
A company is claiming that their average sales for this quarter are 1000 units. This is an example of a simple hypothesis.
Suppose the company claims that the sales are in the range of 900 to 1000 units. Then this is a case of a composite hypothesis.
One-Tailed and Two-Tailed Hypothesis Testing
The One-Tailed test, also called a directional test, considers a critical region of data that would result in the null hypothesis being rejected if the test sample falls into it, inevitably meaning the acceptance of the alternate hypothesis.
In a one-tailed test, the critical distribution area is one-sided, meaning the test sample is either greater or lesser than a specific value.
In two tails, the test sample is checked to be greater or less than a range of values in a Two-Tailed test, implying that the critical distribution area is two-sided.
If the sample falls within this range, the alternate hypothesis will be accepted, and the null hypothesis will be rejected.
Become a Data Scientist With Real-World Experience
Right Tailed Hypothesis Testing
If the larger than (>) sign appears in your hypothesis statement, you are using a right-tailed test, also known as an upper test. Or, to put it another way, the disparity is to the right. For instance, you can contrast the battery life before and after a change in production. Your hypothesis statements can be the following if you want to know if the battery life is longer than the original (let's say 90 hours):
- The null hypothesis is (H0 <= 90) or less change.
- A possibility is that battery life has risen (H1) > 90.
The crucial point in this situation is that the alternate hypothesis (H1), not the null hypothesis, decides whether you get a right-tailed test.
Left Tailed Hypothesis Testing
Alternative hypotheses that assert the true value of a parameter is lower than the null hypothesis are tested with a left-tailed test; they are indicated by the asterisk "<".
Suppose H0: mean = 50 and H1: mean not equal to 50
According to the H1, the mean can be greater than or less than 50. This is an example of a Two-tailed test.
In a similar manner, if H0: mean >=50, then H1: mean <50
Here the mean is less than 50. It is called a One-tailed test.
Type 1 and Type 2 Error
A hypothesis test can result in two types of errors.
Type 1 Error: A Type-I error occurs when sample results reject the null hypothesis despite being true.
Type 2 Error: A Type-II error occurs when the null hypothesis is not rejected when it is false, unlike a Type-I error.
Suppose a teacher evaluates the examination paper to decide whether a student passes or fails.
H0: Student has passed
H1: Student has failed
Type I error will be the teacher failing the student [rejects H0] although the student scored the passing marks [H0 was true].
Type II error will be the case where the teacher passes the student [do not reject H0] although the student did not score the passing marks [H1 is true].
Level of Significance
The alpha value is a criterion for determining whether a test statistic is statistically significant. In a statistical test, Alpha represents an acceptable probability of a Type I error. Because alpha is a probability, it can be anywhere between 0 and 1. In practice, the most commonly used alpha values are 0.01, 0.05, and 0.1, which represent a 1%, 5%, and 10% chance of a Type I error, respectively (i.e. rejecting the null hypothesis when it is in fact correct).
Future-Proof Your AI/ML Career: Top Dos and Don'ts
A p-value is a metric that expresses the likelihood that an observed difference could have occurred by chance. As the p-value decreases the statistical significance of the observed difference increases. If the p-value is too low, you reject the null hypothesis.
Here you have taken an example in which you are trying to test whether the new advertising campaign has increased the product's sales. The p-value is the likelihood that the null hypothesis, which states that there is no change in the sales due to the new advertising campaign, is true. If the p-value is .30, then there is a 30% chance that there is no increase or decrease in the product's sales. If the p-value is 0.03, then there is a 3% probability that there is no increase or decrease in the sales value due to the new advertising campaign. As you can see, the lower the p-value, the chances of the alternate hypothesis being true increases, which means that the new advertising campaign causes an increase or decrease in sales.
Why is Hypothesis Testing Important in Research Methodology?
Hypothesis testing is crucial in research methodology for several reasons:
- Provides evidence-based conclusions: It allows researchers to make objective conclusions based on empirical data, providing evidence to support or refute their research hypotheses.
- Supports decision-making: It helps make informed decisions, such as accepting or rejecting a new treatment, implementing policy changes, or adopting new practices.
- Adds rigor and validity: It adds scientific rigor to research using statistical methods to analyze data, ensuring that conclusions are based on sound statistical evidence.
- Contributes to the advancement of knowledge: By testing hypotheses, researchers contribute to the growth of knowledge in their respective fields by confirming existing theories or discovering new patterns and relationships.
Limitations of Hypothesis Testing
Hypothesis testing has some limitations that researchers should be aware of:
- It cannot prove or establish the truth: Hypothesis testing provides evidence to support or reject a hypothesis, but it cannot confirm the absolute truth of the research question.
- Results are sample-specific: Hypothesis testing is based on analyzing a sample from a population, and the conclusions drawn are specific to that particular sample.
- Possible errors: During hypothesis testing, there is a chance of committing type I error (rejecting a true null hypothesis) or type II error (failing to reject a false null hypothesis).
- Assumptions and requirements: Different tests have specific assumptions and requirements that must be met to accurately interpret results.
After reading this tutorial, you would have a much better understanding of hypothesis testing, one of the most important concepts in the field of Data Science . The majority of hypotheses are based on speculation about observed behavior, natural phenomena, or established theories.
If you are interested in statistics of data science and skills needed for such a career, you ought to explore Simplilearn’s Post Graduate Program in Data Science.
If you have any questions regarding this ‘Hypothesis Testing In Statistics’ tutorial, do share them in the comment section. Our subject matter expert will respond to your queries. Happy learning!
1. What is hypothesis testing in statistics with example?
Hypothesis testing is a statistical method used to determine if there is enough evidence in a sample data to draw conclusions about a population. It involves formulating two competing hypotheses, the null hypothesis (H0) and the alternative hypothesis (Ha), and then collecting data to assess the evidence. An example: testing if a new drug improves patient recovery (Ha) compared to the standard treatment (H0) based on collected patient data.
2. What is hypothesis testing and its types?
Hypothesis testing is a statistical method used to make inferences about a population based on sample data. It involves formulating two hypotheses: the null hypothesis (H0), which represents the default assumption, and the alternative hypothesis (Ha), which contradicts H0. The goal is to assess the evidence and determine whether there is enough statistical significance to reject the null hypothesis in favor of the alternative hypothesis.
Types of hypothesis testing:
- One-sample test: Used to compare a sample to a known value or a hypothesized value.
- Two-sample test: Compares two independent samples to assess if there is a significant difference between their means or distributions.
- Paired-sample test: Compares two related samples, such as pre-test and post-test data, to evaluate changes within the same subjects over time or under different conditions.
- Chi-square test: Used to analyze categorical data and determine if there is a significant association between variables.
- ANOVA (Analysis of Variance): Compares means across multiple groups to check if there is a significant difference between them.
3. What are the steps of hypothesis testing?
The steps of hypothesis testing are as follows:
- Formulate the hypotheses: State the null hypothesis (H0) and the alternative hypothesis (Ha) based on the research question.
- Set the significance level: Determine the acceptable level of error (alpha) for making a decision.
- Collect and analyze data: Gather and process the sample data.
- Compute test statistic: Calculate the appropriate statistical test to assess the evidence.
- Make a decision: Compare the test statistic with critical values or p-values and determine whether to reject H0 in favor of Ha or not.
- Draw conclusions: Interpret the results and communicate the findings in the context of the research question.
4. What are the 2 types of hypothesis testing?
- One-tailed (or one-sided) test: Tests for the significance of an effect in only one direction, either positive or negative.
- Two-tailed (or two-sided) test: Tests for the significance of an effect in both directions, allowing for the possibility of a positive or negative effect.
The choice between one-tailed and two-tailed tests depends on the specific research question and the directionality of the expected effect.
5. What are the 3 major types of hypothesis?
The three major types of hypotheses are:
- Null Hypothesis (H0): Represents the default assumption, stating that there is no significant effect or relationship in the data.
- Alternative Hypothesis (Ha): Contradicts the null hypothesis and proposes a specific effect or relationship that researchers want to investigate.
- Nondirectional Hypothesis: An alternative hypothesis that doesn't specify the direction of the effect, leaving it open for both positive and negative possibilities.
Find our Data Analyst Online Bootcamp in top cities:
About the author.
Avijeet is a Senior Research Analyst at Simplilearn. Passionate about Data Analytics, Machine Learning, and Deep Learning, Avijeet is also interested in politics, cricket, and football.
Recommended Resources
Free eBook: Top Programming Languages For A Data Scientist
Normality Test in Minitab: Minitab with Statistics
Machine Learning Career Guide: A Playbook to Becoming a Machine Learning Engineer
- PMP, PMI, PMBOK, CAPM, PgMP, PfMP, ACP, PBA, RMP, SP, and OPM3 are registered marks of the Project Management Institute, Inc.
- > Machine Learning
- > Statistics
What is Hypothesis Testing? Types and Methods
- Soumyaa Rawat
- Jul 23, 2021

Hypothesis Testing
Hypothesis testing is the act of testing a hypothesis or a supposition in relation to a statistical parameter. Analysts implement hypothesis testing in order to test if a hypothesis is plausible or not.
In data science and statistics , hypothesis testing is an important step as it involves the verification of an assumption that could help develop a statistical parameter. For instance, a researcher establishes a hypothesis assuming that the average of all odd numbers is an even number.
In order to find the plausibility of this hypothesis, the researcher will have to test the hypothesis using hypothesis testing methods. Unlike a hypothesis that is ‘supposed’ to stand true on the basis of little or no evidence, hypothesis testing is required to have plausible evidence in order to establish that a statistical hypothesis is true.
Perhaps this is where statistics play an important role. A number of components are involved in this process. But before understanding the process involved in hypothesis testing in research methodology, we shall first understand the types of hypotheses that are involved in the process. Let us get started!
Types of Hypotheses
In data sampling, different types of hypothesis are involved in finding whether the tested samples test positive for a hypothesis or not. In this segment, we shall discover the different types of hypotheses and understand the role they play in hypothesis testing.
Alternative Hypothesis
Alternative Hypothesis (H1) or the research hypothesis states that there is a relationship between two variables (where one variable affects the other). The alternative hypothesis is the main driving force for hypothesis testing.
It implies that the two variables are related to each other and the relationship that exists between them is not due to chance or coincidence.
When the process of hypothesis testing is carried out, the alternative hypothesis is the main subject of the testing process. The analyst intends to test the alternative hypothesis and verifies its plausibility.
Null Hypothesis
The Null Hypothesis (H0) aims to nullify the alternative hypothesis by implying that there exists no relation between two variables in statistics. It states that the effect of one variable on the other is solely due to chance and no empirical cause lies behind it.
The null hypothesis is established alongside the alternative hypothesis and is recognized as important as the latter. In hypothesis testing, the null hypothesis has a major role to play as it influences the testing against the alternative hypothesis.
(Must read: What is ANOVA test? )
Non-Directional Hypothesis
The Non-directional hypothesis states that the relation between two variables has no direction.
Simply put, it asserts that there exists a relation between two variables, but does not recognize the direction of effect, whether variable A affects variable B or vice versa.
Directional Hypothesis
The Directional hypothesis, on the other hand, asserts the direction of effect of the relationship that exists between two variables.
Herein, the hypothesis clearly states that variable A affects variable B, or vice versa.
Statistical Hypothesis
A statistical hypothesis is a hypothesis that can be verified to be plausible on the basis of statistics.
By using data sampling and statistical knowledge, one can determine the plausibility of a statistical hypothesis and find out if it stands true or not.
(Related blog: z-test vs t-test )
Performing Hypothesis Testing
Now that we have understood the types of hypotheses and the role they play in hypothesis testing, let us now move on to understand the process in a better manner.
In hypothesis testing, a researcher is first required to establish two hypotheses - alternative hypothesis and null hypothesis in order to begin with the procedure.
To establish these two hypotheses, one is required to study data samples, find a plausible pattern among the samples, and pen down a statistical hypothesis that they wish to test.
A random population of samples can be drawn, to begin with hypothesis testing. Among the two hypotheses, alternative and null, only one can be verified to be true. Perhaps the presence of both hypotheses is required to make the process successful.
At the end of the hypothesis testing procedure, either of the hypotheses will be rejected and the other one will be supported. Even though one of the two hypotheses turns out to be true, no hypothesis can ever be verified 100%.
(Read also: Types of data sampling techniques )
Therefore, a hypothesis can only be supported based on the statistical samples and verified data. Here is a step-by-step guide for hypothesis testing.
Establish the hypotheses
First things first, one is required to establish two hypotheses - alternative and null, that will set the foundation for hypothesis testing.
These hypotheses initiate the testing process that involves the researcher working on data samples in order to either support the alternative hypothesis or the null hypothesis.
Generate a testing plan
Once the hypotheses have been formulated, it is now time to generate a testing plan. A testing plan or an analysis plan involves the accumulation of data samples, determining which statistic is to be considered and laying out the sample size.
All these factors are very important while one is working on hypothesis testing.
Analyze data samples
As soon as a testing plan is ready, it is time to move on to the analysis part. Analysis of data samples involves configuring statistical values of samples, drawing them together, and deriving a pattern out of these samples.
While analyzing the data samples, a researcher needs to determine a set of things -
Significance Level - The level of significance in hypothesis testing indicates if a statistical result could have significance if the null hypothesis stands to be true.
Testing Method - The testing method involves a type of sampling-distribution and a test statistic that leads to hypothesis testing. There are a number of testing methods that can assist in the analysis of data samples.
Test statistic - Test statistic is a numerical summary of a data set that can be used to perform hypothesis testing.
P-value - The P-value interpretation is the probability of finding a sample statistic to be as extreme as the test statistic, indicating the plausibility of the null hypothesis.
Infer the results
The analysis of data samples leads to the inference of results that establishes whether the alternative hypothesis stands true or not. When the P-value is less than the significance level, the null hypothesis is rejected and the alternative hypothesis turns out to be plausible.
Methods of Hypothesis Testing
As we have already looked into different aspects of hypothesis testing, we shall now look into the different methods of hypothesis testing. All in all, there are 2 most common types of hypothesis testing methods. They are as follows -
Frequentist Hypothesis Testing
The frequentist hypothesis or the traditional approach to hypothesis testing is a hypothesis testing method that aims on making assumptions by considering current data.
The supposed truths and assumptions are based on the current data and a set of 2 hypotheses are formulated. A very popular subtype of the frequentist approach is the Null Hypothesis Significance Testing (NHST).
The NHST approach (involving the null and alternative hypothesis) has been one of the most sought-after methods of hypothesis testing in the field of statistics ever since its inception in the mid-1950s.
Bayesian Hypothesis Testing
A much unconventional and modern method of hypothesis testing, the Bayesian Hypothesis Testing claims to test a particular hypothesis in accordance with the past data samples, known as prior probability, and current data that lead to the plausibility of a hypothesis.
The result obtained indicates the posterior probability of the hypothesis. In this method, the researcher relies on ‘prior probability and posterior probability’ to conduct hypothesis testing on hand.
On the basis of this prior probability, the Bayesian approach tests a hypothesis to be true or false. The Bayes factor, a major component of this method, indicates the likelihood ratio among the null hypothesis and the alternative hypothesis.
The Bayes factor is the indicator of the plausibility of either of the two hypotheses that are established for hypothesis testing.
(Also read - Introduction to Bayesian Statistics )
To conclude, hypothesis testing, a way to verify the plausibility of a supposed assumption can be done through different methods - the Bayesian approach or the Frequentist approach.
Although the Bayesian approach relies on the prior probability of data samples, the frequentist approach assumes without a probability. A number of elements involved in hypothesis testing are - significance level, p-level, test statistic, and method of hypothesis testing.
(Also read: Introduction to probability distributions )
A significant way to determine whether a hypothesis stands true or not is to verify the data samples and identify the plausible hypothesis among the null hypothesis and alternative hypothesis.
Share Blog :
Be a part of our Instagram community
Trending blogs
5 Factors Influencing Consumer Behavior
Elasticity of Demand and its Types
What is PESTLE Analysis? Everything you need to know about it
An Overview of Descriptive Analysis
What is Managerial Economics? Definition, Types, Nature, Principles, and Scope
5 Factors Affecting the Price Elasticity of Demand (PED)
6 Major Branches of Artificial Intelligence (AI)
Scope of Managerial Economics
Dijkstra’s Algorithm: The Shortest Path Algorithm
Different Types of Research Methods
Latest Comments
- Search Search Please fill out this field.
What Is Hypothesis Testing?
- How It Works
4 Step Process
The bottom line.
- Fundamental Analysis
Hypothesis Testing: 4 Steps and Example
:max_bytes(150000):strip_icc():format(webp)/ChristinaMajaski-5c9433ea46e0fb0001d880b1.jpeg "what is a hypothesis testing in research")
Hypothesis testing, sometimes called significance testing, is an act in statistics whereby an analyst tests an assumption regarding a population parameter. The methodology employed by the analyst depends on the nature of the data used and the reason for the analysis.
Hypothesis testing is used to assess the plausibility of a hypothesis by using sample data. Such data may come from a larger population or a data-generating process. The word "population" will be used for both of these cases in the following descriptions.
Key Takeaways
- Hypothesis testing is used to assess the plausibility of a hypothesis by using sample data.
- The test provides evidence concerning the plausibility of the hypothesis, given the data.
- Statistical analysts test a hypothesis by measuring and examining a random sample of the population being analyzed.
- The four steps of hypothesis testing include stating the hypotheses, formulating an analysis plan, analyzing the sample data, and analyzing the result.
How Hypothesis Testing Works
In hypothesis testing, an analyst tests a statistical sample, intending to provide evidence on the plausibility of the null hypothesis. Statistical analysts measure and examine a random sample of the population being analyzed. All analysts use a random population sample to test two different hypotheses: the null hypothesis and the alternative hypothesis.
The null hypothesis is usually a hypothesis of equality between population parameters; e.g., a null hypothesis may state that the population mean return is equal to zero. The alternative hypothesis is effectively the opposite of a null hypothesis. Thus, they are mutually exclusive , and only one can be true. However, one of the two hypotheses will always be true.
The null hypothesis is a statement about a population parameter, such as the population mean, that is assumed to be true.
- State the hypotheses.
- Formulate an analysis plan, which outlines how the data will be evaluated.
- Carry out the plan and analyze the sample data.
- Analyze the results and either reject the null hypothesis, or state that the null hypothesis is plausible, given the data.
Example of Hypothesis Testing
If an individual wants to test that a penny has exactly a 50% chance of landing on heads, the null hypothesis would be that 50% is correct, and the alternative hypothesis would be that 50% is not correct. Mathematically, the null hypothesis is represented as Ho: P = 0.5. The alternative hypothesis is shown as "Ha" and is identical to the null hypothesis, except with the equal sign struck-through, meaning that it does not equal 50%.
A random sample of 100 coin flips is taken, and the null hypothesis is tested. If it is found that the 100 coin flips were distributed as 40 heads and 60 tails, the analyst would assume that a penny does not have a 50% chance of landing on heads and would reject the null hypothesis and accept the alternative hypothesis.
If there were 48 heads and 52 tails, then it is plausible that the coin could be fair and still produce such a result. In cases such as this where the null hypothesis is "accepted," the analyst states that the difference between the expected results (50 heads and 50 tails) and the observed results (48 heads and 52 tails) is "explainable by chance alone."
When Did Hypothesis Testing Begin?
Some statisticians attribute the first hypothesis tests to satirical writer John Arbuthnot in 1710, who studied male and female births in England after observing that in nearly every year, male births exceeded female births by a slight proportion. Arbuthnot calculated that the probability of this happening by chance was small, and therefore it was due to “divine providence.”
What are the Benefits of Hypothesis Testing?
Hypothesis testing helps assess the accuracy of new ideas or theories by testing them against data. This allows researchers to determine whether the evidence supports their hypothesis, helping to avoid false claims and conclusions. Hypothesis testing also provides a framework for decision-making based on data rather than personal opinions or biases. By relying on statistical analysis, hypothesis testing helps to reduce the effects of chance and confounding variables, providing a robust framework for making informed conclusions.
What are the Limitations of Hypothesis Testing?
Hypothesis testing relies exclusively on data and doesn’t provide a comprehensive understanding of the subject being studied. Additionally, the accuracy of the results depends on the quality of the available data and the statistical methods used. Inaccurate data or inappropriate hypothesis formulation may lead to incorrect conclusions or failed tests. Hypothesis testing can also lead to errors, such as analysts either accepting or rejecting a null hypothesis when they shouldn’t have. These errors may result in false conclusions or missed opportunities to identify significant patterns or relationships in the data.
Hypothesis testing refers to a statistical process that helps researchers determine the reliability of a study. By using a well-formulated hypothesis and set of statistical tests, individuals or businesses can make inferences about the population that they are studying and draw conclusions based on the data presented. All hypothesis testing methods have the same four-step process, which includes stating the hypotheses, formulating an analysis plan, analyzing the sample data, and analyzing the result.
Sage. " Introduction to Hypothesis Testing ," Page 4.
Elder Research. " Who Invented the Null Hypothesis? "
Formplus. " Hypothesis Testing: Definition, Uses, Limitations and Examples ."
:max_bytes(150000):strip_icc():format(webp)/z-test.asp-final-81378e9e20704163ba30aad511c16e5d.jpg "what is a hypothesis testing in research")
- Terms of Service
- Editorial Policy
- Privacy Policy
- Your Privacy Choices
Hypothesis testing
When interpreting research findings, researchers need to assess whether these findings may have occurred by chance. Hypothesis testing is a systematic procedure for deciding whether the results of a research study support a particular theory which applies to a population.
Hypothesis testing uses sample data to evaluate a hypothesis about a population . A hypothesis test assesses how unusual the result is, whether it is reasonable chance variation or whether the result is too extreme to be considered chance variation.
Basic concepts
- Null and research hypothesis
Probability value and types of errors
Effect size and statistical significance.
- Directional and non-directional hypotheses
Null and research hypotheses
To carry out statistical hypothesis testing, research and null hypothesis are employed:
- Research hypothesis : this is the hypothesis that you propose, also known as the alternative hypothesis HA. For example:
H A: There is a relationship between intelligence and academic results.
H A: First year university students obtain higher grades after an intensive Statistics course.
H A; Males and females differ in their levels of stress.
- The null hypothesis (H o ) is the opposite of the research hypothesis and expresses that there is no relationship between variables, or no differences between groups; for example:
H o : There is no relationship between intelligence and academic results.
H o: First year university students do not obtain higher grades after an intensive Statistics course.
H o : Males and females will not differ in their levels of stress.
The purpose of hypothesis testing is to test whether the null hypothesis (there is no difference, no effect) can be rejected or approved. If the null hypothesis is rejected, then the research hypothesis can be accepted. If the null hypothesis is accepted, then the research hypothesis is rejected.
In hypothesis testing, a value is set to assess whether the null hypothesis is accepted or rejected and whether the result is statistically significant:
- A critical value is the score the sample would need to decide against the null hypothesis.
- A probability value is used to assess the significance of the statistical test. If the null hypothesis is rejected, then the alternative to the null hypothesis is accepted.
The probability value, or p value , is the probability of an outcome or research result given the hypothesis. Usually, the probability value is set at 0.05: the null hypothesis will be rejected if the probability value of the statistical test is less than 0.05. There are two types of errors associated to hypothesis testing:
- What if we observe a difference – but none exists in the population?
- What if we do not find a difference – but it does exist in the population?
These situations are known as Type I and Type II errors:
- Type I Error: is the type of error that involves the rejection of a null hypothesis that is actually true (i.e. a false positive).
- Type II Error: is the type of error that occurs when we do not reject a null hypothesis that is false (i.e. a false negative).

These errors cannot be eliminated; they can be minimised, but minimising one type of error will increase the probability of committing the other type.
The probability of making a Type I error depends on the criterion that is used to accept or reject the null hypothesis: the p value or alpha level . The alpha is set by the researcher, usually at .05, and is the chance the researcher is willing to take and still claim the significance of the statistical test.). Choosing a smaller alpha level will decrease the likelihood of committing Type I error.
For example, p<0.05 indicates that there are 5 chances in 100 that the difference observed was really due to sampling error – that 5% of the time a Type I error will occur or that there is a 5% chance that the opposite of the null hypothesis is actually true.
With a p<0.01, there will be 1 chance in 100 that the difference observed was really due to sampling error – 1% of the time a Type I error will occur.
The p level is specified before analysing the data. If the data analysis results in a probability value below the α (alpha) level, then the null hypothesis is rejected; if it is not, then the null hypothesis is not rejected.
When the null hypothesis is rejected, the effect is said to be statistically significant. However, statistical significance does not mean that the effect is important.
A result can be statistically significant, but the effect size may be small. Finding that an effect is significant does not provide information about how large or important the effect is. In fact, a small effect can be statistically significant if the sample size is large enough.
Information about the effect size, or magnitude of the result, is given by the statistical test. For example, the strength of the correlation between two variables is given by the coefficient of correlation, which varies from 0 to 1.
- A hypothesis that states that students who attend an intensive Statistics course will obtain higher grades than students who do not attend would be directional.
- A non-directional hypothesis states that there will be differences between students who attend do or don’t attend an intensive Statistics course, but we don’t know what group will get higher grades than the other. The hypothesis only states that they will obtain different grades.
The hypothesis testing process
The hypothesis testing process can be divided into five steps:
- Restate the research question as research hypothesis and a null hypothesis about the populations.
- Determine the characteristics of the comparison distribution.
- Determine the cut off sample score on the comparison distribution at which the null hypothesis should be rejected.
- Determine your sample’s score on the comparison distribution.
- Decide whether to reject the null hypothesis.
This example illustrates how these five steps can be applied to text a hypothesis:
- Let’s say that you conduct an experiment to investigate whether students’ ability to memorise words improves after they have consumed caffeine.
- The experiment involves two groups of students: the first group consumes caffeine; the second group drinks water.
- Both groups complete a memory test.
- A randomly selected individual in the experimental condition (i.e. the group that consumes caffeine) has a score of 27 on the memory test. The scores of people in general on this memory measure are normally distributed with a mean of 19 and a standard deviation of 4.
- The researcher predicts an effect (differences in memory for these groups) but does not predict a particular direction of effect (i.e. which group will have higher scores on the memory test). Using the 5% significance level, what should you conclude?
Step 1 : There are two populations of interest.
Population 1: People who go through the experimental procedure (drink coffee).
Population 2: People who do not go through the experimental procedure (drink water).
- Research hypothesis: Population 1 will score differently from Population 2.
- Null hypothesis: There will be no difference between the two populations.
Step 2 : We know that the characteristics of the comparison distribution (student population) are:
Population M = 19, Population SD= 4, normally distributed. These are the mean and standard deviation of the distribution of scores on the memory test for the general student population.
Step 3 : For a two-tailed test (the direction of the effect is not specified) at the 5% level (25% at each tail), the cut off sample scores are +1.96 and -1.99.
Step 4 : Your sample score of 27 needs to be converted into a Z value. To calculate Z = (27-19)/4= 2 ( check the Converting into Z scores section if you need to review how to do this process)
Step 5 : A ‘Z’ score of 2 is more extreme than the cut off Z of +1.96 (see figure above). The result is significant and, thus, the null hypothesis is rejected.
You can find more examples here:
- Statistics (RMIT Learning Lab)
Some commonly used statistical techniques
Correlation analysis, multiple regression.
- Analysis of variance
Chi-square test for independence
Correlation analysis explores the association between variables . The purpose of correlational analysis is to discover whether there is a relationship between variables, which is unlikely to occur by sampling error. The null hypothesis is that there is no relationship between the two variables. Correlation analysis provides information about:
- The direction of the relationship: positive or negative- given by the sign of the correlation coefficient.
- The strength or magnitude of the relationship between the two variables- given by the correlation coefficient, which varies from 0 (no relationship between the variables) to 1 (perfect relationship between the variables).
- Direction of the relationship.
A positive correlation indicates that high scores on one variable are associated with high scores on the other variable; low scores on one variable are associated with low scores on the second variable . For instance, in the figure below, higher scores on negative affect are associated with higher scores on perceived stress

A negative correlation indicates that high scores on one variable are associated with low scores on the other variable. The graph shows that a person who scores high on perceived stress will probably score low on mastery. The slope of the graph is downwards- as it moves to the right. In the figure below, higher scores on mastery are associated with lower scores on perceived stress.

Fig 2. Negative correlation between two variables. Adapted from Pallant, J. (2013). SPSS survival manual: A step by step guide to data analysis using IBM SPSS (5th ed.). Sydney, Melbourne, Auckland, London: Allen & Unwin
2. The strength or magnitude of the relationship
The strength of a linear relationship between two variables is measured by a statistic known as the correlation coefficient , which varies from 0 to -1, and from 0 to +1. There are several correlation coefficients; the most widely used are Pearson’s r and Spearman’s rho. The strength of the relationship is interpreted as follows:
- Small/weak: r= .10 to .29
- Medium/moderate: r= .30 to .49
- Large/strong: r= .50 to 1
It is important to note that correlation analysis does not imply causality. Correlation is used to explore the association between variables, however, it does not indicate that one variable causes the other. The correlation between two variables could be due to the fact that a third variable is affecting the two variables.
Multiple regression is an extension of correlation analysis. Multiple regression is used to explore the relationship between one dependent variable and a number of independent variables or predictors . The purpose of a multiple regression model is to predict values of a dependent variable based on the values of the independent variables or predictors. For example, a researcher may be interested in predicting students’ academic success (e.g. grades) based on a number of predictors, for example, hours spent studying, satisfaction with studies, relationships with peers and lecturers.
A multiple regression model can be conducted using statistical software (e.g. SPSS). The software will test the significance of the model (i.e. does the model significantly predicts scores on the dependent variable using the independent variables introduced in the model?), how much of the variance in the dependent variable is explained by the model, and the individual contribution of each independent variable.
Example of multiple regression model

From Dunn et al. (2014). Influence of academic self-regulation, critical thinking, and age on online graduate students' academic help-seeking.
In this model, help-seeking is the dependent variable; there are three independent variables or predictors. The coefficients show the direction (positive or negative) and magnitude of the relationship between each predictor and the dependent variable. The model was statistically significant and predicted 13.5% of the variance in help-seeking.
t-Tests are employed to compare the mean score on some continuous variable for two groups . The null hypothesis to be tested is there are no differences between the two groups (e.g. anxiety scores for males and females are not different).
If the significance value of the t-test is equal or less than .05, there is a significant difference in the mean scores on the variable of interest for each of the two groups. If the value is above .05, there is no significant difference between the groups.
t-Tests can be employed to compare the mean scores of two different groups (independent-samples t-test ) or to compare the same group of people on two different occasions ( paired-samples t-test) .
In addition to assessing whether the difference between the two groups is statistically significant, it is important to consider the effect size or magnitude of the difference between the groups. The effect size is given by partial eta squared (proportion of variance of the dependent variable that is explained by the independent variable) and Cohen’s d (difference between groups in terms of standard deviation units).
In this example, an independent samples t-test was conducted to assess whether males and females differ in their perceived anxiety levels. The significance of the test is .004. Since this value is less than .05, we can conclude that there is a statistically significant difference between males and females in their perceived anxiety levels.

Whilst t-tests compare the mean score on one variable for two groups, analysis of variance is used to test more than two groups . Following the previous example, analysis of variance would be employed to test whether there are differences in anxiety scores for students from different disciplines.
Analysis of variance compare the variance (variability in scores) between the different groups (believed to be due to the independent variable) with the variability within each group (believed to be due to chance). An F ratio is calculated; a large F ratio indicates that there is more variability between the groups (caused by the independent variable) than there is within each group (error term). A significant F test indicates that we can reject the null hypothesis; i.e. that there is no difference between the groups.
Again, effect size statistics such as Cohen’s d and eta squared are employed to assess the magnitude of the differences between groups.
In this example, we examined differences in perceived anxiety between students from different disciplines. The results of the Anova Test show that the significance level is .005. Since this value is below .05, we can conclude that there are statistically significant differences between students from different disciplines in their perceived anxiety levels.

Chi-square test for independence is used to explore the relationship between two categorical variables. Each variable can have two or more categories.
For example, a researcher can use a Chi-square test for independence to assess the relationship between study disciplines (e.g. Psychology, Business, Education,…) and help-seeking behaviour (Yes/No). The test compares the observed frequencies of cases with the values that would be expected if there was no association between the two variables of interest. A statistically significant Chi-square test indicates that the two variables are associated (e.g. Psychology students are more likely to seek help than Business students). The effect size is assessed using effect size statistics: Phi and Cramer’s V .
In this example, a Chi-square test was conducted to assess whether males and females differ in their help-seeking behaviour (Yes/No). The crosstabulation table shows the percentage of males of females who sought/didn't seek help. The table 'Chi square tests' shows the significance of the test (Pearson Chi square asymp sig: .482). Since this value is above .05, we conclude that there is no statistically significant difference between males and females in their help-seeking behaviour.

- << Previous: Probability and the normal distribution
- Next: Statistical techniques >>
What Is A Research (Scientific) Hypothesis? A plain-language explainer + examples
By: Derek Jansen (MBA) | Reviewed By: Dr Eunice Rautenbach | June 2020
If you’re new to the world of research, or it’s your first time writing a dissertation or thesis, you’re probably noticing that the words “research hypothesis” and “scientific hypothesis” are used quite a bit, and you’re wondering what they mean in a research context .
“Hypothesis” is one of those words that people use loosely, thinking they understand what it means. However, it has a very specific meaning within academic research. So, it’s important to understand the exact meaning before you start hypothesizing.
Research Hypothesis 101
- What is a hypothesis ?
- What is a research hypothesis (scientific hypothesis)?
- Requirements for a research hypothesis
- Definition of a research hypothesis
- The null hypothesis
What is a hypothesis?
Let’s start with the general definition of a hypothesis (not a research hypothesis or scientific hypothesis), according to the Cambridge Dictionary:
Hypothesis: an idea or explanation for something that is based on known facts but has not yet been proved.
In other words, it’s a statement that provides an explanation for why or how something works, based on facts (or some reasonable assumptions), but that has not yet been specifically tested . For example, a hypothesis might look something like this:
Hypothesis: sleep impacts academic performance.
This statement predicts that academic performance will be influenced by the amount and/or quality of sleep a student engages in – sounds reasonable, right? It’s based on reasonable assumptions , underpinned by what we currently know about sleep and health (from the existing literature). So, loosely speaking, we could call it a hypothesis, at least by the dictionary definition.
But that’s not good enough…
Unfortunately, that’s not quite sophisticated enough to describe a research hypothesis (also sometimes called a scientific hypothesis), and it wouldn’t be acceptable in a dissertation, thesis or research paper . In the world of academic research, a statement needs a few more criteria to constitute a true research hypothesis .
What is a research hypothesis?
A research hypothesis (also called a scientific hypothesis) is a statement about the expected outcome of a study (for example, a dissertation or thesis). To constitute a quality hypothesis, the statement needs to have three attributes – specificity , clarity and testability .
Let’s take a look at these more closely.
Need a helping hand?
Hypothesis Essential #1: Specificity & Clarity
A good research hypothesis needs to be extremely clear and articulate about both what’ s being assessed (who or what variables are involved ) and the expected outcome (for example, a difference between groups, a relationship between variables, etc.).
Let’s stick with our sleepy students example and look at how this statement could be more specific and clear.
Hypothesis: Students who sleep at least 8 hours per night will, on average, achieve higher grades in standardised tests than students who sleep less than 8 hours a night.
As you can see, the statement is very specific as it identifies the variables involved (sleep hours and test grades), the parties involved (two groups of students), as well as the predicted relationship type (a positive relationship). There’s no ambiguity or uncertainty about who or what is involved in the statement, and the expected outcome is clear.
Contrast that to the original hypothesis we looked at – “Sleep impacts academic performance” – and you can see the difference. “Sleep” and “academic performance” are both comparatively vague , and there’s no indication of what the expected relationship direction is (more sleep or less sleep). As you can see, specificity and clarity are key.

Hypothesis Essential #2: Testability (Provability)
A statement must be testable to qualify as a research hypothesis. In other words, there needs to be a way to prove (or disprove) the statement. If it’s not testable, it’s not a hypothesis – simple as that.
For example, consider the hypothesis we mentioned earlier:
Hypothesis: Students who sleep at least 8 hours per night will, on average, achieve higher grades in standardised tests than students who sleep less than 8 hours a night.
We could test this statement by undertaking a quantitative study involving two groups of students, one that gets 8 or more hours of sleep per night for a fixed period, and one that gets less. We could then compare the standardised test results for both groups to see if there’s a statistically significant difference.
Again, if you compare this to the original hypothesis we looked at – “Sleep impacts academic performance” – you can see that it would be quite difficult to test that statement, primarily because it isn’t specific enough. How much sleep? By who? What type of academic performance?
So, remember the mantra – if you can’t test it, it’s not a hypothesis 🙂

Defining A Research Hypothesis
You’re still with us? Great! Let’s recap and pin down a clear definition of a hypothesis.
A research hypothesis (or scientific hypothesis) is a statement about an expected relationship between variables, or explanation of an occurrence, that is clear, specific and testable.
So, when you write up hypotheses for your dissertation or thesis, make sure that they meet all these criteria. If you do, you’ll not only have rock-solid hypotheses but you’ll also ensure a clear focus for your entire research project.
What about the null hypothesis?
You may have also heard the terms null hypothesis , alternative hypothesis, or H-zero thrown around. At a simple level, the null hypothesis is the counter-proposal to the original hypothesis.
For example, if the hypothesis predicts that there is a relationship between two variables (for example, sleep and academic performance), the null hypothesis would predict that there is no relationship between those variables.
At a more technical level, the null hypothesis proposes that no statistical significance exists in a set of given observations and that any differences are due to chance alone.
And there you have it – hypotheses in a nutshell.
If you have any questions, be sure to leave a comment below and we’ll do our best to help you. If you need hands-on help developing and testing your hypotheses, consider our private coaching service , where we hold your hand through the research journey.

Psst... there’s more!
This post was based on one of our popular Research Bootcamps . If you're working on a research project, you'll definitely want to check this out ...
You Might Also Like:

16 Comments

Very useful information. I benefit more from getting more information in this regard.

Very great insight,educative and informative. Please give meet deep critics on many research data of public international Law like human rights, environment, natural resources, law of the sea etc

In a book I read a distinction is made between null, research, and alternative hypothesis. As far as I understand, alternative and research hypotheses are the same. Can you please elaborate? Best Afshin

This is a self explanatory, easy going site. I will recommend this to my friends and colleagues.

Very good definition. How can I cite your definition in my thesis? Thank you. Is nul hypothesis compulsory in a research?

It’s a counter-proposal to be proven as a rejection

Please what is the difference between alternate hypothesis and research hypothesis?

It is a very good explanation. However, it limits hypotheses to statistically tasteable ideas. What about for qualitative researches or other researches that involve quantitative data that don’t need statistical tests?

In qualitative research, one typically uses propositions, not hypotheses.

could you please elaborate it more

I’ve benefited greatly from these notes, thank you.

This is very helpful

well articulated ideas are presented here, thank you for being reliable sources of information

Excellent. Thanks for being clear and sound about the research methodology and hypothesis (quantitative research)
I have only a simple question regarding the null hypothesis. – Is the null hypothesis (Ho) known as the reversible hypothesis of the alternative hypothesis (H1? – How to test it in academic research?

this is very important note help me much more
Trackbacks/Pingbacks
- What Is Research Methodology? Simple Definition (With Examples) - Grad Coach - […] Contrasted to this, a quantitative methodology is typically used when the research aims and objectives are confirmatory in nature. For example,…
Submit a Comment Cancel reply
Your email address will not be published. Required fields are marked *
Save my name, email, and website in this browser for the next time I comment.
- Print Friendly
- Business Essentials
- Leadership & Management
- Credential of Leadership, Impact, and Management in Business (CLIMB)
- Entrepreneurship & Innovation
- Digital Transformation
- Finance & Accounting
- Business in Society
- For Organizations
- Support Portal
- Media Coverage
- Founding Donors
- Leadership Team

- Harvard Business School →
- HBS Online →
- Business Insights →
Business Insights
Harvard Business School Online's Business Insights Blog provides the career insights you need to achieve your goals and gain confidence in your business skills.
- Career Development
- Communication
- Decision-Making
- Earning Your MBA
- Negotiation
- News & Events
- Productivity
- Staff Spotlight
- Student Profiles
- Work-Life Balance
- AI Essentials for Business
- Alternative Investments
- Business Analytics
- Business Strategy
- Business and Climate Change
- Design Thinking and Innovation
- Digital Marketing Strategy
- Disruptive Strategy
- Economics for Managers
- Entrepreneurship Essentials
- Financial Accounting
- Global Business
- Launching Tech Ventures
- Leadership Principles
- Leadership, Ethics, and Corporate Accountability
- Leading with Finance
- Management Essentials
- Negotiation Mastery
- Organizational Leadership
- Power and Influence for Positive Impact
- Strategy Execution
- Sustainable Business Strategy
- Sustainable Investing
- Winning with Digital Platforms
A Beginner’s Guide to Hypothesis Testing in Business

- 30 Mar 2021
Becoming a more data-driven decision-maker can bring several benefits to your organization, enabling you to identify new opportunities to pursue and threats to abate. Rather than allowing subjective thinking to guide your business strategy, backing your decisions with data can empower your company to become more innovative and, ultimately, profitable.
If you’re new to data-driven decision-making, you might be wondering how data translates into business strategy. The answer lies in generating a hypothesis and verifying or rejecting it based on what various forms of data tell you.
Below is a look at hypothesis testing and the role it plays in helping businesses become more data-driven.
Access your free e-book today.
What Is Hypothesis Testing?
To understand what hypothesis testing is, it’s important first to understand what a hypothesis is.
A hypothesis or hypothesis statement seeks to explain why something has happened, or what might happen, under certain conditions. It can also be used to understand how different variables relate to each other. Hypotheses are often written as if-then statements; for example, “If this happens, then this will happen.”
Hypothesis testing , then, is a statistical means of testing an assumption stated in a hypothesis. While the specific methodology leveraged depends on the nature of the hypothesis and data available, hypothesis testing typically uses sample data to extrapolate insights about a larger population.
Hypothesis Testing in Business
When it comes to data-driven decision-making, there’s a certain amount of risk that can mislead a professional. This could be due to flawed thinking or observations, incomplete or inaccurate data , or the presence of unknown variables. The danger in this is that, if major strategic decisions are made based on flawed insights, it can lead to wasted resources, missed opportunities, and catastrophic outcomes.
The real value of hypothesis testing in business is that it allows professionals to test their theories and assumptions before putting them into action. This essentially allows an organization to verify its analysis is correct before committing resources to implement a broader strategy.
As one example, consider a company that wishes to launch a new marketing campaign to revitalize sales during a slow period. Doing so could be an incredibly expensive endeavor, depending on the campaign’s size and complexity. The company, therefore, may wish to test the campaign on a smaller scale to understand how it will perform.
In this example, the hypothesis that’s being tested would fall along the lines of: “If the company launches a new marketing campaign, then it will translate into an increase in sales.” It may even be possible to quantify how much of a lift in sales the company expects to see from the effort. Pending the results of the pilot campaign, the business would then know whether it makes sense to roll it out more broadly.
Related: 9 Fundamental Data Science Skills for Business Professionals
Key Considerations for Hypothesis Testing
1. alternative hypothesis and null hypothesis.
In hypothesis testing, the hypothesis that’s being tested is known as the alternative hypothesis . Often, it’s expressed as a correlation or statistical relationship between variables. The null hypothesis , on the other hand, is a statement that’s meant to show there’s no statistical relationship between the variables being tested. It’s typically the exact opposite of whatever is stated in the alternative hypothesis.
For example, consider a company’s leadership team that historically and reliably sees $12 million in monthly revenue. They want to understand if reducing the price of their services will attract more customers and, in turn, increase revenue.
In this case, the alternative hypothesis may take the form of a statement such as: “If we reduce the price of our flagship service by five percent, then we’ll see an increase in sales and realize revenues greater than $12 million in the next month.”
The null hypothesis, on the other hand, would indicate that revenues wouldn’t increase from the base of $12 million, or might even decrease.
Check out the video below about the difference between an alternative and a null hypothesis, and subscribe to our YouTube channel for more explainer content.
2. Significance Level and P-Value
Statistically speaking, if you were to run the same scenario 100 times, you’d likely receive somewhat different results each time. If you were to plot these results in a distribution plot, you’d see the most likely outcome is at the tallest point in the graph, with less likely outcomes falling to the right and left of that point.

With this in mind, imagine you’ve completed your hypothesis test and have your results, which indicate there may be a correlation between the variables you were testing. To understand your results' significance, you’ll need to identify a p-value for the test, which helps note how confident you are in the test results.
In statistics, the p-value depicts the probability that, assuming the null hypothesis is correct, you might still observe results that are at least as extreme as the results of your hypothesis test. The smaller the p-value, the more likely the alternative hypothesis is correct, and the greater the significance of your results.
3. One-Sided vs. Two-Sided Testing
When it’s time to test your hypothesis, it’s important to leverage the correct testing method. The two most common hypothesis testing methods are one-sided and two-sided tests , or one-tailed and two-tailed tests, respectively.
Typically, you’d leverage a one-sided test when you have a strong conviction about the direction of change you expect to see due to your hypothesis test. You’d leverage a two-sided test when you’re less confident in the direction of change.

4. Sampling
To perform hypothesis testing in the first place, you need to collect a sample of data to be analyzed. Depending on the question you’re seeking to answer or investigate, you might collect samples through surveys, observational studies, or experiments.
A survey involves asking a series of questions to a random population sample and recording self-reported responses.
Observational studies involve a researcher observing a sample population and collecting data as it occurs naturally, without intervention.
Finally, an experiment involves dividing a sample into multiple groups, one of which acts as the control group. For each non-control group, the variable being studied is manipulated to determine how the data collected differs from that of the control group.

Learn How to Perform Hypothesis Testing
Hypothesis testing is a complex process involving different moving pieces that can allow an organization to effectively leverage its data and inform strategic decisions.
If you’re interested in better understanding hypothesis testing and the role it can play within your organization, one option is to complete a course that focuses on the process. Doing so can lay the statistical and analytical foundation you need to succeed.
Do you want to learn more about hypothesis testing? Explore Business Analytics —one of our online business essentials courses —and download our Beginner’s Guide to Data & Analytics .

About the Author
- Python for Machine Learning
- Machine Learning with R
- Machine Learning Algorithms
- Math for Machine Learning
- Machine Learning Interview Questions
- ML Projects
- Deep Learning
- Computer vision
- Data Science
- Artificial Intelligence
- Data Analysis with Python
Introduction to Data Analysis
- What is Data Analysis?
- Data Analytics and its type
- How to Install Numpy on Windows?
- How to Install Pandas in Python?
- How to Install Matplotlib on python?
- How to Install Python Tensorflow in Windows?
Data Analysis Libraries
- Pandas Tutorial
- NumPy Tutorial - Python Library
- Data Analysis with SciPy
- Introduction to TensorFlow
Data Visulization Libraries
- Matplotlib Tutorial
- Python Seaborn Tutorial
- Plotly tutorial
- Introduction to Bokeh in Python
Exploratory Data Analysis (EDA)
- Univariate, Bivariate and Multivariate data and its analysis
- Measures of Central Tendency in Statistics
- Measures of spread - Range, Variance, and Standard Deviation
- Interquartile Range and Quartile Deviation using NumPy and SciPy
- Anova Formula
- Skewness of Statistical Data
- How to Calculate Skewness and Kurtosis in Python?
- Difference Between Skewness and Kurtosis
- Histogram | Meaning, Example, Types and Steps to Draw
- Interpretations of Histogram
- Quantile Quantile plots
- What is Univariate, Bivariate & Multivariate Analysis in Data Visualisation?
- Using pandas crosstab to create a bar plot
- Exploring Correlation in Python
- Mathematics | Covariance and Correlation
- Factor Analysis | Data Analysis
- Data Mining - Cluster Analysis
- MANOVA Test in R Programming
- Python - Central Limit Theorem
- Probability Distribution Function
- Probability Density Estimation & Maximum Likelihood Estimation
- Exponential Distribution in R Programming - dexp(), pexp(), qexp(), and rexp() Functions
- Mathematics | Probability Distributions Set 4 (Binomial Distribution)
- Poisson Distribution - Definition, Formula, Table and Examples
- P-Value: Comprehensive Guide to Understand, Apply, and Interpret
- Z-Score in Statistics
- How to Calculate Point Estimates in R?
- Confidence Interval
- Chi-square test in Machine Learning
Understanding Hypothesis Testing
Data preprocessing.
- ML | Data Preprocessing in Python
- ML | Overview of Data Cleaning
- ML | Handling Missing Values
- Detect and Remove the Outliers using Python
Data Transformation
- Data Normalization Machine Learning
- Sampling distribution Using Python
Time Series Data Analysis
- Data Mining - Time-Series, Symbolic and Biological Sequences Data
- Basic DateTime Operations in Python
- Time Series Analysis & Visualization in Python
- How to deal with missing values in a Timeseries in Python?
- How to calculate MOVING AVERAGE in a Pandas DataFrame?
- What is a trend in time series?
- How to Perform an Augmented Dickey-Fuller Test in R
- AutoCorrelation
Case Studies and Projects
- Top 8 Free Dataset Sources to Use for Data Science Projects
- Step by Step Predictive Analysis - Machine Learning
- 6 Tips for Creating Effective Data Visualizations
Hypothesis testing involves formulating assumptions about population parameters based on sample statistics and rigorously evaluating these assumptions against empirical evidence. This article sheds light on the significance of hypothesis testing and the critical steps involved in the process.
What is Hypothesis Testing?
Hypothesis testing is a statistical method that is used to make a statistical decision using experimental data. Hypothesis testing is basically an assumption that we make about a population parameter. It evaluates two mutually exclusive statements about a population to determine which statement is best supported by the sample data.
Example: You say an average height in the class is 30 or a boy is taller than a girl. All of these is an assumption that we are assuming, and we need some statistical way to prove these. We need some mathematical conclusion whatever we are assuming is true.
Defining Hypotheses

Key Terms of Hypothesis Testing

- P-value: The P value , or calculated probability, is the probability of finding the observed/extreme results when the null hypothesis(H0) of a study-given problem is true. If your P-value is less than the chosen significance level then you reject the null hypothesis i.e. accept that your sample claims to support the alternative hypothesis.
- Test Statistic: The test statistic is a numerical value calculated from sample data during a hypothesis test, used to determine whether to reject the null hypothesis. It is compared to a critical value or p-value to make decisions about the statistical significance of the observed results.
- Critical value : The critical value in statistics is a threshold or cutoff point used to determine whether to reject the null hypothesis in a hypothesis test.
- Degrees of freedom: Degrees of freedom are associated with the variability or freedom one has in estimating a parameter. The degrees of freedom are related to the sample size and determine the shape.
Why do we use Hypothesis Testing?
Hypothesis testing is an important procedure in statistics. Hypothesis testing evaluates two mutually exclusive population statements to determine which statement is most supported by sample data. When we say that the findings are statistically significant, thanks to hypothesis testing.
One-Tailed and Two-Tailed Test
One tailed test focuses on one direction, either greater than or less than a specified value. We use a one-tailed test when there is a clear directional expectation based on prior knowledge or theory. The critical region is located on only one side of the distribution curve. If the sample falls into this critical region, the null hypothesis is rejected in favor of the alternative hypothesis.
One-Tailed Test
There are two types of one-tailed test:

Two-Tailed Test
A two-tailed test considers both directions, greater than and less than a specified value.We use a two-tailed test when there is no specific directional expectation, and want to detect any significant difference.

What are Type 1 and Type 2 errors in Hypothesis Testing?
In hypothesis testing, Type I and Type II errors are two possible errors that researchers can make when drawing conclusions about a population based on a sample of data. These errors are associated with the decisions made regarding the null hypothesis and the alternative hypothesis.

How does Hypothesis Testing work?
Step 1: define null and alternative hypothesis.

We first identify the problem about which we want to make an assumption keeping in mind that our assumption should be contradictory to one another, assuming Normally distributed data.
Step 2 – Choose significance level

Step 3 – Collect and Analyze data.
Gather relevant data through observation or experimentation. Analyze the data using appropriate statistical methods to obtain a test statistic.
Step 4-Calculate Test Statistic
The data for the tests are evaluated in this step we look for various scores based on the characteristics of data. The choice of the test statistic depends on the type of hypothesis test being conducted.
There are various hypothesis tests, each appropriate for various goal to calculate our test. This could be a Z-test , Chi-square , T-test , and so on.
- Z-test : If population means and standard deviations are known. Z-statistic is commonly used.
- t-test : If population standard deviations are unknown. and sample size is small than t-test statistic is more appropriate.
- Chi-square test : Chi-square test is used for categorical data or for testing independence in contingency tables
- F-test : F-test is often used in analysis of variance (ANOVA) to compare variances or test the equality of means across multiple groups.
We have a smaller dataset, So, T-test is more appropriate to test our hypothesis.
T-statistic is a measure of the difference between the means of two groups relative to the variability within each group. It is calculated as the difference between the sample means divided by the standard error of the difference. It is also known as the t-value or t-score.
Step 5 – Comparing Test Statistic:
In this stage, we decide where we should accept the null hypothesis or reject the null hypothesis. There are two ways to decide where we should accept or reject the null hypothesis.
Method A: Using Crtical values
Comparing the test statistic and tabulated critical value we have,
- If Test Statistic>Critical Value: Reject the null hypothesis.
- If Test Statistic≤Critical Value: Fail to reject the null hypothesis.
Note: Critical values are predetermined threshold values that are used to make a decision in hypothesis testing. To determine critical values for hypothesis testing, we typically refer to a statistical distribution table , such as the normal distribution or t-distribution tables based on.
Method B: Using P-values
We can also come to an conclusion using the p-value,

Note : The p-value is the probability of obtaining a test statistic as extreme as, or more extreme than, the one observed in the sample, assuming the null hypothesis is true. To determine p-value for hypothesis testing, we typically refer to a statistical distribution table , such as the normal distribution or t-distribution tables based on.
Step 7- Interpret the Results
At last, we can conclude our experiment using method A or B.
Calculating test statistic
To validate our hypothesis about a population parameter we use statistical functions . We use the z-score, p-value, and level of significance(alpha) to make evidence for our hypothesis for normally distributed data .
1. Z-statistics:
When population means and standard deviations are known.

- μ represents the population mean,
- σ is the standard deviation
- and n is the size of the sample.
2. T-Statistics
T test is used when n<30,
t-statistic calculation is given by:

- t = t-score,
- x̄ = sample mean
- μ = population mean,
- s = standard deviation of the sample,
- n = sample size
3. Chi-Square Test
Chi-Square Test for Independence categorical Data (Non-normally distributed) using:

- i,j are the rows and columns index respectively.

Real life Hypothesis Testing example
Let’s examine hypothesis testing using two real life situations,
Case A: D oes a New Drug Affect Blood Pressure?
Imagine a pharmaceutical company has developed a new drug that they believe can effectively lower blood pressure in patients with hypertension. Before bringing the drug to market, they need to conduct a study to assess its impact on blood pressure.
- Before Treatment: 120, 122, 118, 130, 125, 128, 115, 121, 123, 119
- After Treatment: 115, 120, 112, 128, 122, 125, 110, 117, 119, 114
Step 1 : Define the Hypothesis
- Null Hypothesis : (H 0 )The new drug has no effect on blood pressure.
- Alternate Hypothesis : (H 1 )The new drug has an effect on blood pressure.
Step 2: Define the Significance level
Let’s consider the Significance level at 0.05, indicating rejection of the null hypothesis.
If the evidence suggests less than a 5% chance of observing the results due to random variation.
Step 3 : Compute the test statistic
Using paired T-test analyze the data to obtain a test statistic and a p-value.
The test statistic (e.g., T-statistic) is calculated based on the differences between blood pressure measurements before and after treatment.
t = m/(s/√n)
- m = mean of the difference i.e X after, X before
- s = standard deviation of the difference (d) i.e d i = X after, i − X before,
- n = sample size,
then, m= -3.9, s= 1.8 and n= 10
we, calculate the , T-statistic = -9 based on the formula for paired t test
Step 4: Find the p-value
The calculated t-statistic is -9 and degrees of freedom df = 9, you can find the p-value using statistical software or a t-distribution table.
thus, p-value = 8.538051223166285e-06
Step 5: Result
- If the p-value is less than or equal to 0.05, the researchers reject the null hypothesis.
- If the p-value is greater than 0.05, they fail to reject the null hypothesis.
Conclusion: Since the p-value (8.538051223166285e-06) is less than the significance level (0.05), the researchers reject the null hypothesis. There is statistically significant evidence that the average blood pressure before and after treatment with the new drug is different.
Python Implementation of Hypothesis Testing
Let’s create hypothesis testing with python, where we are testing whether a new drug affects blood pressure. For this example, we will use a paired T-test. We’ll use the scipy.stats library for the T-test.
Scipy is a mathematical library in Python that is mostly used for mathematical equations and computations.
We will implement our first real life problem via python,
In the above example, given the T-statistic of approximately -9 and an extremely small p-value, the results indicate a strong case to reject the null hypothesis at a significance level of 0.05.
- The results suggest that the new drug, treatment, or intervention has a significant effect on lowering blood pressure.
- The negative T-statistic indicates that the mean blood pressure after treatment is significantly lower than the assumed population mean before treatment.
Case B : Cholesterol level in a population
Data: A sample of 25 individuals is taken, and their cholesterol levels are measured.
Cholesterol Levels (mg/dL): 205, 198, 210, 190, 215, 205, 200, 192, 198, 205, 198, 202, 208, 200, 205, 198, 205, 210, 192, 205, 198, 205, 210, 192, 205.
Populations Mean = 200
Population Standard Deviation (σ): 5 mg/dL(given for this problem)
Step 1: Define the Hypothesis
- Null Hypothesis (H 0 ): The average cholesterol level in a population is 200 mg/dL.
- Alternate Hypothesis (H 1 ): The average cholesterol level in a population is different from 200 mg/dL.
As the direction of deviation is not given , we assume a two-tailed test, and based on a normal distribution table, the critical values for a significance level of 0.05 (two-tailed) can be calculated through the z-table and are approximately -1.96 and 1.96.

Step 4: Result
Since the absolute value of the test statistic (2.04) is greater than the critical value (1.96), we reject the null hypothesis. And conclude that, there is statistically significant evidence that the average cholesterol level in the population is different from 200 mg/dL
Limitations of Hypothesis Testing
- Although a useful technique, hypothesis testing does not offer a comprehensive grasp of the topic being studied. Without fully reflecting the intricacy or whole context of the phenomena, it concentrates on certain hypotheses and statistical significance.
- The accuracy of hypothesis testing results is contingent on the quality of available data and the appropriateness of statistical methods used. Inaccurate data or poorly formulated hypotheses can lead to incorrect conclusions.
- Relying solely on hypothesis testing may cause analysts to overlook significant patterns or relationships in the data that are not captured by the specific hypotheses being tested. This limitation underscores the importance of complimenting hypothesis testing with other analytical approaches.
Hypothesis testing stands as a cornerstone in statistical analysis, enabling data scientists to navigate uncertainties and draw credible inferences from sample data. By systematically defining null and alternative hypotheses, choosing significance levels, and leveraging statistical tests, researchers can assess the validity of their assumptions. The article also elucidates the critical distinction between Type I and Type II errors, providing a comprehensive understanding of the nuanced decision-making process inherent in hypothesis testing. The real-life example of testing a new drug’s effect on blood pressure using a paired T-test showcases the practical application of these principles, underscoring the importance of statistical rigor in data-driven decision-making.
Frequently Asked Questions (FAQs)
1. what are the 3 types of hypothesis test.
There are three types of hypothesis tests: right-tailed, left-tailed, and two-tailed. Right-tailed tests assess if a parameter is greater, left-tailed if lesser. Two-tailed tests check for non-directional differences, greater or lesser.
2.What are the 4 components of hypothesis testing?
Null Hypothesis ( ): No effect or difference exists. Alternative Hypothesis ( ): An effect or difference exists. Significance Level ( ): Risk of rejecting null hypothesis when it’s true (Type I error). Test Statistic: Numerical value representing observed evidence against null hypothesis.
3.What is hypothesis testing in ML?
Statistical method to evaluate the performance and validity of machine learning models. Tests specific hypotheses about model behavior, like whether features influence predictions or if a model generalizes well to unseen data.
4.What is the difference between Pytest and hypothesis in Python?
Pytest purposes general testing framework for Python code while Hypothesis is a Property-based testing framework for Python, focusing on generating test cases based on specified properties of the code.
Please Login to comment...
Similar reads.
- data-science
- Machine Learning
Improve your Coding Skills with Practice
What kind of Experience do you want to share?
IMAGES
VIDEO
COMMENTS
Step 5: Present your findings. The results of hypothesis testing will be presented in the results and discussion sections of your research paper, dissertation or thesis.. In the results section you should give a brief summary of the data and a summary of the results of your statistical test (for example, the estimated difference between group means and associated p-value).
Hypothesis Testing. Investigators conducting studies need research questions and hypotheses to guide analyses. Starting with broad research questions (RQs), investigators then identify a gap in current clinical practice or research. Any research problem or statement is grounded in a better understanding of relationships between two or more ...
Hypothesis testing is as old as the scientific method and is at the heart of the research process. Research exists to validate or disprove assumptions about various phenomena. The process of validation involves testing and it is in this context that we will explore hypothesis testing.
hypothesis testing. S.3 Hypothesis Testing. In reviewing hypothesis tests, we start first with the general idea. Then, we keep returning to the basic procedures of hypothesis testing, each time adding a little more detail. The general idea of hypothesis testing involves: Making an initial assumption. Collecting evidence (data).
HYPOTHESIS TESTING. A clinical trial begins with an assumption or belief, and then proceeds to either prove or disprove this assumption. In statistical terms, this belief or assumption is known as a hypothesis. Counterintuitively, what the researcher believes in (or is trying to prove) is called the "alternate" hypothesis, and the opposite ...
Hypothesis testing is a scientific method used for making a decision and drawing conclusions by using a statistical approach. It is used to suggest new ideas by testing theories to know whether or not the sample data supports research. A research hypothesis is a predictive statement that has to be tested using scientific methods that join an ...
Hypothesis-testing (Quantitative hypothesis-testing research) - Quantitative research uses deductive reasoning. - This involves the formation of a hypothesis, collection of data in the investigation of the problem, analysis and use of the data from the investigation, and drawing of conclusions to validate or nullify the hypotheses.
Hypothesis Testing The research hypothesis. The first step in hypothesis testing is to set a research hypothesis. In Sarah and Mike's study, the aim is to examine the effect that two different teaching methods - providing both lectures and seminar classes (Sarah), and providing lectures by themselves (Mike) - had on the performance of Sarah ...
Hypothesis testing. Hypothesis testing is a form of statistical inference that uses data from a sample to draw conclusions about a population parameter or a population probability distribution.First, a tentative assumption is made about the parameter or distribution. This assumption is called the null hypothesis and is denoted by H 0.An alternative hypothesis (denoted H a), which is the ...
Step 1: State the Null Hypothesis. The null hypothesis can be thought of as the opposite of the "guess" the researchers made: in this example, the biologist thinks the plant height will be different for the fertilizers. So the null would be that there will be no difference among the groups of plants. Specifically, in more statistical language ...
A hypothesis is a tentative statement about the relationship between two or more variables. It is a specific, testable prediction about what you expect to happen in a study. It is a preliminary answer to your question that helps guide the research process. Consider a study designed to examine the relationship between sleep deprivation and test ...
Hypothesis testing is a statistical method used to determine if there is enough evidence in a sample data to draw conclusions about a population. It involves formulating two competing hypotheses, the null hypothesis (H0) and the alternative hypothesis (Ha), and then collecting data to assess the evidence.
A research hypothesis is an assumption or a tentative explanation for a specific process observed during research. Unlike a guess, research hypothesis is a calculated, educated guess proven or disproven through research methods. ... He published a paper in 1925 that introduced the concept of null hypothesis testing, and he was also the first to ...
A hypothesis test is a procedure used in statistics to assess whether a particular viewpoint is likely to be true. They follow a strict protocol, and they generate a 'p-value', on the basis of which a decision is made about the truth of the hypothesis under investigation.All of the routine statistical 'tests' used in research—t-tests, χ 2 tests, Mann-Whitney tests, etc.—are all ...
Hypothesis Testing. Hypothesis testing is the act of testing a hypothesis or a supposition in relation to a statistical parameter. Analysts implement hypothesis testing in order to test if a hypothesis is plausible or not. In data science and statistics, hypothesis testing is an important step as it involves the verification of an assumption ...
Hypothesis testing is an act in statistics whereby an analyst tests an assumption regarding a population parameter. The methodology employed by the analyst depends on the nature of the data used ...
The investigator formulates a specific hypothesis, evaluates data from the sample, and uses these data to decide whether they support the specific hypothesis. The first step in testing hypotheses is the transformation of the research question into a null hypothesis, H 0, and an alternative hypothesis, H A. 6 The null and alternative hypotheses ...
Hypothesis testing is a systematic procedure for deciding whether the results of a research study support a particular theory which applies to a population. ... To carry out statistical hypothesis testing, research and null hypothesis are employed: Research hypothesis: this is the hypothesis that you propose, also known as the alternative ...
A research hypothesis (also called a scientific hypothesis) is a statement about the expected outcome of a study (for example, a dissertation or thesis). To constitute a quality hypothesis, the statement needs to have three attributes - specificity, clarity and testability. Let's take a look at these more closely.
3. One-Sided vs. Two-Sided Testing. When it's time to test your hypothesis, it's important to leverage the correct testing method. The two most common hypothesis testing methods are one-sided and two-sided tests, or one-tailed and two-tailed tests, respectively. Typically, you'd leverage a one-sided test when you have a strong conviction ...
Hypothesis testing is a statistical method that is used to make a statistical decision using experimental data. Hypothesis testing is basically an assumption that we make about a population parameter. It evaluates two mutually exclusive statements about a population to determine which statement is best supported by the sample data.
Formulating Hypotheses for Different Study Designs. Generating a testable working hypothesis is the first step towards conducting original research. Such research may prove or disprove the proposed hypothesis. Case reports, case series, online surveys and other observational studies, clinical trials, and narrative reviews help to generate ...
Hypothesis testing is a statistical method used to decide whether there is enough evidence in a sample of data to infer that a certain condition is true for the entire population.
To test this hypothesis, people with Type 2 diabetes and body mass index <27kg/m 2 ... R.R.H reports research support from AstraZeneca, Bayer, and MSD; and personal fees from Anji Pharmaceuticals, Bayer, Novartis, and Novo Nordisk. All other authors declare no competing interests. R.T. is the guarantor of this work and takes full responsibility ...