- Privacy Policy
Buy Me a Coffee
Home » Research Methodology – Types, Examples and writing Guide

Research Methodology – Types, Examples and writing Guide
Table of Contents

Research Methodology
Definition:
Research Methodology refers to the systematic and scientific approach used to conduct research, investigate problems, and gather data and information for a specific purpose. It involves the techniques and procedures used to identify, collect , analyze , and interpret data to answer research questions or solve research problems . Moreover, They are philosophical and theoretical frameworks that guide the research process.
Structure of Research Methodology
Research methodology formats can vary depending on the specific requirements of the research project, but the following is a basic example of a structure for a research methodology section:
I. Introduction
- Provide an overview of the research problem and the need for a research methodology section
- Outline the main research questions and objectives
II. Research Design
- Explain the research design chosen and why it is appropriate for the research question(s) and objectives
- Discuss any alternative research designs considered and why they were not chosen
- Describe the research setting and participants (if applicable)
III. Data Collection Methods
- Describe the methods used to collect data (e.g., surveys, interviews, observations)
- Explain how the data collection methods were chosen and why they are appropriate for the research question(s) and objectives
- Detail any procedures or instruments used for data collection
IV. Data Analysis Methods
- Describe the methods used to analyze the data (e.g., statistical analysis, content analysis )
- Explain how the data analysis methods were chosen and why they are appropriate for the research question(s) and objectives
- Detail any procedures or software used for data analysis
V. Ethical Considerations
- Discuss any ethical issues that may arise from the research and how they were addressed
- Explain how informed consent was obtained (if applicable)
- Detail any measures taken to ensure confidentiality and anonymity
VI. Limitations
- Identify any potential limitations of the research methodology and how they may impact the results and conclusions
VII. Conclusion
- Summarize the key aspects of the research methodology section
- Explain how the research methodology addresses the research question(s) and objectives
Research Methodology Types
Types of Research Methodology are as follows:
Quantitative Research Methodology
This is a research methodology that involves the collection and analysis of numerical data using statistical methods. This type of research is often used to study cause-and-effect relationships and to make predictions.
Qualitative Research Methodology
This is a research methodology that involves the collection and analysis of non-numerical data such as words, images, and observations. This type of research is often used to explore complex phenomena, to gain an in-depth understanding of a particular topic, and to generate hypotheses.
Mixed-Methods Research Methodology
This is a research methodology that combines elements of both quantitative and qualitative research. This approach can be particularly useful for studies that aim to explore complex phenomena and to provide a more comprehensive understanding of a particular topic.
Case Study Research Methodology
This is a research methodology that involves in-depth examination of a single case or a small number of cases. Case studies are often used in psychology, sociology, and anthropology to gain a detailed understanding of a particular individual or group.
Action Research Methodology
This is a research methodology that involves a collaborative process between researchers and practitioners to identify and solve real-world problems. Action research is often used in education, healthcare, and social work.
Experimental Research Methodology
This is a research methodology that involves the manipulation of one or more independent variables to observe their effects on a dependent variable. Experimental research is often used to study cause-and-effect relationships and to make predictions.
Survey Research Methodology
This is a research methodology that involves the collection of data from a sample of individuals using questionnaires or interviews. Survey research is often used to study attitudes, opinions, and behaviors.
Grounded Theory Research Methodology
This is a research methodology that involves the development of theories based on the data collected during the research process. Grounded theory is often used in sociology and anthropology to generate theories about social phenomena.
Research Methodology Example
An Example of Research Methodology could be the following:
Research Methodology for Investigating the Effectiveness of Cognitive Behavioral Therapy in Reducing Symptoms of Depression in Adults
Introduction:
The aim of this research is to investigate the effectiveness of cognitive-behavioral therapy (CBT) in reducing symptoms of depression in adults. To achieve this objective, a randomized controlled trial (RCT) will be conducted using a mixed-methods approach.
Research Design:
The study will follow a pre-test and post-test design with two groups: an experimental group receiving CBT and a control group receiving no intervention. The study will also include a qualitative component, in which semi-structured interviews will be conducted with a subset of participants to explore their experiences of receiving CBT.
Participants:
Participants will be recruited from community mental health clinics in the local area. The sample will consist of 100 adults aged 18-65 years old who meet the diagnostic criteria for major depressive disorder. Participants will be randomly assigned to either the experimental group or the control group.
Intervention :
The experimental group will receive 12 weekly sessions of CBT, each lasting 60 minutes. The intervention will be delivered by licensed mental health professionals who have been trained in CBT. The control group will receive no intervention during the study period.
Data Collection:
Quantitative data will be collected through the use of standardized measures such as the Beck Depression Inventory-II (BDI-II) and the Generalized Anxiety Disorder-7 (GAD-7). Data will be collected at baseline, immediately after the intervention, and at a 3-month follow-up. Qualitative data will be collected through semi-structured interviews with a subset of participants from the experimental group. The interviews will be conducted at the end of the intervention period, and will explore participants’ experiences of receiving CBT.
Data Analysis:
Quantitative data will be analyzed using descriptive statistics, t-tests, and mixed-model analyses of variance (ANOVA) to assess the effectiveness of the intervention. Qualitative data will be analyzed using thematic analysis to identify common themes and patterns in participants’ experiences of receiving CBT.
Ethical Considerations:
This study will comply with ethical guidelines for research involving human subjects. Participants will provide informed consent before participating in the study, and their privacy and confidentiality will be protected throughout the study. Any adverse events or reactions will be reported and managed appropriately.
Data Management:
All data collected will be kept confidential and stored securely using password-protected databases. Identifying information will be removed from qualitative data transcripts to ensure participants’ anonymity.
Limitations:
One potential limitation of this study is that it only focuses on one type of psychotherapy, CBT, and may not generalize to other types of therapy or interventions. Another limitation is that the study will only include participants from community mental health clinics, which may not be representative of the general population.
Conclusion:
This research aims to investigate the effectiveness of CBT in reducing symptoms of depression in adults. By using a randomized controlled trial and a mixed-methods approach, the study will provide valuable insights into the mechanisms underlying the relationship between CBT and depression. The results of this study will have important implications for the development of effective treatments for depression in clinical settings.
How to Write Research Methodology
Writing a research methodology involves explaining the methods and techniques you used to conduct research, collect data, and analyze results. It’s an essential section of any research paper or thesis, as it helps readers understand the validity and reliability of your findings. Here are the steps to write a research methodology:
- Start by explaining your research question: Begin the methodology section by restating your research question and explaining why it’s important. This helps readers understand the purpose of your research and the rationale behind your methods.
- Describe your research design: Explain the overall approach you used to conduct research. This could be a qualitative or quantitative research design, experimental or non-experimental, case study or survey, etc. Discuss the advantages and limitations of the chosen design.
- Discuss your sample: Describe the participants or subjects you included in your study. Include details such as their demographics, sampling method, sample size, and any exclusion criteria used.
- Describe your data collection methods : Explain how you collected data from your participants. This could include surveys, interviews, observations, questionnaires, or experiments. Include details on how you obtained informed consent, how you administered the tools, and how you minimized the risk of bias.
- Explain your data analysis techniques: Describe the methods you used to analyze the data you collected. This could include statistical analysis, content analysis, thematic analysis, or discourse analysis. Explain how you dealt with missing data, outliers, and any other issues that arose during the analysis.
- Discuss the validity and reliability of your research : Explain how you ensured the validity and reliability of your study. This could include measures such as triangulation, member checking, peer review, or inter-coder reliability.
- Acknowledge any limitations of your research: Discuss any limitations of your study, including any potential threats to validity or generalizability. This helps readers understand the scope of your findings and how they might apply to other contexts.
- Provide a summary: End the methodology section by summarizing the methods and techniques you used to conduct your research. This provides a clear overview of your research methodology and helps readers understand the process you followed to arrive at your findings.
When to Write Research Methodology
Research methodology is typically written after the research proposal has been approved and before the actual research is conducted. It should be written prior to data collection and analysis, as it provides a clear roadmap for the research project.
The research methodology is an important section of any research paper or thesis, as it describes the methods and procedures that will be used to conduct the research. It should include details about the research design, data collection methods, data analysis techniques, and any ethical considerations.
The methodology should be written in a clear and concise manner, and it should be based on established research practices and standards. It is important to provide enough detail so that the reader can understand how the research was conducted and evaluate the validity of the results.
Applications of Research Methodology
Here are some of the applications of research methodology:
- To identify the research problem: Research methodology is used to identify the research problem, which is the first step in conducting any research.
- To design the research: Research methodology helps in designing the research by selecting the appropriate research method, research design, and sampling technique.
- To collect data: Research methodology provides a systematic approach to collect data from primary and secondary sources.
- To analyze data: Research methodology helps in analyzing the collected data using various statistical and non-statistical techniques.
- To test hypotheses: Research methodology provides a framework for testing hypotheses and drawing conclusions based on the analysis of data.
- To generalize findings: Research methodology helps in generalizing the findings of the research to the target population.
- To develop theories : Research methodology is used to develop new theories and modify existing theories based on the findings of the research.
- To evaluate programs and policies : Research methodology is used to evaluate the effectiveness of programs and policies by collecting data and analyzing it.
- To improve decision-making: Research methodology helps in making informed decisions by providing reliable and valid data.
Purpose of Research Methodology
Research methodology serves several important purposes, including:
- To guide the research process: Research methodology provides a systematic framework for conducting research. It helps researchers to plan their research, define their research questions, and select appropriate methods and techniques for collecting and analyzing data.
- To ensure research quality: Research methodology helps researchers to ensure that their research is rigorous, reliable, and valid. It provides guidelines for minimizing bias and error in data collection and analysis, and for ensuring that research findings are accurate and trustworthy.
- To replicate research: Research methodology provides a clear and detailed account of the research process, making it possible for other researchers to replicate the study and verify its findings.
- To advance knowledge: Research methodology enables researchers to generate new knowledge and to contribute to the body of knowledge in their field. It provides a means for testing hypotheses, exploring new ideas, and discovering new insights.
- To inform decision-making: Research methodology provides evidence-based information that can inform policy and decision-making in a variety of fields, including medicine, public health, education, and business.
Advantages of Research Methodology
Research methodology has several advantages that make it a valuable tool for conducting research in various fields. Here are some of the key advantages of research methodology:
- Systematic and structured approach : Research methodology provides a systematic and structured approach to conducting research, which ensures that the research is conducted in a rigorous and comprehensive manner.
- Objectivity : Research methodology aims to ensure objectivity in the research process, which means that the research findings are based on evidence and not influenced by personal bias or subjective opinions.
- Replicability : Research methodology ensures that research can be replicated by other researchers, which is essential for validating research findings and ensuring their accuracy.
- Reliability : Research methodology aims to ensure that the research findings are reliable, which means that they are consistent and can be depended upon.
- Validity : Research methodology ensures that the research findings are valid, which means that they accurately reflect the research question or hypothesis being tested.
- Efficiency : Research methodology provides a structured and efficient way of conducting research, which helps to save time and resources.
- Flexibility : Research methodology allows researchers to choose the most appropriate research methods and techniques based on the research question, data availability, and other relevant factors.
- Scope for innovation: Research methodology provides scope for innovation and creativity in designing research studies and developing new research techniques.
Research Methodology Vs Research Methods
About the author.

Muhammad Hassan
Researcher, Academic Writer, Web developer
You may also like

How to Cite Research Paper – All Formats and...

Data Collection – Methods Types and Examples

Delimitations in Research – Types, Examples and...

Research Paper Format – Types, Examples and...

Research Process – Steps, Examples and Tips

Research Design – Types, Methods and Examples
Editorial Manager, our manuscript submissions site will be unavailable between 12pm April 5, 2024 and 12pm April 8 2024 (Pacific Standard Time). We apologize for any inconvenience this may cause.
When you choose to publish with PLOS, your research makes an impact. Make your work accessible to all, without restrictions, and accelerate scientific discovery with options like preprints and published peer review that make your work more Open.
- PLOS Biology
- PLOS Climate
- PLOS Complex Systems
- PLOS Computational Biology
- PLOS Digital Health
- PLOS Genetics
- PLOS Global Public Health
- PLOS Medicine
- PLOS Mental Health
- PLOS Neglected Tropical Diseases
- PLOS Pathogens
- PLOS Sustainability and Transformation
- PLOS Collections
- How to Write Your Methods

Ensure understanding, reproducibility and replicability
What should you include in your methods section, and how much detail is appropriate?
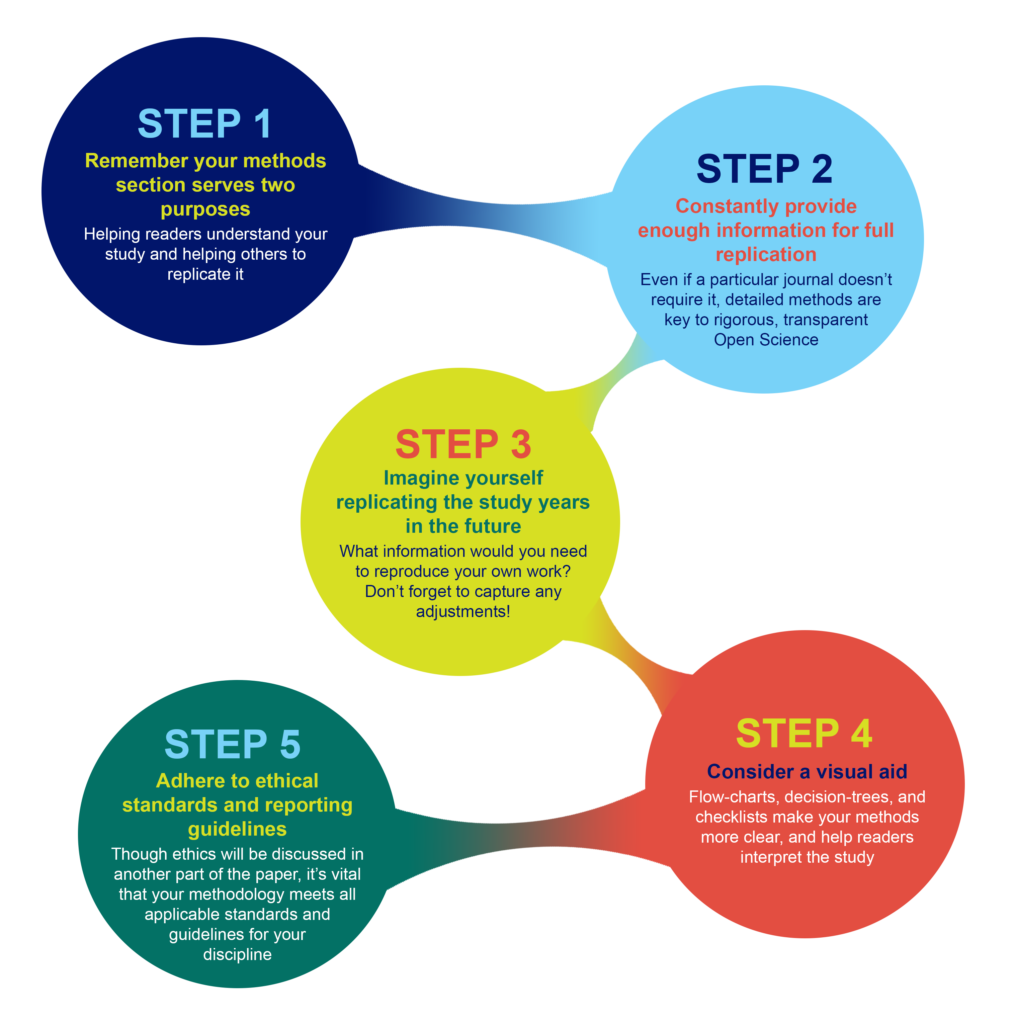
Why Methods Matter
The methods section was once the most likely part of a paper to be unfairly abbreviated, overly summarized, or even relegated to hard-to-find sections of a publisher’s website. While some journals may responsibly include more detailed elements of methods in supplementary sections, the movement for increased reproducibility and rigor in science has reinstated the importance of the methods section. Methods are now viewed as a key element in establishing the credibility of the research being reported, alongside the open availability of data and results.
A clear methods section impacts editorial evaluation and readers’ understanding, and is also the backbone of transparency and replicability.
For example, the Reproducibility Project: Cancer Biology project set out in 2013 to replicate experiments from 50 high profile cancer papers, but revised their target to 18 papers once they understood how much methodological detail was not contained in the original papers.
What to include in your methods section
What you include in your methods sections depends on what field you are in and what experiments you are performing. However, the general principle in place at the majority of journals is summarized well by the guidelines at PLOS ONE : “The Materials and Methods section should provide enough detail to allow suitably skilled investigators to fully replicate your study. ” The emphases here are deliberate: the methods should enable readers to understand your paper, and replicate your study. However, there is no need to go into the level of detail that a lay-person would require—the focus is on the reader who is also trained in your field, with the suitable skills and knowledge to attempt a replication.
A constant principle of rigorous science
A methods section that enables other researchers to understand and replicate your results is a constant principle of rigorous, transparent, and Open Science. Aim to be thorough, even if a particular journal doesn’t require the same level of detail . Reproducibility is all of our responsibility. You cannot create any problems by exceeding a minimum standard of information. If a journal still has word-limits—either for the overall article or specific sections—and requires some methodological details to be in a supplemental section, that is OK as long as the extra details are searchable and findable .
Imagine replicating your own work, years in the future
As part of PLOS’ presentation on Reproducibility and Open Publishing (part of UCSF’s Reproducibility Series ) we recommend planning the level of detail in your methods section by imagining you are writing for your future self, replicating your own work. When you consider that you might be at a different institution, with different account logins, applications, resources, and access levels—you can help yourself imagine the level of specificity that you yourself would require to redo the exact experiment. Consider:
- Which details would you need to be reminded of?
- Which cell line, or antibody, or software, or reagent did you use, and does it have a Research Resource ID (RRID) that you can cite?
- Which version of a questionnaire did you use in your survey?
- Exactly which visual stimulus did you show participants, and is it publicly available?
- What participants did you decide to exclude?
- What process did you adjust, during your work?
Tip: Be sure to capture any changes to your protocols
You yourself would want to know about any adjustments, if you ever replicate the work, so you can surmise that anyone else would want to as well. Even if a necessary adjustment you made was not ideal, transparency is the key to ensuring this is not regarded as an issue in the future. It is far better to transparently convey any non-optimal methods, or methodological constraints, than to conceal them, which could result in reproducibility or ethical issues downstream.
Visual aids for methods help when reading the whole paper
Consider whether a visual representation of your methods could be appropriate or aid understanding your process. A visual reference readers can easily return to, like a flow-diagram, decision-tree, or checklist, can help readers to better understand the complete article, not just the methods section.
Ethical Considerations
In addition to describing what you did, it is just as important to assure readers that you also followed all relevant ethical guidelines when conducting your research. While ethical standards and reporting guidelines are often presented in a separate section of a paper, ensure that your methods and protocols actually follow these guidelines. Read more about ethics .
Existing standards, checklists, guidelines, partners
While the level of detail contained in a methods section should be guided by the universal principles of rigorous science outlined above, various disciplines, fields, and projects have worked hard to design and develop consistent standards, guidelines, and tools to help with reporting all types of experiment. Below, you’ll find some of the key initiatives. Ensure you read the submission guidelines for the specific journal you are submitting to, in order to discover any further journal- or field-specific policies to follow, or initiatives/tools to utilize.
Tip: Keep your paper moving forward by providing the proper paperwork up front
Be sure to check the journal guidelines and provide the necessary documents with your manuscript submission. Collecting the necessary documentation can greatly slow the first round of peer review, or cause delays when you submit your revision.
Randomized Controlled Trials – CONSORT The Consolidated Standards of Reporting Trials (CONSORT) project covers various initiatives intended to prevent the problems of inadequate reporting of randomized controlled trials. The primary initiative is an evidence-based minimum set of recommendations for reporting randomized trials known as the CONSORT Statement .
Systematic Reviews and Meta-Analyses – PRISMA The Preferred Reporting Items for Systematic Reviews and Meta-Analyses ( PRISMA ) is an evidence-based minimum set of items focusing on the reporting of reviews evaluating randomized trials and other types of research.
Research using Animals – ARRIVE The Animal Research: Reporting of In Vivo Experiments ( ARRIVE ) guidelines encourage maximizing the information reported in research using animals thereby minimizing unnecessary studies. (Original study and proposal , and updated guidelines , in PLOS Biology .)
Laboratory Protocols Protocols.io has developed a platform specifically for the sharing and updating of laboratory protocols , which are assigned their own DOI and can be linked from methods sections of papers to enhance reproducibility. Contextualize your protocol and improve discovery with an accompanying Lab Protocol article in PLOS ONE .
Consistent reporting of Materials, Design, and Analysis – the MDAR checklist A cross-publisher group of editors and experts have developed, tested, and rolled out a checklist to help establish and harmonize reporting standards in the Life Sciences . The checklist , which is available for use by authors to compile their methods, and editors/reviewers to check methods, establishes a minimum set of requirements in transparent reporting and is adaptable to any discipline within the Life Sciences, by covering a breadth of potentially relevant methodological items and considerations. If you are in the Life Sciences and writing up your methods section, try working through the MDAR checklist and see whether it helps you include all relevant details into your methods, and whether it reminded you of anything you might have missed otherwise.
Summary Writing tips
The main challenge you may find when writing your methods is keeping it readable AND covering all the details needed for reproducibility and replicability. While this is difficult, do not compromise on rigorous standards for credibility!

- Keep in mind future replicability, alongside understanding and readability.
- Follow checklists, and field- and journal-specific guidelines.
- Consider a commitment to rigorous and transparent science a personal responsibility, and not just adhering to journal guidelines.
- Establish whether there are persistent identifiers for any research resources you use that can be specifically cited in your methods section.
- Deposit your laboratory protocols in Protocols.io, establishing a permanent link to them. You can update your protocols later if you improve on them, as can future scientists who follow your protocols.
- Consider visual aids like flow-diagrams, lists, to help with reading other sections of the paper.
- Be specific about all decisions made during the experiments that someone reproducing your work would need to know.

Don’t
- Summarize or abbreviate methods without giving full details in a discoverable supplemental section.
- Presume you will always be able to remember how you performed the experiments, or have access to private or institutional notebooks and resources.
- Attempt to hide constraints or non-optimal decisions you had to make–transparency is the key to ensuring the credibility of your research.
- How to Write a Great Title
- How to Write an Abstract
- How to Report Statistics
- How to Write Discussions and Conclusions
- How to Edit Your Work
The contents of the Peer Review Center are also available as a live, interactive training session, complete with slides, talking points, and activities. …
The contents of the Writing Center are also available as a live, interactive training session, complete with slides, talking points, and activities. …
There’s a lot to consider when deciding where to submit your work. Learn how to choose a journal that will help your study reach its audience, while reflecting your values as a researcher…
- Resources Home 🏠
- Try SciSpace Copilot
- Search research papers
- Add Copilot Extension
- Try AI Detector
- Try Paraphraser
- Try Citation Generator
- April Papers
- June Papers
- July Papers

Here's What You Need to Understand About Research Methodology

Table of Contents
Research methodology involves a systematic and well-structured approach to conducting scholarly or scientific inquiries. Knowing the significance of research methodology and its different components is crucial as it serves as the basis for any study.
Typically, your research topic will start as a broad idea you want to investigate more thoroughly. Once you’ve identified a research problem and created research questions , you must choose the appropriate methodology and frameworks to address those questions effectively.
What is the definition of a research methodology?
Research methodology is the process or the way you intend to execute your study. The methodology section of a research paper outlines how you plan to conduct your study. It covers various steps such as collecting data, statistical analysis, observing participants, and other procedures involved in the research process
The methods section should give a description of the process that will convert your idea into a study. Additionally, the outcomes of your process must provide valid and reliable results resonant with the aims and objectives of your research. This thumb rule holds complete validity, no matter whether your paper has inclinations for qualitative or quantitative usage.
Studying research methods used in related studies can provide helpful insights and direction for your own research. Now easily discover papers related to your topic on SciSpace and utilize our AI research assistant, Copilot , to quickly review the methodologies applied in different papers.

The need for a good research methodology
While deciding on your approach towards your research, the reason or factors you weighed in choosing a particular problem and formulating a research topic need to be validated and explained. A research methodology helps you do exactly that. Moreover, a good research methodology lets you build your argument to validate your research work performed through various data collection methods, analytical methods, and other essential points.
Just imagine it as a strategy documented to provide an overview of what you intend to do.
While undertaking any research writing or performing the research itself, you may get drifted in not something of much importance. In such a case, a research methodology helps you to get back to your outlined work methodology.
A research methodology helps in keeping you accountable for your work. Additionally, it can help you evaluate whether your work is in sync with your original aims and objectives or not. Besides, a good research methodology enables you to navigate your research process smoothly and swiftly while providing effective planning to achieve your desired results.
What is the basic structure of a research methodology?
Usually, you must ensure to include the following stated aspects while deciding over the basic structure of your research methodology:
1. Your research procedure
Explain what research methods you’re going to use. Whether you intend to proceed with quantitative or qualitative, or a composite of both approaches, you need to state that explicitly. The option among the three depends on your research’s aim, objectives, and scope.
2. Provide the rationality behind your chosen approach
Based on logic and reason, let your readers know why you have chosen said research methodologies. Additionally, you have to build strong arguments supporting why your chosen research method is the best way to achieve the desired outcome.
3. Explain your mechanism
The mechanism encompasses the research methods or instruments you will use to develop your research methodology. It usually refers to your data collection methods. You can use interviews, surveys, physical questionnaires, etc., of the many available mechanisms as research methodology instruments. The data collection method is determined by the type of research and whether the data is quantitative data(includes numerical data) or qualitative data (perception, morale, etc.) Moreover, you need to put logical reasoning behind choosing a particular instrument.
4. Significance of outcomes
The results will be available once you have finished experimenting. However, you should also explain how you plan to use the data to interpret the findings. This section also aids in understanding the problem from within, breaking it down into pieces, and viewing the research problem from various perspectives.
5. Reader’s advice
Anything that you feel must be explained to spread more awareness among readers and focus groups must be included and described in detail. You should not just specify your research methodology on the assumption that a reader is aware of the topic.
All the relevant information that explains and simplifies your research paper must be included in the methodology section. If you are conducting your research in a non-traditional manner, give a logical justification and list its benefits.
6. Explain your sample space
Include information about the sample and sample space in the methodology section. The term "sample" refers to a smaller set of data that a researcher selects or chooses from a larger group of people or focus groups using a predetermined selection method. Let your readers know how you are going to distinguish between relevant and non-relevant samples. How you figured out those exact numbers to back your research methodology, i.e. the sample spacing of instruments, must be discussed thoroughly.
For example, if you are going to conduct a survey or interview, then by what procedure will you select the interviewees (or sample size in case of surveys), and how exactly will the interview or survey be conducted.
7. Challenges and limitations
This part, which is frequently assumed to be unnecessary, is actually very important. The challenges and limitations that your chosen strategy inherently possesses must be specified while you are conducting different types of research.
The importance of a good research methodology
You must have observed that all research papers, dissertations, or theses carry a chapter entirely dedicated to research methodology. This section helps maintain your credibility as a better interpreter of results rather than a manipulator.
A good research methodology always explains the procedure, data collection methods and techniques, aim, and scope of the research. In a research study, it leads to a well-organized, rationality-based approach, while the paper lacking it is often observed as messy or disorganized.
You should pay special attention to validating your chosen way towards the research methodology. This becomes extremely important in case you select an unconventional or a distinct method of execution.
Curating and developing a strong, effective research methodology can assist you in addressing a variety of situations, such as:
- When someone tries to duplicate or expand upon your research after few years.
- If a contradiction or conflict of facts occurs at a later time. This gives you the security you need to deal with these contradictions while still being able to defend your approach.
- Gaining a tactical approach in getting your research completed in time. Just ensure you are using the right approach while drafting your research methodology, and it can help you achieve your desired outcomes. Additionally, it provides a better explanation and understanding of the research question itself.
- Documenting the results so that the final outcome of the research stays as you intended it to be while starting.
Instruments you could use while writing a good research methodology
As a researcher, you must choose which tools or data collection methods that fit best in terms of the relevance of your research. This decision has to be wise.
There exists many research equipments or tools that you can use to carry out your research process. These are classified as:
a. Interviews (One-on-One or a Group)
An interview aimed to get your desired research outcomes can be undertaken in many different ways. For example, you can design your interview as structured, semi-structured, or unstructured. What sets them apart is the degree of formality in the questions. On the other hand, in a group interview, your aim should be to collect more opinions and group perceptions from the focus groups on a certain topic rather than looking out for some formal answers.
In surveys, you are in better control if you specifically draft the questions you seek the response for. For example, you may choose to include free-style questions that can be answered descriptively, or you may provide a multiple-choice type response for questions. Besides, you can also opt to choose both ways, deciding what suits your research process and purpose better.
c. Sample Groups
Similar to the group interviews, here, you can select a group of individuals and assign them a topic to discuss or freely express their opinions over that. You can simultaneously note down the answers and later draft them appropriately, deciding on the relevance of every response.
d. Observations
If your research domain is humanities or sociology, observations are the best-proven method to draw your research methodology. Of course, you can always include studying the spontaneous response of the participants towards a situation or conducting the same but in a more structured manner. A structured observation means putting the participants in a situation at a previously decided time and then studying their responses.
Of all the tools described above, it is you who should wisely choose the instruments and decide what’s the best fit for your research. You must not restrict yourself from multiple methods or a combination of a few instruments if appropriate in drafting a good research methodology.
Types of research methodology
A research methodology exists in various forms. Depending upon their approach, whether centered around words, numbers, or both, methodologies are distinguished as qualitative, quantitative, or an amalgamation of both.
1. Qualitative research methodology
When a research methodology primarily focuses on words and textual data, then it is generally referred to as qualitative research methodology. This type is usually preferred among researchers when the aim and scope of the research are mainly theoretical and explanatory.
The instruments used are observations, interviews, and sample groups. You can use this methodology if you are trying to study human behavior or response in some situations. Generally, qualitative research methodology is widely used in sociology, psychology, and other related domains.
2. Quantitative research methodology
If your research is majorly centered on data, figures, and stats, then analyzing these numerical data is often referred to as quantitative research methodology. You can use quantitative research methodology if your research requires you to validate or justify the obtained results.
In quantitative methods, surveys, tests, experiments, and evaluations of current databases can be advantageously used as instruments If your research involves testing some hypothesis, then use this methodology.
3. Amalgam methodology
As the name suggests, the amalgam methodology uses both quantitative and qualitative approaches. This methodology is used when a part of the research requires you to verify the facts and figures, whereas the other part demands you to discover the theoretical and explanatory nature of the research question.
The instruments for the amalgam methodology require you to conduct interviews and surveys, including tests and experiments. The outcome of this methodology can be insightful and valuable as it provides precise test results in line with theoretical explanations and reasoning.
The amalgam method, makes your work both factual and rational at the same time.
Final words: How to decide which is the best research methodology?
If you have kept your sincerity and awareness intact with the aims and scope of research well enough, you must have got an idea of which research methodology suits your work best.
Before deciding which research methodology answers your research question, you must invest significant time in reading and doing your homework for that. Taking references that yield relevant results should be your first approach to establishing a research methodology.
Moreover, you should never refrain from exploring other options. Before setting your work in stone, you must try all the available options as it explains why the choice of research methodology that you finally make is more appropriate than the other available options.
You should always go for a quantitative research methodology if your research requires gathering large amounts of data, figures, and statistics. This research methodology will provide you with results if your research paper involves the validation of some hypothesis.
Whereas, if you are looking for more explanations, reasons, opinions, and public perceptions around a theory, you must use qualitative research methodology.The choice of an appropriate research methodology ultimately depends on what you want to achieve through your research.
Frequently Asked Questions (FAQs) about Research Methodology
1. how to write a research methodology.
You can always provide a separate section for research methodology where you should specify details about the methods and instruments used during the research, discussions on result analysis, including insights into the background information, and conveying the research limitations.
2. What are the types of research methodology?
There generally exists four types of research methodology i.e.
- Observation
- Experimental
- Derivational
3. What is the true meaning of research methodology?
The set of techniques or procedures followed to discover and analyze the information gathered to validate or justify a research outcome is generally called Research Methodology.
4. Where lies the importance of research methodology?
Your research methodology directly reflects the validity of your research outcomes and how well-informed your research work is. Moreover, it can help future researchers cite or refer to your research if they plan to use a similar research methodology.
You might also like

Consensus GPT vs. SciSpace GPT: Choose the Best GPT for Research

Literature Review and Theoretical Framework: Understanding the Differences

Using AI for research: A beginner’s guide

News alert: UC Berkeley has announced its next university librarian
Secondary menu
- Log in to your Library account
- Hours and Maps
- Connect from Off Campus
- UC Berkeley Home
Search form
Research methods--quantitative, qualitative, and more: overview.
- Quantitative Research
- Qualitative Research
- Data Science Methods (Machine Learning, AI, Big Data)
- Text Mining and Computational Text Analysis
- Evidence Synthesis/Systematic Reviews
- Get Data, Get Help!
About Research Methods
This guide provides an overview of research methods, how to choose and use them, and supports and resources at UC Berkeley.
As Patten and Newhart note in the book Understanding Research Methods , "Research methods are the building blocks of the scientific enterprise. They are the "how" for building systematic knowledge. The accumulation of knowledge through research is by its nature a collective endeavor. Each well-designed study provides evidence that may support, amend, refute, or deepen the understanding of existing knowledge...Decisions are important throughout the practice of research and are designed to help researchers collect evidence that includes the full spectrum of the phenomenon under study, to maintain logical rules, and to mitigate or account for possible sources of bias. In many ways, learning research methods is learning how to see and make these decisions."
The choice of methods varies by discipline, by the kind of phenomenon being studied and the data being used to study it, by the technology available, and more. This guide is an introduction, but if you don't see what you need here, always contact your subject librarian, and/or take a look to see if there's a library research guide that will answer your question.
Suggestions for changes and additions to this guide are welcome!
START HERE: SAGE Research Methods
Without question, the most comprehensive resource available from the library is SAGE Research Methods. HERE IS THE ONLINE GUIDE to this one-stop shopping collection, and some helpful links are below:
- SAGE Research Methods
- Little Green Books (Quantitative Methods)
- Little Blue Books (Qualitative Methods)
- Dictionaries and Encyclopedias
- Case studies of real research projects
- Sample datasets for hands-on practice
- Streaming video--see methods come to life
- Methodspace- -a community for researchers
- SAGE Research Methods Course Mapping
Library Data Services at UC Berkeley
Library Data Services Program and Digital Scholarship Services
The LDSP offers a variety of services and tools ! From this link, check out pages for each of the following topics: discovering data, managing data, collecting data, GIS data, text data mining, publishing data, digital scholarship, open science, and the Research Data Management Program.
Be sure also to check out the visual guide to where to seek assistance on campus with any research question you may have!
Library GIS Services
Other Data Services at Berkeley
D-Lab Supports Berkeley faculty, staff, and graduate students with research in data intensive social science, including a wide range of training and workshop offerings Dryad Dryad is a simple self-service tool for researchers to use in publishing their datasets. It provides tools for the effective publication of and access to research data. Geospatial Innovation Facility (GIF) Provides leadership and training across a broad array of integrated mapping technologies on campu Research Data Management A UC Berkeley guide and consulting service for research data management issues
General Research Methods Resources
Here are some general resources for assistance:
- Assistance from ICPSR (must create an account to access): Getting Help with Data , and Resources for Students
- Wiley Stats Ref for background information on statistics topics
- Survey Documentation and Analysis (SDA) . Program for easy web-based analysis of survey data.
Consultants
- D-Lab/Data Science Discovery Consultants Request help with your research project from peer consultants.
- Research data (RDM) consulting Meet with RDM consultants before designing the data security, storage, and sharing aspects of your qualitative project.
- Statistics Department Consulting Services A service in which advanced graduate students, under faculty supervision, are available to consult during specified hours in the Fall and Spring semesters.
Related Resourcex
- IRB / CPHS Qualitative research projects with human subjects often require that you go through an ethics review.
- OURS (Office of Undergraduate Research and Scholarships) OURS supports undergraduates who want to embark on research projects and assistantships. In particular, check out their "Getting Started in Research" workshops
- Sponsored Projects Sponsored projects works with researchers applying for major external grants.
- Next: Quantitative Research >>
- Last Updated: Apr 3, 2023 3:14 PM
- URL: https://guides.lib.berkeley.edu/researchmethods
- PRO Courses Guides New Tech Help Pro Expert Videos About wikiHow Pro Upgrade Sign In
- EDIT Edit this Article
- EXPLORE Tech Help Pro About Us Random Article Quizzes Request a New Article Community Dashboard This Or That Game Popular Categories Arts and Entertainment Artwork Books Movies Computers and Electronics Computers Phone Skills Technology Hacks Health Men's Health Mental Health Women's Health Relationships Dating Love Relationship Issues Hobbies and Crafts Crafts Drawing Games Education & Communication Communication Skills Personal Development Studying Personal Care and Style Fashion Hair Care Personal Hygiene Youth Personal Care School Stuff Dating All Categories Arts and Entertainment Finance and Business Home and Garden Relationship Quizzes Cars & Other Vehicles Food and Entertaining Personal Care and Style Sports and Fitness Computers and Electronics Health Pets and Animals Travel Education & Communication Hobbies and Crafts Philosophy and Religion Work World Family Life Holidays and Traditions Relationships Youth
- Browse Articles
- Learn Something New
- Quizzes Hot
- This Or That Game New
- Train Your Brain
- Explore More
- Support wikiHow
- About wikiHow
- Log in / Sign up
- Education and Communications
- College University and Postgraduate
- Academic Writing
How to Write Research Methodology
Last Updated: May 21, 2023 Approved
This article was co-authored by Alexander Ruiz, M.Ed. and by wikiHow staff writer, Jennifer Mueller, JD . Alexander Ruiz is an Educational Consultant and the Educational Director of Link Educational Institute, a tutoring business based in Claremont, California that provides customizable educational plans, subject and test prep tutoring, and college application consulting. With over a decade and a half of experience in the education industry, Alexander coaches students to increase their self-awareness and emotional intelligence while achieving skills and the goal of achieving skills and higher education. He holds a BA in Psychology from Florida International University and an MA in Education from Georgia Southern University. wikiHow marks an article as reader-approved once it receives enough positive feedback. In this case, several readers have written to tell us that this article was helpful to them, earning it our reader-approved status. This article has been viewed 516,582 times.
The research methodology section of any academic research paper gives you the opportunity to convince your readers that your research is useful and will contribute to your field of study. An effective research methodology is grounded in your overall approach – whether qualitative or quantitative – and adequately describes the methods you used. Justify why you chose those methods over others, then explain how those methods will provide answers to your research questions. [1] X Research source
Describing Your Methods

- In your restatement, include any underlying assumptions that you're making or conditions that you're taking for granted. These assumptions will also inform the research methods you've chosen.
- Generally, state the variables you'll test and the other conditions you're controlling or assuming are equal.

- If you want to research and document measurable social trends, or evaluate the impact of a particular policy on various variables, use a quantitative approach focused on data collection and statistical analysis.
- If you want to evaluate people's views or understanding of a particular issue, choose a more qualitative approach.
- You can also combine the two. For example, you might look primarily at a measurable social trend, but also interview people and get their opinions on how that trend is affecting their lives.

- For example, if you conducted a survey, you would describe the questions included in the survey, where and how the survey was conducted (such as in person, online, over the phone), how many surveys were distributed, and how long your respondents had to complete the survey.
- Include enough detail that your study can be replicated by others in your field, even if they may not get the same results you did. [4] X Research source

- Qualitative research methods typically require more detailed explanation than quantitative methods.
- Basic investigative procedures don't need to be explained in detail. Generally, you can assume that your readers have a general understanding of common research methods that social scientists use, such as surveys or focus groups.

- For example, suppose you conducted a survey and used a couple of other research papers to help construct the questions on your survey. You would mention those as contributing sources.
Justifying Your Choice of Methods

- Describe study participants specifically, and list any inclusion or exclusion criteria you used when forming your group of participants.
- Justify the size of your sample, if applicable, and describe how this affects whether your study can be generalized to larger populations. For example, if you conducted a survey of 30 percent of the student population of a university, you could potentially apply those results to the student body as a whole, but maybe not to students at other universities.

- Reading other research papers is a good way to identify potential problems that commonly arise with various methods. State whether you actually encountered any of these common problems during your research.

- If you encountered any problems as you collected data, explain clearly the steps you took to minimize the effect that problem would have on your results.

- In some cases, this may be as simple as stating that while there were numerous studies using one method, there weren't any using your method, which caused a gap in understanding of the issue.
- For example, there may be multiple papers providing quantitative analysis of a particular social trend. However, none of these papers looked closely at how this trend was affecting the lives of people.
Connecting Your Methods to Your Research Goals

- Depending on your research questions, you may be mixing quantitative and qualitative analysis – just as you could potentially use both approaches. For example, you might do a statistical analysis, and then interpret those statistics through a particular theoretical lens.

- For example, suppose you're researching the effect of college education on family farms in rural America. While you could do interviews of college-educated people who grew up on a family farm, that would not give you a picture of the overall effect. A quantitative approach and statistical analysis would give you a bigger picture.

- If in answering your research questions, your findings have raised other questions that may require further research, state these briefly.
- You can also include here any limitations to your methods, or questions that weren't answered through your research.

- Generalization is more typically used in quantitative research. If you have a well-designed sample, you can statistically apply your results to the larger population your sample belongs to.
Template to Write Research Methodology

Community Q&A
- Organize your methodology section chronologically, starting with how you prepared to conduct your research methods, how you gathered data, and how you analyzed that data. [13] X Research source Thanks Helpful 0 Not Helpful 0
- Write your research methodology section in past tense, unless you're submitting the methodology section before the research described has been carried out. [14] X Research source Thanks Helpful 2 Not Helpful 0
- Discuss your plans in detail with your advisor or supervisor before committing to a particular methodology. They can help identify possible flaws in your study. [15] X Research source Thanks Helpful 0 Not Helpful 0

You Might Also Like

- ↑ http://expertjournals.com/how-to-write-a-research-methodology-for-your-academic-article/
- ↑ http://libguides.usc.edu/writingguide/methodology
- ↑ https://www.skillsyouneed.com/learn/dissertation-methodology.html
- ↑ https://uir.unisa.ac.za/bitstream/handle/10500/4245/05Chap%204_Research%20methodology%20and%20design.pdf
- ↑ https://elc.polyu.edu.hk/FYP/html/method.htm
About This Article

To write a research methodology, start with a section that outlines the problems or questions you'll be studying, including your hypotheses or whatever it is you're setting out to prove. Then, briefly explain why you chose to use either a qualitative or quantitative approach for your study. Next, go over when and where you conducted your research and what parameters you used to ensure you were objective. Finally, cite any sources you used to decide on the methodology for your research. To learn how to justify your choice of methods in your research methodology, scroll down! Did this summary help you? Yes No
- Send fan mail to authors
Reader Success Stories
Prof. Dr. Ahmed Askar
Apr 18, 2020
Did this article help you?
M. Mahmood Shah Khan
Mar 17, 2020
Shimola Makondo
Jul 20, 2019
Zain Sharif Mohammed Alnadhery
Jan 7, 2019
Lundi Dukashe
Feb 17, 2020

Featured Articles

Trending Articles

Watch Articles

- Terms of Use
- Privacy Policy
- Do Not Sell or Share My Info
- Not Selling Info
wikiHow Tech Help Pro:
Develop the tech skills you need for work and life

An official website of the United States government
The .gov means it’s official. Federal government websites often end in .gov or .mil. Before sharing sensitive information, make sure you’re on a federal government site.
The site is secure. The https:// ensures that you are connecting to the official website and that any information you provide is encrypted and transmitted securely.
- Publications
- Account settings
Preview improvements coming to the PMC website in October 2024. Learn More or Try it out now .
- Advanced Search
- Journal List
- J Korean Med Sci
- v.37(16); 2022 Apr 25
A Practical Guide to Writing Quantitative and Qualitative Research Questions and Hypotheses in Scholarly Articles
Edward barroga.
1 Department of General Education, Graduate School of Nursing Science, St. Luke’s International University, Tokyo, Japan.
Glafera Janet Matanguihan
2 Department of Biological Sciences, Messiah University, Mechanicsburg, PA, USA.
The development of research questions and the subsequent hypotheses are prerequisites to defining the main research purpose and specific objectives of a study. Consequently, these objectives determine the study design and research outcome. The development of research questions is a process based on knowledge of current trends, cutting-edge studies, and technological advances in the research field. Excellent research questions are focused and require a comprehensive literature search and in-depth understanding of the problem being investigated. Initially, research questions may be written as descriptive questions which could be developed into inferential questions. These questions must be specific and concise to provide a clear foundation for developing hypotheses. Hypotheses are more formal predictions about the research outcomes. These specify the possible results that may or may not be expected regarding the relationship between groups. Thus, research questions and hypotheses clarify the main purpose and specific objectives of the study, which in turn dictate the design of the study, its direction, and outcome. Studies developed from good research questions and hypotheses will have trustworthy outcomes with wide-ranging social and health implications.
INTRODUCTION
Scientific research is usually initiated by posing evidenced-based research questions which are then explicitly restated as hypotheses. 1 , 2 The hypotheses provide directions to guide the study, solutions, explanations, and expected results. 3 , 4 Both research questions and hypotheses are essentially formulated based on conventional theories and real-world processes, which allow the inception of novel studies and the ethical testing of ideas. 5 , 6
It is crucial to have knowledge of both quantitative and qualitative research 2 as both types of research involve writing research questions and hypotheses. 7 However, these crucial elements of research are sometimes overlooked; if not overlooked, then framed without the forethought and meticulous attention it needs. Planning and careful consideration are needed when developing quantitative or qualitative research, particularly when conceptualizing research questions and hypotheses. 4
There is a continuing need to support researchers in the creation of innovative research questions and hypotheses, as well as for journal articles that carefully review these elements. 1 When research questions and hypotheses are not carefully thought of, unethical studies and poor outcomes usually ensue. Carefully formulated research questions and hypotheses define well-founded objectives, which in turn determine the appropriate design, course, and outcome of the study. This article then aims to discuss in detail the various aspects of crafting research questions and hypotheses, with the goal of guiding researchers as they develop their own. Examples from the authors and peer-reviewed scientific articles in the healthcare field are provided to illustrate key points.
DEFINITIONS AND RELATIONSHIP OF RESEARCH QUESTIONS AND HYPOTHESES
A research question is what a study aims to answer after data analysis and interpretation. The answer is written in length in the discussion section of the paper. Thus, the research question gives a preview of the different parts and variables of the study meant to address the problem posed in the research question. 1 An excellent research question clarifies the research writing while facilitating understanding of the research topic, objective, scope, and limitations of the study. 5
On the other hand, a research hypothesis is an educated statement of an expected outcome. This statement is based on background research and current knowledge. 8 , 9 The research hypothesis makes a specific prediction about a new phenomenon 10 or a formal statement on the expected relationship between an independent variable and a dependent variable. 3 , 11 It provides a tentative answer to the research question to be tested or explored. 4
Hypotheses employ reasoning to predict a theory-based outcome. 10 These can also be developed from theories by focusing on components of theories that have not yet been observed. 10 The validity of hypotheses is often based on the testability of the prediction made in a reproducible experiment. 8
Conversely, hypotheses can also be rephrased as research questions. Several hypotheses based on existing theories and knowledge may be needed to answer a research question. Developing ethical research questions and hypotheses creates a research design that has logical relationships among variables. These relationships serve as a solid foundation for the conduct of the study. 4 , 11 Haphazardly constructed research questions can result in poorly formulated hypotheses and improper study designs, leading to unreliable results. Thus, the formulations of relevant research questions and verifiable hypotheses are crucial when beginning research. 12
CHARACTERISTICS OF GOOD RESEARCH QUESTIONS AND HYPOTHESES
Excellent research questions are specific and focused. These integrate collective data and observations to confirm or refute the subsequent hypotheses. Well-constructed hypotheses are based on previous reports and verify the research context. These are realistic, in-depth, sufficiently complex, and reproducible. More importantly, these hypotheses can be addressed and tested. 13
There are several characteristics of well-developed hypotheses. Good hypotheses are 1) empirically testable 7 , 10 , 11 , 13 ; 2) backed by preliminary evidence 9 ; 3) testable by ethical research 7 , 9 ; 4) based on original ideas 9 ; 5) have evidenced-based logical reasoning 10 ; and 6) can be predicted. 11 Good hypotheses can infer ethical and positive implications, indicating the presence of a relationship or effect relevant to the research theme. 7 , 11 These are initially developed from a general theory and branch into specific hypotheses by deductive reasoning. In the absence of a theory to base the hypotheses, inductive reasoning based on specific observations or findings form more general hypotheses. 10
TYPES OF RESEARCH QUESTIONS AND HYPOTHESES
Research questions and hypotheses are developed according to the type of research, which can be broadly classified into quantitative and qualitative research. We provide a summary of the types of research questions and hypotheses under quantitative and qualitative research categories in Table 1 .
Research questions in quantitative research
In quantitative research, research questions inquire about the relationships among variables being investigated and are usually framed at the start of the study. These are precise and typically linked to the subject population, dependent and independent variables, and research design. 1 Research questions may also attempt to describe the behavior of a population in relation to one or more variables, or describe the characteristics of variables to be measured ( descriptive research questions ). 1 , 5 , 14 These questions may also aim to discover differences between groups within the context of an outcome variable ( comparative research questions ), 1 , 5 , 14 or elucidate trends and interactions among variables ( relationship research questions ). 1 , 5 We provide examples of descriptive, comparative, and relationship research questions in quantitative research in Table 2 .
Hypotheses in quantitative research
In quantitative research, hypotheses predict the expected relationships among variables. 15 Relationships among variables that can be predicted include 1) between a single dependent variable and a single independent variable ( simple hypothesis ) or 2) between two or more independent and dependent variables ( complex hypothesis ). 4 , 11 Hypotheses may also specify the expected direction to be followed and imply an intellectual commitment to a particular outcome ( directional hypothesis ) 4 . On the other hand, hypotheses may not predict the exact direction and are used in the absence of a theory, or when findings contradict previous studies ( non-directional hypothesis ). 4 In addition, hypotheses can 1) define interdependency between variables ( associative hypothesis ), 4 2) propose an effect on the dependent variable from manipulation of the independent variable ( causal hypothesis ), 4 3) state a negative relationship between two variables ( null hypothesis ), 4 , 11 , 15 4) replace the working hypothesis if rejected ( alternative hypothesis ), 15 explain the relationship of phenomena to possibly generate a theory ( working hypothesis ), 11 5) involve quantifiable variables that can be tested statistically ( statistical hypothesis ), 11 6) or express a relationship whose interlinks can be verified logically ( logical hypothesis ). 11 We provide examples of simple, complex, directional, non-directional, associative, causal, null, alternative, working, statistical, and logical hypotheses in quantitative research, as well as the definition of quantitative hypothesis-testing research in Table 3 .
Research questions in qualitative research
Unlike research questions in quantitative research, research questions in qualitative research are usually continuously reviewed and reformulated. The central question and associated subquestions are stated more than the hypotheses. 15 The central question broadly explores a complex set of factors surrounding the central phenomenon, aiming to present the varied perspectives of participants. 15
There are varied goals for which qualitative research questions are developed. These questions can function in several ways, such as to 1) identify and describe existing conditions ( contextual research question s); 2) describe a phenomenon ( descriptive research questions ); 3) assess the effectiveness of existing methods, protocols, theories, or procedures ( evaluation research questions ); 4) examine a phenomenon or analyze the reasons or relationships between subjects or phenomena ( explanatory research questions ); or 5) focus on unknown aspects of a particular topic ( exploratory research questions ). 5 In addition, some qualitative research questions provide new ideas for the development of theories and actions ( generative research questions ) or advance specific ideologies of a position ( ideological research questions ). 1 Other qualitative research questions may build on a body of existing literature and become working guidelines ( ethnographic research questions ). Research questions may also be broadly stated without specific reference to the existing literature or a typology of questions ( phenomenological research questions ), may be directed towards generating a theory of some process ( grounded theory questions ), or may address a description of the case and the emerging themes ( qualitative case study questions ). 15 We provide examples of contextual, descriptive, evaluation, explanatory, exploratory, generative, ideological, ethnographic, phenomenological, grounded theory, and qualitative case study research questions in qualitative research in Table 4 , and the definition of qualitative hypothesis-generating research in Table 5 .
Qualitative studies usually pose at least one central research question and several subquestions starting with How or What . These research questions use exploratory verbs such as explore or describe . These also focus on one central phenomenon of interest, and may mention the participants and research site. 15
Hypotheses in qualitative research
Hypotheses in qualitative research are stated in the form of a clear statement concerning the problem to be investigated. Unlike in quantitative research where hypotheses are usually developed to be tested, qualitative research can lead to both hypothesis-testing and hypothesis-generating outcomes. 2 When studies require both quantitative and qualitative research questions, this suggests an integrative process between both research methods wherein a single mixed-methods research question can be developed. 1
FRAMEWORKS FOR DEVELOPING RESEARCH QUESTIONS AND HYPOTHESES
Research questions followed by hypotheses should be developed before the start of the study. 1 , 12 , 14 It is crucial to develop feasible research questions on a topic that is interesting to both the researcher and the scientific community. This can be achieved by a meticulous review of previous and current studies to establish a novel topic. Specific areas are subsequently focused on to generate ethical research questions. The relevance of the research questions is evaluated in terms of clarity of the resulting data, specificity of the methodology, objectivity of the outcome, depth of the research, and impact of the study. 1 , 5 These aspects constitute the FINER criteria (i.e., Feasible, Interesting, Novel, Ethical, and Relevant). 1 Clarity and effectiveness are achieved if research questions meet the FINER criteria. In addition to the FINER criteria, Ratan et al. described focus, complexity, novelty, feasibility, and measurability for evaluating the effectiveness of research questions. 14
The PICOT and PEO frameworks are also used when developing research questions. 1 The following elements are addressed in these frameworks, PICOT: P-population/patients/problem, I-intervention or indicator being studied, C-comparison group, O-outcome of interest, and T-timeframe of the study; PEO: P-population being studied, E-exposure to preexisting conditions, and O-outcome of interest. 1 Research questions are also considered good if these meet the “FINERMAPS” framework: Feasible, Interesting, Novel, Ethical, Relevant, Manageable, Appropriate, Potential value/publishable, and Systematic. 14
As we indicated earlier, research questions and hypotheses that are not carefully formulated result in unethical studies or poor outcomes. To illustrate this, we provide some examples of ambiguous research question and hypotheses that result in unclear and weak research objectives in quantitative research ( Table 6 ) 16 and qualitative research ( Table 7 ) 17 , and how to transform these ambiguous research question(s) and hypothesis(es) into clear and good statements.
a These statements were composed for comparison and illustrative purposes only.
b These statements are direct quotes from Higashihara and Horiuchi. 16
a This statement is a direct quote from Shimoda et al. 17
The other statements were composed for comparison and illustrative purposes only.
CONSTRUCTING RESEARCH QUESTIONS AND HYPOTHESES
To construct effective research questions and hypotheses, it is very important to 1) clarify the background and 2) identify the research problem at the outset of the research, within a specific timeframe. 9 Then, 3) review or conduct preliminary research to collect all available knowledge about the possible research questions by studying theories and previous studies. 18 Afterwards, 4) construct research questions to investigate the research problem. Identify variables to be accessed from the research questions 4 and make operational definitions of constructs from the research problem and questions. Thereafter, 5) construct specific deductive or inductive predictions in the form of hypotheses. 4 Finally, 6) state the study aims . This general flow for constructing effective research questions and hypotheses prior to conducting research is shown in Fig. 1 .

Research questions are used more frequently in qualitative research than objectives or hypotheses. 3 These questions seek to discover, understand, explore or describe experiences by asking “What” or “How.” The questions are open-ended to elicit a description rather than to relate variables or compare groups. The questions are continually reviewed, reformulated, and changed during the qualitative study. 3 Research questions are also used more frequently in survey projects than hypotheses in experiments in quantitative research to compare variables and their relationships.
Hypotheses are constructed based on the variables identified and as an if-then statement, following the template, ‘If a specific action is taken, then a certain outcome is expected.’ At this stage, some ideas regarding expectations from the research to be conducted must be drawn. 18 Then, the variables to be manipulated (independent) and influenced (dependent) are defined. 4 Thereafter, the hypothesis is stated and refined, and reproducible data tailored to the hypothesis are identified, collected, and analyzed. 4 The hypotheses must be testable and specific, 18 and should describe the variables and their relationships, the specific group being studied, and the predicted research outcome. 18 Hypotheses construction involves a testable proposition to be deduced from theory, and independent and dependent variables to be separated and measured separately. 3 Therefore, good hypotheses must be based on good research questions constructed at the start of a study or trial. 12
In summary, research questions are constructed after establishing the background of the study. Hypotheses are then developed based on the research questions. Thus, it is crucial to have excellent research questions to generate superior hypotheses. In turn, these would determine the research objectives and the design of the study, and ultimately, the outcome of the research. 12 Algorithms for building research questions and hypotheses are shown in Fig. 2 for quantitative research and in Fig. 3 for qualitative research.

EXAMPLES OF RESEARCH QUESTIONS FROM PUBLISHED ARTICLES
- EXAMPLE 1. Descriptive research question (quantitative research)
- - Presents research variables to be assessed (distinct phenotypes and subphenotypes)
- “BACKGROUND: Since COVID-19 was identified, its clinical and biological heterogeneity has been recognized. Identifying COVID-19 phenotypes might help guide basic, clinical, and translational research efforts.
- RESEARCH QUESTION: Does the clinical spectrum of patients with COVID-19 contain distinct phenotypes and subphenotypes? ” 19
- EXAMPLE 2. Relationship research question (quantitative research)
- - Shows interactions between dependent variable (static postural control) and independent variable (peripheral visual field loss)
- “Background: Integration of visual, vestibular, and proprioceptive sensations contributes to postural control. People with peripheral visual field loss have serious postural instability. However, the directional specificity of postural stability and sensory reweighting caused by gradual peripheral visual field loss remain unclear.
- Research question: What are the effects of peripheral visual field loss on static postural control ?” 20
- EXAMPLE 3. Comparative research question (quantitative research)
- - Clarifies the difference among groups with an outcome variable (patients enrolled in COMPERA with moderate PH or severe PH in COPD) and another group without the outcome variable (patients with idiopathic pulmonary arterial hypertension (IPAH))
- “BACKGROUND: Pulmonary hypertension (PH) in COPD is a poorly investigated clinical condition.
- RESEARCH QUESTION: Which factors determine the outcome of PH in COPD?
- STUDY DESIGN AND METHODS: We analyzed the characteristics and outcome of patients enrolled in the Comparative, Prospective Registry of Newly Initiated Therapies for Pulmonary Hypertension (COMPERA) with moderate or severe PH in COPD as defined during the 6th PH World Symposium who received medical therapy for PH and compared them with patients with idiopathic pulmonary arterial hypertension (IPAH) .” 21
- EXAMPLE 4. Exploratory research question (qualitative research)
- - Explores areas that have not been fully investigated (perspectives of families and children who receive care in clinic-based child obesity treatment) to have a deeper understanding of the research problem
- “Problem: Interventions for children with obesity lead to only modest improvements in BMI and long-term outcomes, and data are limited on the perspectives of families of children with obesity in clinic-based treatment. This scoping review seeks to answer the question: What is known about the perspectives of families and children who receive care in clinic-based child obesity treatment? This review aims to explore the scope of perspectives reported by families of children with obesity who have received individualized outpatient clinic-based obesity treatment.” 22
- EXAMPLE 5. Relationship research question (quantitative research)
- - Defines interactions between dependent variable (use of ankle strategies) and independent variable (changes in muscle tone)
- “Background: To maintain an upright standing posture against external disturbances, the human body mainly employs two types of postural control strategies: “ankle strategy” and “hip strategy.” While it has been reported that the magnitude of the disturbance alters the use of postural control strategies, it has not been elucidated how the level of muscle tone, one of the crucial parameters of bodily function, determines the use of each strategy. We have previously confirmed using forward dynamics simulations of human musculoskeletal models that an increased muscle tone promotes the use of ankle strategies. The objective of the present study was to experimentally evaluate a hypothesis: an increased muscle tone promotes the use of ankle strategies. Research question: Do changes in the muscle tone affect the use of ankle strategies ?” 23
EXAMPLES OF HYPOTHESES IN PUBLISHED ARTICLES
- EXAMPLE 1. Working hypothesis (quantitative research)
- - A hypothesis that is initially accepted for further research to produce a feasible theory
- “As fever may have benefit in shortening the duration of viral illness, it is plausible to hypothesize that the antipyretic efficacy of ibuprofen may be hindering the benefits of a fever response when taken during the early stages of COVID-19 illness .” 24
- “In conclusion, it is plausible to hypothesize that the antipyretic efficacy of ibuprofen may be hindering the benefits of a fever response . The difference in perceived safety of these agents in COVID-19 illness could be related to the more potent efficacy to reduce fever with ibuprofen compared to acetaminophen. Compelling data on the benefit of fever warrant further research and review to determine when to treat or withhold ibuprofen for early stage fever for COVID-19 and other related viral illnesses .” 24
- EXAMPLE 2. Exploratory hypothesis (qualitative research)
- - Explores particular areas deeper to clarify subjective experience and develop a formal hypothesis potentially testable in a future quantitative approach
- “We hypothesized that when thinking about a past experience of help-seeking, a self distancing prompt would cause increased help-seeking intentions and more favorable help-seeking outcome expectations .” 25
- “Conclusion
- Although a priori hypotheses were not supported, further research is warranted as results indicate the potential for using self-distancing approaches to increasing help-seeking among some people with depressive symptomatology.” 25
- EXAMPLE 3. Hypothesis-generating research to establish a framework for hypothesis testing (qualitative research)
- “We hypothesize that compassionate care is beneficial for patients (better outcomes), healthcare systems and payers (lower costs), and healthcare providers (lower burnout). ” 26
- Compassionomics is the branch of knowledge and scientific study of the effects of compassionate healthcare. Our main hypotheses are that compassionate healthcare is beneficial for (1) patients, by improving clinical outcomes, (2) healthcare systems and payers, by supporting financial sustainability, and (3) HCPs, by lowering burnout and promoting resilience and well-being. The purpose of this paper is to establish a scientific framework for testing the hypotheses above . If these hypotheses are confirmed through rigorous research, compassionomics will belong in the science of evidence-based medicine, with major implications for all healthcare domains.” 26
- EXAMPLE 4. Statistical hypothesis (quantitative research)
- - An assumption is made about the relationship among several population characteristics ( gender differences in sociodemographic and clinical characteristics of adults with ADHD ). Validity is tested by statistical experiment or analysis ( chi-square test, Students t-test, and logistic regression analysis)
- “Our research investigated gender differences in sociodemographic and clinical characteristics of adults with ADHD in a Japanese clinical sample. Due to unique Japanese cultural ideals and expectations of women's behavior that are in opposition to ADHD symptoms, we hypothesized that women with ADHD experience more difficulties and present more dysfunctions than men . We tested the following hypotheses: first, women with ADHD have more comorbidities than men with ADHD; second, women with ADHD experience more social hardships than men, such as having less full-time employment and being more likely to be divorced.” 27
- “Statistical Analysis
- ( text omitted ) Between-gender comparisons were made using the chi-squared test for categorical variables and Students t-test for continuous variables…( text omitted ). A logistic regression analysis was performed for employment status, marital status, and comorbidity to evaluate the independent effects of gender on these dependent variables.” 27
EXAMPLES OF HYPOTHESIS AS WRITTEN IN PUBLISHED ARTICLES IN RELATION TO OTHER PARTS
- EXAMPLE 1. Background, hypotheses, and aims are provided
- “Pregnant women need skilled care during pregnancy and childbirth, but that skilled care is often delayed in some countries …( text omitted ). The focused antenatal care (FANC) model of WHO recommends that nurses provide information or counseling to all pregnant women …( text omitted ). Job aids are visual support materials that provide the right kind of information using graphics and words in a simple and yet effective manner. When nurses are not highly trained or have many work details to attend to, these job aids can serve as a content reminder for the nurses and can be used for educating their patients (Jennings, Yebadokpo, Affo, & Agbogbe, 2010) ( text omitted ). Importantly, additional evidence is needed to confirm how job aids can further improve the quality of ANC counseling by health workers in maternal care …( text omitted )” 28
- “ This has led us to hypothesize that the quality of ANC counseling would be better if supported by job aids. Consequently, a better quality of ANC counseling is expected to produce higher levels of awareness concerning the danger signs of pregnancy and a more favorable impression of the caring behavior of nurses .” 28
- “This study aimed to examine the differences in the responses of pregnant women to a job aid-supported intervention during ANC visit in terms of 1) their understanding of the danger signs of pregnancy and 2) their impression of the caring behaviors of nurses to pregnant women in rural Tanzania.” 28
- EXAMPLE 2. Background, hypotheses, and aims are provided
- “We conducted a two-arm randomized controlled trial (RCT) to evaluate and compare changes in salivary cortisol and oxytocin levels of first-time pregnant women between experimental and control groups. The women in the experimental group touched and held an infant for 30 min (experimental intervention protocol), whereas those in the control group watched a DVD movie of an infant (control intervention protocol). The primary outcome was salivary cortisol level and the secondary outcome was salivary oxytocin level.” 29
- “ We hypothesize that at 30 min after touching and holding an infant, the salivary cortisol level will significantly decrease and the salivary oxytocin level will increase in the experimental group compared with the control group .” 29
- EXAMPLE 3. Background, aim, and hypothesis are provided
- “In countries where the maternal mortality ratio remains high, antenatal education to increase Birth Preparedness and Complication Readiness (BPCR) is considered one of the top priorities [1]. BPCR includes birth plans during the antenatal period, such as the birthplace, birth attendant, transportation, health facility for complications, expenses, and birth materials, as well as family coordination to achieve such birth plans. In Tanzania, although increasing, only about half of all pregnant women attend an antenatal clinic more than four times [4]. Moreover, the information provided during antenatal care (ANC) is insufficient. In the resource-poor settings, antenatal group education is a potential approach because of the limited time for individual counseling at antenatal clinics.” 30
- “This study aimed to evaluate an antenatal group education program among pregnant women and their families with respect to birth-preparedness and maternal and infant outcomes in rural villages of Tanzania.” 30
- “ The study hypothesis was if Tanzanian pregnant women and their families received a family-oriented antenatal group education, they would (1) have a higher level of BPCR, (2) attend antenatal clinic four or more times, (3) give birth in a health facility, (4) have less complications of women at birth, and (5) have less complications and deaths of infants than those who did not receive the education .” 30
Research questions and hypotheses are crucial components to any type of research, whether quantitative or qualitative. These questions should be developed at the very beginning of the study. Excellent research questions lead to superior hypotheses, which, like a compass, set the direction of research, and can often determine the successful conduct of the study. Many research studies have floundered because the development of research questions and subsequent hypotheses was not given the thought and meticulous attention needed. The development of research questions and hypotheses is an iterative process based on extensive knowledge of the literature and insightful grasp of the knowledge gap. Focused, concise, and specific research questions provide a strong foundation for constructing hypotheses which serve as formal predictions about the research outcomes. Research questions and hypotheses are crucial elements of research that should not be overlooked. They should be carefully thought of and constructed when planning research. This avoids unethical studies and poor outcomes by defining well-founded objectives that determine the design, course, and outcome of the study.
Disclosure: The authors have no potential conflicts of interest to disclose.
Author Contributions:
- Conceptualization: Barroga E, Matanguihan GJ.
- Methodology: Barroga E, Matanguihan GJ.
- Writing - original draft: Barroga E, Matanguihan GJ.
- Writing - review & editing: Barroga E, Matanguihan GJ.
Have a language expert improve your writing
Run a free plagiarism check in 10 minutes, automatically generate references for free.
- Knowledge Base
- Methodology
Research Design | Step-by-Step Guide with Examples
Published on 5 May 2022 by Shona McCombes . Revised on 20 March 2023.
A research design is a strategy for answering your research question using empirical data. Creating a research design means making decisions about:
- Your overall aims and approach
- The type of research design you’ll use
- Your sampling methods or criteria for selecting subjects
- Your data collection methods
- The procedures you’ll follow to collect data
- Your data analysis methods
A well-planned research design helps ensure that your methods match your research aims and that you use the right kind of analysis for your data.
Table of contents
Step 1: consider your aims and approach, step 2: choose a type of research design, step 3: identify your population and sampling method, step 4: choose your data collection methods, step 5: plan your data collection procedures, step 6: decide on your data analysis strategies, frequently asked questions.
- Introduction
Before you can start designing your research, you should already have a clear idea of the research question you want to investigate.
There are many different ways you could go about answering this question. Your research design choices should be driven by your aims and priorities – start by thinking carefully about what you want to achieve.
The first choice you need to make is whether you’ll take a qualitative or quantitative approach.
Qualitative research designs tend to be more flexible and inductive , allowing you to adjust your approach based on what you find throughout the research process.
Quantitative research designs tend to be more fixed and deductive , with variables and hypotheses clearly defined in advance of data collection.
It’s also possible to use a mixed methods design that integrates aspects of both approaches. By combining qualitative and quantitative insights, you can gain a more complete picture of the problem you’re studying and strengthen the credibility of your conclusions.
Practical and ethical considerations when designing research
As well as scientific considerations, you need to think practically when designing your research. If your research involves people or animals, you also need to consider research ethics .
- How much time do you have to collect data and write up the research?
- Will you be able to gain access to the data you need (e.g., by travelling to a specific location or contacting specific people)?
- Do you have the necessary research skills (e.g., statistical analysis or interview techniques)?
- Will you need ethical approval ?
At each stage of the research design process, make sure that your choices are practically feasible.
Prevent plagiarism, run a free check.
Within both qualitative and quantitative approaches, there are several types of research design to choose from. Each type provides a framework for the overall shape of your research.
Types of quantitative research designs
Quantitative designs can be split into four main types. Experimental and quasi-experimental designs allow you to test cause-and-effect relationships, while descriptive and correlational designs allow you to measure variables and describe relationships between them.
With descriptive and correlational designs, you can get a clear picture of characteristics, trends, and relationships as they exist in the real world. However, you can’t draw conclusions about cause and effect (because correlation doesn’t imply causation ).
Experiments are the strongest way to test cause-and-effect relationships without the risk of other variables influencing the results. However, their controlled conditions may not always reflect how things work in the real world. They’re often also more difficult and expensive to implement.
Types of qualitative research designs
Qualitative designs are less strictly defined. This approach is about gaining a rich, detailed understanding of a specific context or phenomenon, and you can often be more creative and flexible in designing your research.
The table below shows some common types of qualitative design. They often have similar approaches in terms of data collection, but focus on different aspects when analysing the data.
Your research design should clearly define who or what your research will focus on, and how you’ll go about choosing your participants or subjects.
In research, a population is the entire group that you want to draw conclusions about, while a sample is the smaller group of individuals you’ll actually collect data from.
Defining the population
A population can be made up of anything you want to study – plants, animals, organisations, texts, countries, etc. In the social sciences, it most often refers to a group of people.
For example, will you focus on people from a specific demographic, region, or background? Are you interested in people with a certain job or medical condition, or users of a particular product?
The more precisely you define your population, the easier it will be to gather a representative sample.
Sampling methods
Even with a narrowly defined population, it’s rarely possible to collect data from every individual. Instead, you’ll collect data from a sample.
To select a sample, there are two main approaches: probability sampling and non-probability sampling . The sampling method you use affects how confidently you can generalise your results to the population as a whole.
Probability sampling is the most statistically valid option, but it’s often difficult to achieve unless you’re dealing with a very small and accessible population.
For practical reasons, many studies use non-probability sampling, but it’s important to be aware of the limitations and carefully consider potential biases. You should always make an effort to gather a sample that’s as representative as possible of the population.
Case selection in qualitative research
In some types of qualitative designs, sampling may not be relevant.
For example, in an ethnography or a case study, your aim is to deeply understand a specific context, not to generalise to a population. Instead of sampling, you may simply aim to collect as much data as possible about the context you are studying.
In these types of design, you still have to carefully consider your choice of case or community. You should have a clear rationale for why this particular case is suitable for answering your research question.
For example, you might choose a case study that reveals an unusual or neglected aspect of your research problem, or you might choose several very similar or very different cases in order to compare them.
Data collection methods are ways of directly measuring variables and gathering information. They allow you to gain first-hand knowledge and original insights into your research problem.
You can choose just one data collection method, or use several methods in the same study.
Survey methods
Surveys allow you to collect data about opinions, behaviours, experiences, and characteristics by asking people directly. There are two main survey methods to choose from: questionnaires and interviews.
Observation methods
Observations allow you to collect data unobtrusively, observing characteristics, behaviours, or social interactions without relying on self-reporting.
Observations may be conducted in real time, taking notes as you observe, or you might make audiovisual recordings for later analysis. They can be qualitative or quantitative.
Other methods of data collection
There are many other ways you might collect data depending on your field and topic.
If you’re not sure which methods will work best for your research design, try reading some papers in your field to see what data collection methods they used.
Secondary data
If you don’t have the time or resources to collect data from the population you’re interested in, you can also choose to use secondary data that other researchers already collected – for example, datasets from government surveys or previous studies on your topic.
With this raw data, you can do your own analysis to answer new research questions that weren’t addressed by the original study.
Using secondary data can expand the scope of your research, as you may be able to access much larger and more varied samples than you could collect yourself.
However, it also means you don’t have any control over which variables to measure or how to measure them, so the conclusions you can draw may be limited.
As well as deciding on your methods, you need to plan exactly how you’ll use these methods to collect data that’s consistent, accurate, and unbiased.
Planning systematic procedures is especially important in quantitative research, where you need to precisely define your variables and ensure your measurements are reliable and valid.
Operationalisation
Some variables, like height or age, are easily measured. But often you’ll be dealing with more abstract concepts, like satisfaction, anxiety, or competence. Operationalisation means turning these fuzzy ideas into measurable indicators.
If you’re using observations , which events or actions will you count?
If you’re using surveys , which questions will you ask and what range of responses will be offered?
You may also choose to use or adapt existing materials designed to measure the concept you’re interested in – for example, questionnaires or inventories whose reliability and validity has already been established.
Reliability and validity
Reliability means your results can be consistently reproduced , while validity means that you’re actually measuring the concept you’re interested in.
For valid and reliable results, your measurement materials should be thoroughly researched and carefully designed. Plan your procedures to make sure you carry out the same steps in the same way for each participant.
If you’re developing a new questionnaire or other instrument to measure a specific concept, running a pilot study allows you to check its validity and reliability in advance.
Sampling procedures
As well as choosing an appropriate sampling method, you need a concrete plan for how you’ll actually contact and recruit your selected sample.
That means making decisions about things like:
- How many participants do you need for an adequate sample size?
- What inclusion and exclusion criteria will you use to identify eligible participants?
- How will you contact your sample – by mail, online, by phone, or in person?
If you’re using a probability sampling method, it’s important that everyone who is randomly selected actually participates in the study. How will you ensure a high response rate?
If you’re using a non-probability method, how will you avoid bias and ensure a representative sample?
Data management
It’s also important to create a data management plan for organising and storing your data.
Will you need to transcribe interviews or perform data entry for observations? You should anonymise and safeguard any sensitive data, and make sure it’s backed up regularly.
Keeping your data well organised will save time when it comes to analysing them. It can also help other researchers validate and add to your findings.
On their own, raw data can’t answer your research question. The last step of designing your research is planning how you’ll analyse the data.
Quantitative data analysis
In quantitative research, you’ll most likely use some form of statistical analysis . With statistics, you can summarise your sample data, make estimates, and test hypotheses.
Using descriptive statistics , you can summarise your sample data in terms of:
- The distribution of the data (e.g., the frequency of each score on a test)
- The central tendency of the data (e.g., the mean to describe the average score)
- The variability of the data (e.g., the standard deviation to describe how spread out the scores are)
The specific calculations you can do depend on the level of measurement of your variables.
Using inferential statistics , you can:
- Make estimates about the population based on your sample data.
- Test hypotheses about a relationship between variables.
Regression and correlation tests look for associations between two or more variables, while comparison tests (such as t tests and ANOVAs ) look for differences in the outcomes of different groups.
Your choice of statistical test depends on various aspects of your research design, including the types of variables you’re dealing with and the distribution of your data.
Qualitative data analysis
In qualitative research, your data will usually be very dense with information and ideas. Instead of summing it up in numbers, you’ll need to comb through the data in detail, interpret its meanings, identify patterns, and extract the parts that are most relevant to your research question.
Two of the most common approaches to doing this are thematic analysis and discourse analysis .
There are many other ways of analysing qualitative data depending on the aims of your research. To get a sense of potential approaches, try reading some qualitative research papers in your field.
A sample is a subset of individuals from a larger population. Sampling means selecting the group that you will actually collect data from in your research.
For example, if you are researching the opinions of students in your university, you could survey a sample of 100 students.
Statistical sampling allows you to test a hypothesis about the characteristics of a population. There are various sampling methods you can use to ensure that your sample is representative of the population as a whole.
Operationalisation means turning abstract conceptual ideas into measurable observations.
For example, the concept of social anxiety isn’t directly observable, but it can be operationally defined in terms of self-rating scores, behavioural avoidance of crowded places, or physical anxiety symptoms in social situations.
Before collecting data , it’s important to consider how you will operationalise the variables that you want to measure.
The research methods you use depend on the type of data you need to answer your research question .
- If you want to measure something or test a hypothesis , use quantitative methods . If you want to explore ideas, thoughts, and meanings, use qualitative methods .
- If you want to analyse a large amount of readily available data, use secondary data. If you want data specific to your purposes with control over how they are generated, collect primary data.
- If you want to establish cause-and-effect relationships between variables , use experimental methods. If you want to understand the characteristics of a research subject, use descriptive methods.
Cite this Scribbr article
If you want to cite this source, you can copy and paste the citation or click the ‘Cite this Scribbr article’ button to automatically add the citation to our free Reference Generator.
McCombes, S. (2023, March 20). Research Design | Step-by-Step Guide with Examples. Scribbr. Retrieved 8 April 2024, from https://www.scribbr.co.uk/research-methods/research-design/
Is this article helpful?

Shona McCombes
- Locations and Hours
- UCLA Library
- Research Guides
- Research Tips and Tools
Advanced Research Methods
Writing the research paper.
- What Is Research?
- Library Research
- Writing a Research Proposal
Before Writing the Paper
Methods, thesis, and hypothesis, clarity, precision, and academic expression, format your paper, typical problems, a few suggestions, avoid plagiarism.
- Presenting the Research Paper
- Try to find a subject that really interests you.
- While you explore the topic, narrow or broaden your target and focus on something that gives the most promising results.
- Don't choose a huge subject if you have to write a 3 page long paper, and broaden your topic sufficiently if you have to submit at least 25 pages.
- Consult your class instructor (and your classmates) about the topic.
- Find primary and secondary sources in the library.
- Read and critically analyse them.
- Take notes.
- Compile surveys, collect data, gather materials for quantitative analysis (if these are good methods to investigate the topic more deeply).
- Come up with new ideas about the topic. Try to formulate your ideas in a few sentences.
- Review your notes and other materials and enrich the outline.
- Try to estimate how long the individual parts will be.
- Do others understand what you want to say?
- Do they accept it as new knowledge or relevant and important for a paper?
- Do they agree that your thoughts will result in a successful paper?
- Qualitative: gives answers on questions (how, why, when, who, what, etc.) by investigating an issue
- Quantitative:requires data and the analysis of data as well
- the essence, the point of the research paper in one or two sentences.
- a statement that can be proved or disproved.
- Be specific.
- Avoid ambiguity.
- Use predominantly the active voice, not the passive.
- Deal with one issue in one paragraph.
- Be accurate.
- Double-check your data, references, citations and statements.
Academic Expression
- Don't use familiar style or colloquial/slang expressions.
- Write in full sentences.
- Check the meaning of the words if you don't know exactly what they mean.
- Avoid metaphors.
- Almost the rough content of every paragraph.
- The order of the various topics in your paper.
- On the basis of the outline, start writing a part by planning the content, and then write it down.
- Put a visible mark (which you will later delete) where you need to quote a source, and write in the citation when you finish writing that part or a bigger part.
- Does the text make sense?
- Could you explain what you wanted?
- Did you write good sentences?
- Is there something missing?
- Check the spelling.
- Complete the citations, bring them in standard format.
Use the guidelines that your instructor requires (MLA, Chicago, APA, Turabian, etc.).
- Adjust margins, spacing, paragraph indentation, place of page numbers, etc.
- Standardize the bibliography or footnotes according to the guidelines.

- EndNote and EndNote Basic by UCLA Library Last Updated Mar 18, 2024 667 views this year
- Zotero by UCLA Library Last Updated Jan 18, 2023 507 views this year
(Based on English Composition 2 from Illinois Valley Community College):
- Weak organization
- Poor support and development of ideas
- Weak use of secondary sources
- Excessive errors
- Stylistic weakness
When collecting materials, selecting research topic, and writing the paper:
- Be systematic and organized (e.g. keep your bibliography neat and organized; write your notes in a neat way, so that you can find them later on.
- Use your critical thinking ability when you read.
- Write down your thoughts (so that you can reconstruct them later).
- Stop when you have a really good idea and think about whether you could enlarge it to a whole research paper. If yes, take much longer notes.
- When you write down a quotation or summarize somebody else's thoughts in your notes or in the paper, cite the source (i.e. write down the author, title, publication place, year, page number).
- If you quote or summarize a thought from the internet, cite the internet source.
- Write an outline that is detailed enough to remind you about the content.
- Read your paper for yourself or, preferably, somebody else.
- When you finish writing, check the spelling;
- Use the citation form (MLA, Chicago, or other) that your instructor requires and use it everywhere.
Plagiarism : somebody else's words or ideas presented without citation by an author
- Cite your source every time when you quote a part of somebody's work.
- Cite your source every time when you summarize a thought from somebody's work.
- Cite your source every time when you use a source (quote or summarize) from the Internet.
Consult the Citing Sources research guide for further details.
- << Previous: Writing a Research Proposal
- Next: Presenting the Research Paper >>
- Last Updated: Jan 4, 2024 12:24 PM
- URL: https://guides.library.ucla.edu/research-methods
Get science-backed answers as you write with Paperpal's Research feature
What is Research Methodology? Definition, Types, and Examples

Research methodology 1,2 is a structured and scientific approach used to collect, analyze, and interpret quantitative or qualitative data to answer research questions or test hypotheses. A research methodology is like a plan for carrying out research and helps keep researchers on track by limiting the scope of the research. Several aspects must be considered before selecting an appropriate research methodology, such as research limitations and ethical concerns that may affect your research.
The research methodology section in a scientific paper describes the different methodological choices made, such as the data collection and analysis methods, and why these choices were selected. The reasons should explain why the methods chosen are the most appropriate to answer the research question. A good research methodology also helps ensure the reliability and validity of the research findings. There are three types of research methodology—quantitative, qualitative, and mixed-method, which can be chosen based on the research objectives.
What is research methodology ?
A research methodology describes the techniques and procedures used to identify and analyze information regarding a specific research topic. It is a process by which researchers design their study so that they can achieve their objectives using the selected research instruments. It includes all the important aspects of research, including research design, data collection methods, data analysis methods, and the overall framework within which the research is conducted. While these points can help you understand what is research methodology, you also need to know why it is important to pick the right methodology.
Why is research methodology important?
Having a good research methodology in place has the following advantages: 3
- Helps other researchers who may want to replicate your research; the explanations will be of benefit to them.
- You can easily answer any questions about your research if they arise at a later stage.
- A research methodology provides a framework and guidelines for researchers to clearly define research questions, hypotheses, and objectives.
- It helps researchers identify the most appropriate research design, sampling technique, and data collection and analysis methods.
- A sound research methodology helps researchers ensure that their findings are valid and reliable and free from biases and errors.
- It also helps ensure that ethical guidelines are followed while conducting research.
- A good research methodology helps researchers in planning their research efficiently, by ensuring optimum usage of their time and resources.
Writing the methods section of a research paper? Let Paperpal help you achieve perfection
Types of research methodology.
There are three types of research methodology based on the type of research and the data required. 1
- Quantitative research methodology focuses on measuring and testing numerical data. This approach is good for reaching a large number of people in a short amount of time. This type of research helps in testing the causal relationships between variables, making predictions, and generalizing results to wider populations.
- Qualitative research methodology examines the opinions, behaviors, and experiences of people. It collects and analyzes words and textual data. This research methodology requires fewer participants but is still more time consuming because the time spent per participant is quite large. This method is used in exploratory research where the research problem being investigated is not clearly defined.
- Mixed-method research methodology uses the characteristics of both quantitative and qualitative research methodologies in the same study. This method allows researchers to validate their findings, verify if the results observed using both methods are complementary, and explain any unexpected results obtained from one method by using the other method.
What are the types of sampling designs in research methodology?
Sampling 4 is an important part of a research methodology and involves selecting a representative sample of the population to conduct the study, making statistical inferences about them, and estimating the characteristics of the whole population based on these inferences. There are two types of sampling designs in research methodology—probability and nonprobability.
- Probability sampling
In this type of sampling design, a sample is chosen from a larger population using some form of random selection, that is, every member of the population has an equal chance of being selected. The different types of probability sampling are:
- Systematic —sample members are chosen at regular intervals. It requires selecting a starting point for the sample and sample size determination that can be repeated at regular intervals. This type of sampling method has a predefined range; hence, it is the least time consuming.
- Stratified —researchers divide the population into smaller groups that don’t overlap but represent the entire population. While sampling, these groups can be organized, and then a sample can be drawn from each group separately.
- Cluster —the population is divided into clusters based on demographic parameters like age, sex, location, etc.
- Convenience —selects participants who are most easily accessible to researchers due to geographical proximity, availability at a particular time, etc.
- Purposive —participants are selected at the researcher’s discretion. Researchers consider the purpose of the study and the understanding of the target audience.
- Snowball —already selected participants use their social networks to refer the researcher to other potential participants.
- Quota —while designing the study, the researchers decide how many people with which characteristics to include as participants. The characteristics help in choosing people most likely to provide insights into the subject.
What are data collection methods?
During research, data are collected using various methods depending on the research methodology being followed and the research methods being undertaken. Both qualitative and quantitative research have different data collection methods, as listed below.
Qualitative research 5
- One-on-one interviews: Helps the interviewers understand a respondent’s subjective opinion and experience pertaining to a specific topic or event
- Document study/literature review/record keeping: Researchers’ review of already existing written materials such as archives, annual reports, research articles, guidelines, policy documents, etc.
- Focus groups: Constructive discussions that usually include a small sample of about 6-10 people and a moderator, to understand the participants’ opinion on a given topic.
- Qualitative observation : Researchers collect data using their five senses (sight, smell, touch, taste, and hearing).
Quantitative research 6
- Sampling: The most common type is probability sampling.
- Interviews: Commonly telephonic or done in-person.
- Observations: Structured observations are most commonly used in quantitative research. In this method, researchers make observations about specific behaviors of individuals in a structured setting.
- Document review: Reviewing existing research or documents to collect evidence for supporting the research.
- Surveys and questionnaires. Surveys can be administered both online and offline depending on the requirement and sample size.
Let Paperpal help you write the perfect research methods section. Start now!
What are data analysis methods.
The data collected using the various methods for qualitative and quantitative research need to be analyzed to generate meaningful conclusions. These data analysis methods 7 also differ between quantitative and qualitative research.
Quantitative research involves a deductive method for data analysis where hypotheses are developed at the beginning of the research and precise measurement is required. The methods include statistical analysis applications to analyze numerical data and are grouped into two categories—descriptive and inferential.
Descriptive analysis is used to describe the basic features of different types of data to present it in a way that ensures the patterns become meaningful. The different types of descriptive analysis methods are:
- Measures of frequency (count, percent, frequency)
- Measures of central tendency (mean, median, mode)
- Measures of dispersion or variation (range, variance, standard deviation)
- Measure of position (percentile ranks, quartile ranks)
Inferential analysis is used to make predictions about a larger population based on the analysis of the data collected from a smaller population. This analysis is used to study the relationships between different variables. Some commonly used inferential data analysis methods are:
- Correlation: To understand the relationship between two or more variables.
- Cross-tabulation: Analyze the relationship between multiple variables.
- Regression analysis: Study the impact of independent variables on the dependent variable.
- Frequency tables: To understand the frequency of data.
- Analysis of variance: To test the degree to which two or more variables differ in an experiment.
Qualitative research involves an inductive method for data analysis where hypotheses are developed after data collection. The methods include:
- Content analysis: For analyzing documented information from text and images by determining the presence of certain words or concepts in texts.
- Narrative analysis: For analyzing content obtained from sources such as interviews, field observations, and surveys. The stories and opinions shared by people are used to answer research questions.
- Discourse analysis: For analyzing interactions with people considering the social context, that is, the lifestyle and environment, under which the interaction occurs.
- Grounded theory: Involves hypothesis creation by data collection and analysis to explain why a phenomenon occurred.
- Thematic analysis: To identify important themes or patterns in data and use these to address an issue.
How to choose a research methodology?
Here are some important factors to consider when choosing a research methodology: 8
- Research objectives, aims, and questions —these would help structure the research design.
- Review existing literature to identify any gaps in knowledge.
- Check the statistical requirements —if data-driven or statistical results are needed then quantitative research is the best. If the research questions can be answered based on people’s opinions and perceptions, then qualitative research is most suitable.
- Sample size —sample size can often determine the feasibility of a research methodology. For a large sample, less effort- and time-intensive methods are appropriate.
- Constraints —constraints of time, geography, and resources can help define the appropriate methodology.
Got writer’s block? Kickstart your research paper writing with Paperpal now!
How to write a research methodology .
A research methodology should include the following components: 3,9
- Research design —should be selected based on the research question and the data required. Common research designs include experimental, quasi-experimental, correlational, descriptive, and exploratory.
- Research method —this can be quantitative, qualitative, or mixed-method.
- Reason for selecting a specific methodology —explain why this methodology is the most suitable to answer your research problem.
- Research instruments —explain the research instruments you plan to use, mainly referring to the data collection methods such as interviews, surveys, etc. Here as well, a reason should be mentioned for selecting the particular instrument.
- Sampling —this involves selecting a representative subset of the population being studied.
- Data collection —involves gathering data using several data collection methods, such as surveys, interviews, etc.
- Data analysis —describe the data analysis methods you will use once you’ve collected the data.
- Research limitations —mention any limitations you foresee while conducting your research.
- Validity and reliability —validity helps identify the accuracy and truthfulness of the findings; reliability refers to the consistency and stability of the results over time and across different conditions.
- Ethical considerations —research should be conducted ethically. The considerations include obtaining consent from participants, maintaining confidentiality, and addressing conflicts of interest.
Streamline Your Research Paper Writing Process with Paperpal
The methods section is a critical part of the research papers, allowing researchers to use this to understand your findings and replicate your work when pursuing their own research. However, it is usually also the most difficult section to write. This is where Paperpal can help you overcome the writer’s block and create the first draft in minutes with Paperpal Copilot, its secure generative AI feature suite.
With Paperpal you can get research advice, write and refine your work, rephrase and verify the writing, and ensure submission readiness, all in one place. Here’s how you can use Paperpal to develop the first draft of your methods section.
- Generate an outline: Input some details about your research to instantly generate an outline for your methods section
- Develop the section: Use the outline and suggested sentence templates to expand your ideas and develop the first draft.
- P araph ras e and trim : Get clear, concise academic text with paraphrasing that conveys your work effectively and word reduction to fix redundancies.
- Choose the right words: Enhance text by choosing contextual synonyms based on how the words have been used in previously published work.
- Check and verify text : Make sure the generated text showcases your methods correctly, has all the right citations, and is original and authentic. .
You can repeat this process to develop each section of your research manuscript, including the title, abstract and keywords. Ready to write your research papers faster, better, and without the stress? Sign up for Paperpal and start writing today!
Frequently Asked Questions
Q1. What are the key components of research methodology?
A1. A good research methodology has the following key components:
- Research design
- Data collection procedures
- Data analysis methods
- Ethical considerations
Q2. Why is ethical consideration important in research methodology?
A2. Ethical consideration is important in research methodology to ensure the readers of the reliability and validity of the study. Researchers must clearly mention the ethical norms and standards followed during the conduct of the research and also mention if the research has been cleared by any institutional board. The following 10 points are the important principles related to ethical considerations: 10
- Participants should not be subjected to harm.
- Respect for the dignity of participants should be prioritized.
- Full consent should be obtained from participants before the study.
- Participants’ privacy should be ensured.
- Confidentiality of the research data should be ensured.
- Anonymity of individuals and organizations participating in the research should be maintained.
- The aims and objectives of the research should not be exaggerated.
- Affiliations, sources of funding, and any possible conflicts of interest should be declared.
- Communication in relation to the research should be honest and transparent.
- Misleading information and biased representation of primary data findings should be avoided.
Q3. What is the difference between methodology and method?
A3. Research methodology is different from a research method, although both terms are often confused. Research methods are the tools used to gather data, while the research methodology provides a framework for how research is planned, conducted, and analyzed. The latter guides researchers in making decisions about the most appropriate methods for their research. Research methods refer to the specific techniques, procedures, and tools used by researchers to collect, analyze, and interpret data, for instance surveys, questionnaires, interviews, etc.
Research methodology is, thus, an integral part of a research study. It helps ensure that you stay on track to meet your research objectives and answer your research questions using the most appropriate data collection and analysis tools based on your research design.
Accelerate your research paper writing with Paperpal. Try for free now!
- Research methodologies. Pfeiffer Library website. Accessed August 15, 2023. https://library.tiffin.edu/researchmethodologies/whatareresearchmethodologies
- Types of research methodology. Eduvoice website. Accessed August 16, 2023. https://eduvoice.in/types-research-methodology/
- The basics of research methodology: A key to quality research. Voxco. Accessed August 16, 2023. https://www.voxco.com/blog/what-is-research-methodology/
- Sampling methods: Types with examples. QuestionPro website. Accessed August 16, 2023. https://www.questionpro.com/blog/types-of-sampling-for-social-research/
- What is qualitative research? Methods, types, approaches, examples. Researcher.Life blog. Accessed August 15, 2023. https://researcher.life/blog/article/what-is-qualitative-research-methods-types-examples/
- What is quantitative research? Definition, methods, types, and examples. Researcher.Life blog. Accessed August 15, 2023. https://researcher.life/blog/article/what-is-quantitative-research-types-and-examples/
- Data analysis in research: Types & methods. QuestionPro website. Accessed August 16, 2023. https://www.questionpro.com/blog/data-analysis-in-research/#Data_analysis_in_qualitative_research
- Factors to consider while choosing the right research methodology. PhD Monster website. Accessed August 17, 2023. https://www.phdmonster.com/factors-to-consider-while-choosing-the-right-research-methodology/
- What is research methodology? Research and writing guides. Accessed August 14, 2023. https://paperpile.com/g/what-is-research-methodology/
- Ethical considerations. Business research methodology website. Accessed August 17, 2023. https://research-methodology.net/research-methodology/ethical-considerations/
Paperpal is a comprehensive AI writing toolkit that helps students and researchers achieve 2x the writing in half the time. It leverages 21+ years of STM experience and insights from millions of research articles to provide in-depth academic writing, language editing, and submission readiness support to help you write better, faster.
Get accurate academic translations, rewriting support, grammar checks, vocabulary suggestions, and generative AI assistance that delivers human precision at machine speed. Try for free or upgrade to Paperpal Prime starting at US$19 a month to access premium features, including consistency, plagiarism, and 30+ submission readiness checks to help you succeed.
Experience the future of academic writing – Sign up to Paperpal and start writing for free!
Related Reads:
- Dangling Modifiers and How to Avoid Them in Your Writing
- Webinar: How to Use Generative AI Tools Ethically in Your Academic Writing
- Research Outlines: How to Write An Introduction Section in Minutes with Paperpal Copilot
- How to Paraphrase Research Papers Effectively
Language and Grammar Rules for Academic Writing
Climatic vs. climactic: difference and examples, you may also like, how to use paperpal to generate emails &..., ai in education: it’s time to change the..., is it ethical to use ai-generated abstracts without..., do plagiarism checkers detect ai content, word choice problems: how to use the right..., how to avoid plagiarism when using generative ai..., what are journal guidelines on using generative ai..., types of plagiarism and 6 tips to avoid..., how to write an essay introduction (with examples)..., similarity checks: the author’s guide to plagiarism and....

- Research Process
Choosing the Right Research Methodology: A Guide for Researchers
- 3 minute read
- 34.6K views
Table of Contents
Choosing an optimal research methodology is crucial for the success of any research project. The methodology you select will determine the type of data you collect, how you collect it, and how you analyse it. Understanding the different types of research methods available along with their strengths and weaknesses, is thus imperative to make an informed decision.
Understanding different research methods:
There are several research methods available depending on the type of study you are conducting, i.e., whether it is laboratory-based, clinical, epidemiological, or survey based . Some common methodologies include qualitative research, quantitative research, experimental research, survey-based research, and action research. Each method can be opted for and modified, depending on the type of research hypotheses and objectives.
Qualitative vs quantitative research:
When deciding on a research methodology, one of the key factors to consider is whether your research will be qualitative or quantitative. Qualitative research is used to understand people’s experiences, concepts, thoughts, or behaviours . Quantitative research, on the contrary, deals with numbers, graphs, and charts, and is used to test or confirm hypotheses, assumptions, and theories.
Qualitative research methodology:
Qualitative research is often used to examine issues that are not well understood, and to gather additional insights on these topics. Qualitative research methods include open-ended survey questions, observations of behaviours described through words, and reviews of literature that has explored similar theories and ideas. These methods are used to understand how language is used in real-world situations, identify common themes or overarching ideas, and describe and interpret various texts. Data analysis for qualitative research typically includes discourse analysis, thematic analysis, and textual analysis.
Quantitative research methodology:
The goal of quantitative research is to test hypotheses, confirm assumptions and theories, and determine cause-and-effect relationships. Quantitative research methods include experiments, close-ended survey questions, and countable and numbered observations. Data analysis for quantitative research relies heavily on statistical methods.
Analysing qualitative vs quantitative data:
The methods used for data analysis also differ for qualitative and quantitative research. As mentioned earlier, quantitative data is generally analysed using statistical methods and does not leave much room for speculation. It is more structured and follows a predetermined plan. In quantitative research, the researcher starts with a hypothesis and uses statistical methods to test it. Contrarily, methods used for qualitative data analysis can identify patterns and themes within the data, rather than provide statistical measures of the data. It is an iterative process, where the researcher goes back and forth trying to gauge the larger implications of the data through different perspectives and revising the analysis if required.
When to use qualitative vs quantitative research:
The choice between qualitative and quantitative research will depend on the gap that the research project aims to address, and specific objectives of the study. If the goal is to establish facts about a subject or topic, quantitative research is an appropriate choice. However, if the goal is to understand people’s experiences or perspectives, qualitative research may be more suitable.
Conclusion:
In conclusion, an understanding of the different research methods available, their applicability, advantages, and disadvantages is essential for making an informed decision on the best methodology for your project. If you need any additional guidance on which research methodology to opt for, you can head over to Elsevier Author Services (EAS). EAS experts will guide you throughout the process and help you choose the perfect methodology for your research goals.

Why is data validation important in research?

When Data Speak, Listen: Importance of Data Collection and Analysis Methods
You may also like.

Descriptive Research Design and Its Myriad Uses

Five Common Mistakes to Avoid When Writing a Biomedical Research Paper

Making Technical Writing in Environmental Engineering Accessible

To Err is Not Human: The Dangers of AI-assisted Academic Writing

Writing a good review article

Scholarly Sources: What are They and Where can You Find Them?
Input your search keywords and press Enter.
Research Guides
Gould library, geol 298: geoscience research methods.
- Finding Articles
- Finding Books
- Maps and Geographic Information
- Information on the Web
- Using Zotero
Writing Up Research
Writing a research paper means entering into a conversation that is already occurring in the field. Your paper will explain the current state of the topic (what others are saying), your addition to the topic (what you say about the topic), and what it all means. The following tips and techniques for writing academic papers are taken from the book They Say, I Say by Berkenstein and Graff. The link to the book is at the bottom of this page.

They Say...
Before you can add your input to the conversation around a topic or issue, you must understand the state of the issue and what is already being said about the topic. You do this in the literature review section of the article. Literature reviews contain both summary and synthesis of information.
Summary : a recap or restatement of the information information about the topic from relevant sources
Synthesis : a re-shuffling of the information to draw out and highlight new interpretations, intellectual progression, and major debates
In this part of your literature review, you state what others are saying by summarizing and quoting others who have published relevant research on your topic.
How to Respond
Now that you have described the current state of the argument or issue, you then get to add your contribution to the field. In this part of the literature review, you respond to the arguments being made by dis agreeing with the argument, agreeing—but with a difference , or agreeing and disagreeing with it simultaneously.
Disagreeing : if you disagree, state why and provide persuasive evidence.
Examples: " By focusing on ____, X overlooks the deeper problem of ____." " X claims that ____ rests upon the questionable assumption that ____. " " I disagree with X's view that ____ because, as recent research as shown, ____. "
Agreeing with a difference :
Examples: " I agree that ____ because my experience ____ confirms it. " " X's theory of ____ is extremely useful because it sheds insight on the difficult problem of ____ ." " I agree that ____, a point that needs emphasizing since so many people believe ____. "
Agreeing and disagreeing :
Examples: " Although I agree with X up to a point, I cannot accept his overall conclusion that ____. " " Although I disagree with much of what X says, I fully endorse their final conclusion that ____. " " While X is right that ____, they seem to be on more dubious ground with they claim that ____. " " My feelings on the issue are mixed. I do support X's position that ____, but I find Y's argument about ____ and Z's research on ____ to be equally persuasive. "
Distinguishing Your Input from Theirs
To make it clear what your input is and what their input is, make sure that at every point in your argument your readers know who is saying that. You can do that by identifying exactly who is saying something, believes something, or whose position you're referring to.
Examples: " X argues ____. " " According to both X and Y, ____. " " X believes ____, but my own view is ____. " " X overlooks what I consider an important point about ____ ." " These conclusions, which X discusses in ____, add weight to the argument that ____. "
Why Does it Matter?
Once you've expressed what others are saying and added your point of view or additional research, you have to answer the questions, "So what?" and "Who cares?".
Examples: " This interpretation challenges the work of those critics who have long assumed that ____. " " These findings challenge the work of earlier researchers who assumed that ____. " " These findings challenge dieters' common assumptions that ____. " " At first glance, parents might say ____, but on closer inspection, ____. "
Examples: " ____ matters/is important because____. " " Ultimately, what is at stake here is ____. " " These conclusions/This discovery will have significant applications in ____ as well as in ____. " " Although ____ may seem of concern to only a small group of researchers, it should in fact concern anyone who cares about ____. "
Tying it All Together
Connecting the parts.
To help your readers understand the connections you are trying to make, not only do you need to connect sentences and paragraphs together in logical fashion, but you also need to tell them what kind of connection you're making. Types of connections include addition , example , elaboration , comparison , contrast , cause and effect , concession , and conclusion . Examples of how to makes these kinds of connections follow:
Addition : also, and, besides, furthermore, in addition, indeed, in fact, moreover, so too
Example : after all, as an illustration, for example, for instance, specifically, case in point
Elaboration : actually, by extension, in short, that is, in other words, to put it another way, to put it succinctly, utlimately
C omparison : along the same lines, in the same way, likewise, similarly
Contrast : although, but, by contrast, conversely, despite the fact that, even though, however, in contrast, nevertheless, nonetheless, on the contrary, on the other hand, regardless, whereas, while yet
C ause and effect : accordingly, as a result, consequently, hence, since, so then, therefore, thus
C oncession : admittedly, although it is true, granted, naturally, of course, to be sure
C onclusion : as a result, consequently, hence, in conclusion, in short, in sum, therefore, thus, to summarize, to sum up
Finding Your Voice
In They Say, I Say , authors Birkenstein and Graff make the case that writing academic papers doesn't mean you must stop using everyday language. Academic papers can be relaxed, easy to follow, and fun. Knowing when to use the sophisticated words in your discipline and when to use simpler, easier-to-understand words, and even slang (sparingly!) is a function of knowing your audience and purpose.
Metacommentary
Metacommentary occurs when you make a point of explaining something you've written. It happens in academic writing when you need to clarify or provide extra information about what you've written.
Examples: " Essentially, I am arguing that ____. " " What ____ really means is ____. " " In other words, ____. " " Consider ____, for example. " " My conclusion then, is that ____ ."

- << Previous: Using Zotero
- Last Updated: Apr 5, 2024 2:02 PM
- URL: https://gouldguides.carleton.edu/geol298
Questions? Contact [email protected]

Powered by Springshare.

9 methodologies for a successful qualitative research assignment
Qualitative research is important in the educational and scientific domains. It enables a deeper understanding of phenomena, experiences, and context. Many researchers employ such research activities in the fields of history, sociology, and anthropology. For such researchers, learning quality analysis insights is crucial. This way, they can perform well throughout their research journey. Writing a qualitative research assignment is one such way to practice qualitative interpretations. When students address various qualitative questions in these projects, they become efficient in conducting these activities at a higher level, such as for a master’s or Ph.D. thesis.
The FormPlus highlights why researchers prefer qualitative research over quantitative research. It is faster, scientific, objective, focused, and acceptable. Researchers who don’t know what to expect from the research outcomes usually choose qualitative research. In this guide, we will discuss the top methodologies that students can employ while writing their qualitative research assignments. This way, you can write an appealing document that perfectly demonstrates your qualitative research skills.
However, being stressed with academic and daily life commitments, if you find it challenging to manage time exclusively for such projects, availing of assignment writing services can make it manageable. Instead of doing anything wrong in the hustle, get it done by the professionals specifically working to handle these academic write-ups. Now, let’s define quality research before we discuss the actual topic.
What is meant by qualitative research?
Quality research is a market research method that gathers data from conversational and open-ended communication. In simple words, it is about what people think and why they think so. It relates to the nature or standard of something rather than dealing with its quantity. Such researchers collect nonnumerical data to understand opinions, concepts, and ideas.
How do you write a qualitative research assignment? Top 9 methodologies
Writing an assignment requires your command of various tasks. Qualitative research assignment design involves research, writing, structuring, and providing citations of the resources used. Assignment writing plays a crucial role in upgrading your grades.
So, you must make it accurate and authentic. Write it with the utmost care without skipping any important aspects. Sometimes, it can be hard, but it becomes easy if you correctly use effective methodologies. This is why we have brought together some of the common methodologies you can use to write your qualitative research assignments.
1. Interviews
A qualitative interview is mostly used in projects that involve market research. In this study personal interaction is required to collect in-depth information of the participants. In qualitative research for assignment, consider the interview as a personal form of research agenda rather than a focused group study. A qualitative interview requires careful planning so that you can gather meaningful data.
Here are the simple steps to consider for its implementation in a qualitative research assignment:
- Define research objectives.
- Identify the target population.
- Obtain informed consent of participants.
- Make an interview guideline.
- Select a suitable location.
- Conduct the interview.
- Show respect for participant’s perspectives.
- Analyse the data.
2. Observation
In qualitative observation, the researcher gathers data from five senses: sight, hearing, touch, smell, and taste. It is a subject approach that depends on the sensory organ of the researcher. This method allows you to better understand the culture, process, and people under study. Some of its characteristics to consider for writing a qualitative research assignment include,
- It is a naturalistic inquiry of the participants in a natural environment.
- This approach is subjective and depends on the researcher’s observation.
- It does not seek a definite answer to a query.
- The researcher can recognise their own biases when compiling findings.
3. Questionnaires
In this type of survey, the researcher asks open-ended questions to participants. This way, they price the long written or typed document. In writing qualitative research assignments, these questions aim to reveal the participants’ narratives and experiences. Once you know what type of information you need, you can start curating your questionnaire form. The questions must be specific and clear enough that the participants can comprehend them.
Below are the main points that must be considered when creating qualitative research questionnaires.
- Avoid jargon and ambiguity in the questions.
- Each question should contribute to the research objectives.
- Use simple language.
- The questions should be neutral and unbiased.
- Be precise, as the complex questions can overwhelm the respondents.
- Always conduct a pilot test.
- Put yourself in the respondent’s shoes while asking questions.
4. Case Study
A case study is a detailed analysis of a person, place, thing, organisation, or phenomenon. This method is appropriate when you want to gain a contextual, concrete, and in-depth understanding of the real-world problem for writing your qualitative research assignment. This method is especially helpful when you need more time to conduct large-scale research activities.
The four crucial steps below can be followed up with this methodology.
- Select a case that has the potential to provide new and unexpected insights into the subject.
- Make a theoretical framework.
- Collect your data from various primary and secondary resources.
- Describe and analyse the case to provide a clear picture of the subject.
5. Focus Groups
Focused group research has some interesting properties. In this method, a planned interview is conducted within a small group. For this purpose, some of the participants are sampled from the study population to record data for writing a qualitative research assignment. Typically, a focused group has features like,
- At least four to ten participants must meet for up to two hours.
- There must be a facilitator who can guide the discussion by asking open-ended questions.
- The emphasis must be put on the group discussion rather than the discussion of the group members with the facilitator.
- The discussion should be recorded and transcribed by the researchers.
6. Ethnographic Research
It is the most in-depth research method that involves studying people in their natural environment. It requires the researcher to adopt the target audience environment. The environment can be anything from an organisation to a city or any remote location.
However, the geographical constraints can be a problem in this study. For students who are writing their qualitative research assignment, some of the features of ethnographic research to write in their document include,
- The researcher can get a more realistic picture of the study.
- It uncovers extremely valuable insights.
- Provides accurate predictions.
- You can extend the observation to create more in-depth data.
- You can interact with people within a particular context.
7. Record Keeping
This method is similar to going to the library to collect data from books. You consult various relayed books, note the important points, and take note of the referencing. So, the researcher uses already existing data rather than introducing new things in the field.
Later on, this data can be used to conduct new research. Yet, when faced with the vast resources available in your institution’s library, seeking assistance from UK-based assignment writing services is an excellent solution if you need help pinpointing the most relevant information for your topic. Proficient in data gathering and adept at structuring qualitative research assignments, these professionals can significantly elevate your academic results.
This method is mostly used by companies to understand a group of customers’ behaviour, characteristics, and motivation. It allows respondents to ask in-depth questions about their experience. In a business market, it helps you understand how your customers make decisions. The intent is to understand them at their level and make related changes in your setup. The researcher must ask generic and precise questions that have a clear purpose.
Consider the below examples of qualitative survey questions. It can be useful in recording data and writing qualitative research assignments.
- Why did you buy this skin care product?
- What is the overall narrative of this brand?
- How do you feel after buying this product?
- What sets this brand apart from others?
- How will this product fulfil your needs?
- What are the things that you expect from this brand to grant you?
9. Action Research
This method involves collaboration and empowerment of the participants. It is mostly appropriate for marginalised groups where there is no flexibility.
The primary characteristics of the action research that can be quoted in your qualitative research assignment include,
- It is action-oriented, and participants are actively involved in the research.
- There is a collaborative process between participants and researchers.
- The nature of action research is flexible to the changing situation.
However, the survey also accompanies some of the limitations, including,
- The researcher can misinterpret the open-ended questions.
- The data ownership between the researcher and participants needs to be negotiated.
- The ethical considerations must be kept.
- It is not considered a scientific method as it is fluid in data collection. Consequently, it may not attract the finding.
What is the difference between quantitative and qualitative research?
Both research types share the common aim of knowledge acquisition. In quantitative research, the use of numbers and objective measures is used. It seeks answers to questions like when and where.
On the other hand, in qualitative research, the researcher is concerned with subjective phenomena. Such data can’t be numerically measured. For example, you might conduct a survey to analyse how different people experience grief.
What are the 4 types of qualitative research?
There are various types of qualitative research. It may include,
● Phenomenological studies:
It examines the human experience via description provided by the people involved. These are the lived experiences of the people. It is usually used in research areas where little knowledge is known.
● Ethnographic studies:
It involves the analysis of data about cultural groups. In such analysis, the researcher mostly lives with different communities and becomes part of their culture to provide solid interpretations.
● Grounded theory studies:
In this qualitative approach, the researcher collects and analyses the data. Later on, a theory is developed that is grounded in the data. It used both inductive and deductive approaches for theory development.
● Historical studies:
It is concerned with the location, identification, evaluation, and synthesis of data from the past. These researchers are not concerned with discovering past events but with relating these events to the present happenings.
The Research Gate provides a flow chart illustrating various qualitative research methods.
What are The 7 characteristics of qualitative research?
The following are some of the distinct features of qualitative research. You can write about them in your qualitative research assignment, as they are collected from reliable sources.
- It can even capture the changing attitude within the target group.
- It is beyond the limitations associated with quantitative research
- It explains something that numbers alone can’t describe.
- It is a flexible approach to improve the outcomes.
- A researcher is not supposed to become more speculative about the results.
- This approach is more targeted.
- It keeps the cost of data collection down.
What are the advantages and disadvantages of qualitative research?
The pros of qualitative research can’t be denied. However, some cons are also associated with this research.
- Explore attitudes and behaviours in depth.
- It encourages discussions for better results.
- Generate descriptive data that can formulate new theories.
- The small sample size can be a problem.
- Bias in the sample collection.
- Lack of privacy if you are covering a sensitive topic.
Qualitative research assignment examples
The Afe Babalola University ePortal provides an example of a qualitative assignment. Here is the description of quality questions and related answers. You can get an idea about how to handle your quality research assignment project with this sample.
The questions asked in the paper are displayed below.
The Slide Team presents a template for further compressing other details, such as the qualitative research assignment template. You can use it to make your presentation look professional.
Writing a qualitative research assignment is crucial, especially if you want to engage in research activities for your master’s thesis. Most researchers choose this method because of the associated credibility and reliability of the results. In the above guide, we have discussed some of the prominent features of this method. All of the given data can help you in writing your assignments. We have discussed the benefits of each methodology and a brief account of how you can carry it.
However, even after going through this whole guideline, if the concepts of the Qualitative Research methods assignment seem ambiguous and you think you can’t write a good project, then ask professional to “ write my assignment .” These experts can consult the best sources for the data collection of your project. Consequently, they will deliver you the winning document that can stand out among other write-ups.
Skip navigation
- Log in to UX Certification
World Leaders in Research-Based User Experience
Planning research with generative ai.

April 5, 2024 2024-04-05
- Email article
- Share on LinkedIn
- Share on Twitter
AI chatbots (like ChatGPT, Google’s Gemini, and Microsoft Copilot) can support UX researchers of all experience levels in planning their research.
In This Article:
What is a research plan, using ai chatbots to write a research plan.
Good research always starts with a plan.
A research plan is a document that outlines the research objectives and how the research will be executed.
Research plans should include:
- The research goals or questions that the research is hoping to achieve or answer
- The method to be used and a description of how it will be carried out
- The tasks or questions that will be given to study participants
- The profile of the target participants
- The screener questionnaire used to recruit participants
Creating a research plan can be time-consuming. Even with a good template, a researcher must generate research questions, select the appropriate method(s), decide how to run sessions, and often create study collateral (like screeners and tasks) from scratch. The good news is that AI can help with many, if not all, of these tasks!
It can be tempting to just ask an AI tool to give you a research plan for a project. Don’t do that.
❌ Bad Prompt : Generate a research plan for a usability test of a food-delivery app.
This kind of request results in a generic, template-like response, partly because AI lacks the context to propose a complete research plan and partly because of how the model has been trained.
To construct a useful research plan, deconstruct the plan into parts and have the AI chatbot tackle each part individually. You can assemble responses in a final research plan.
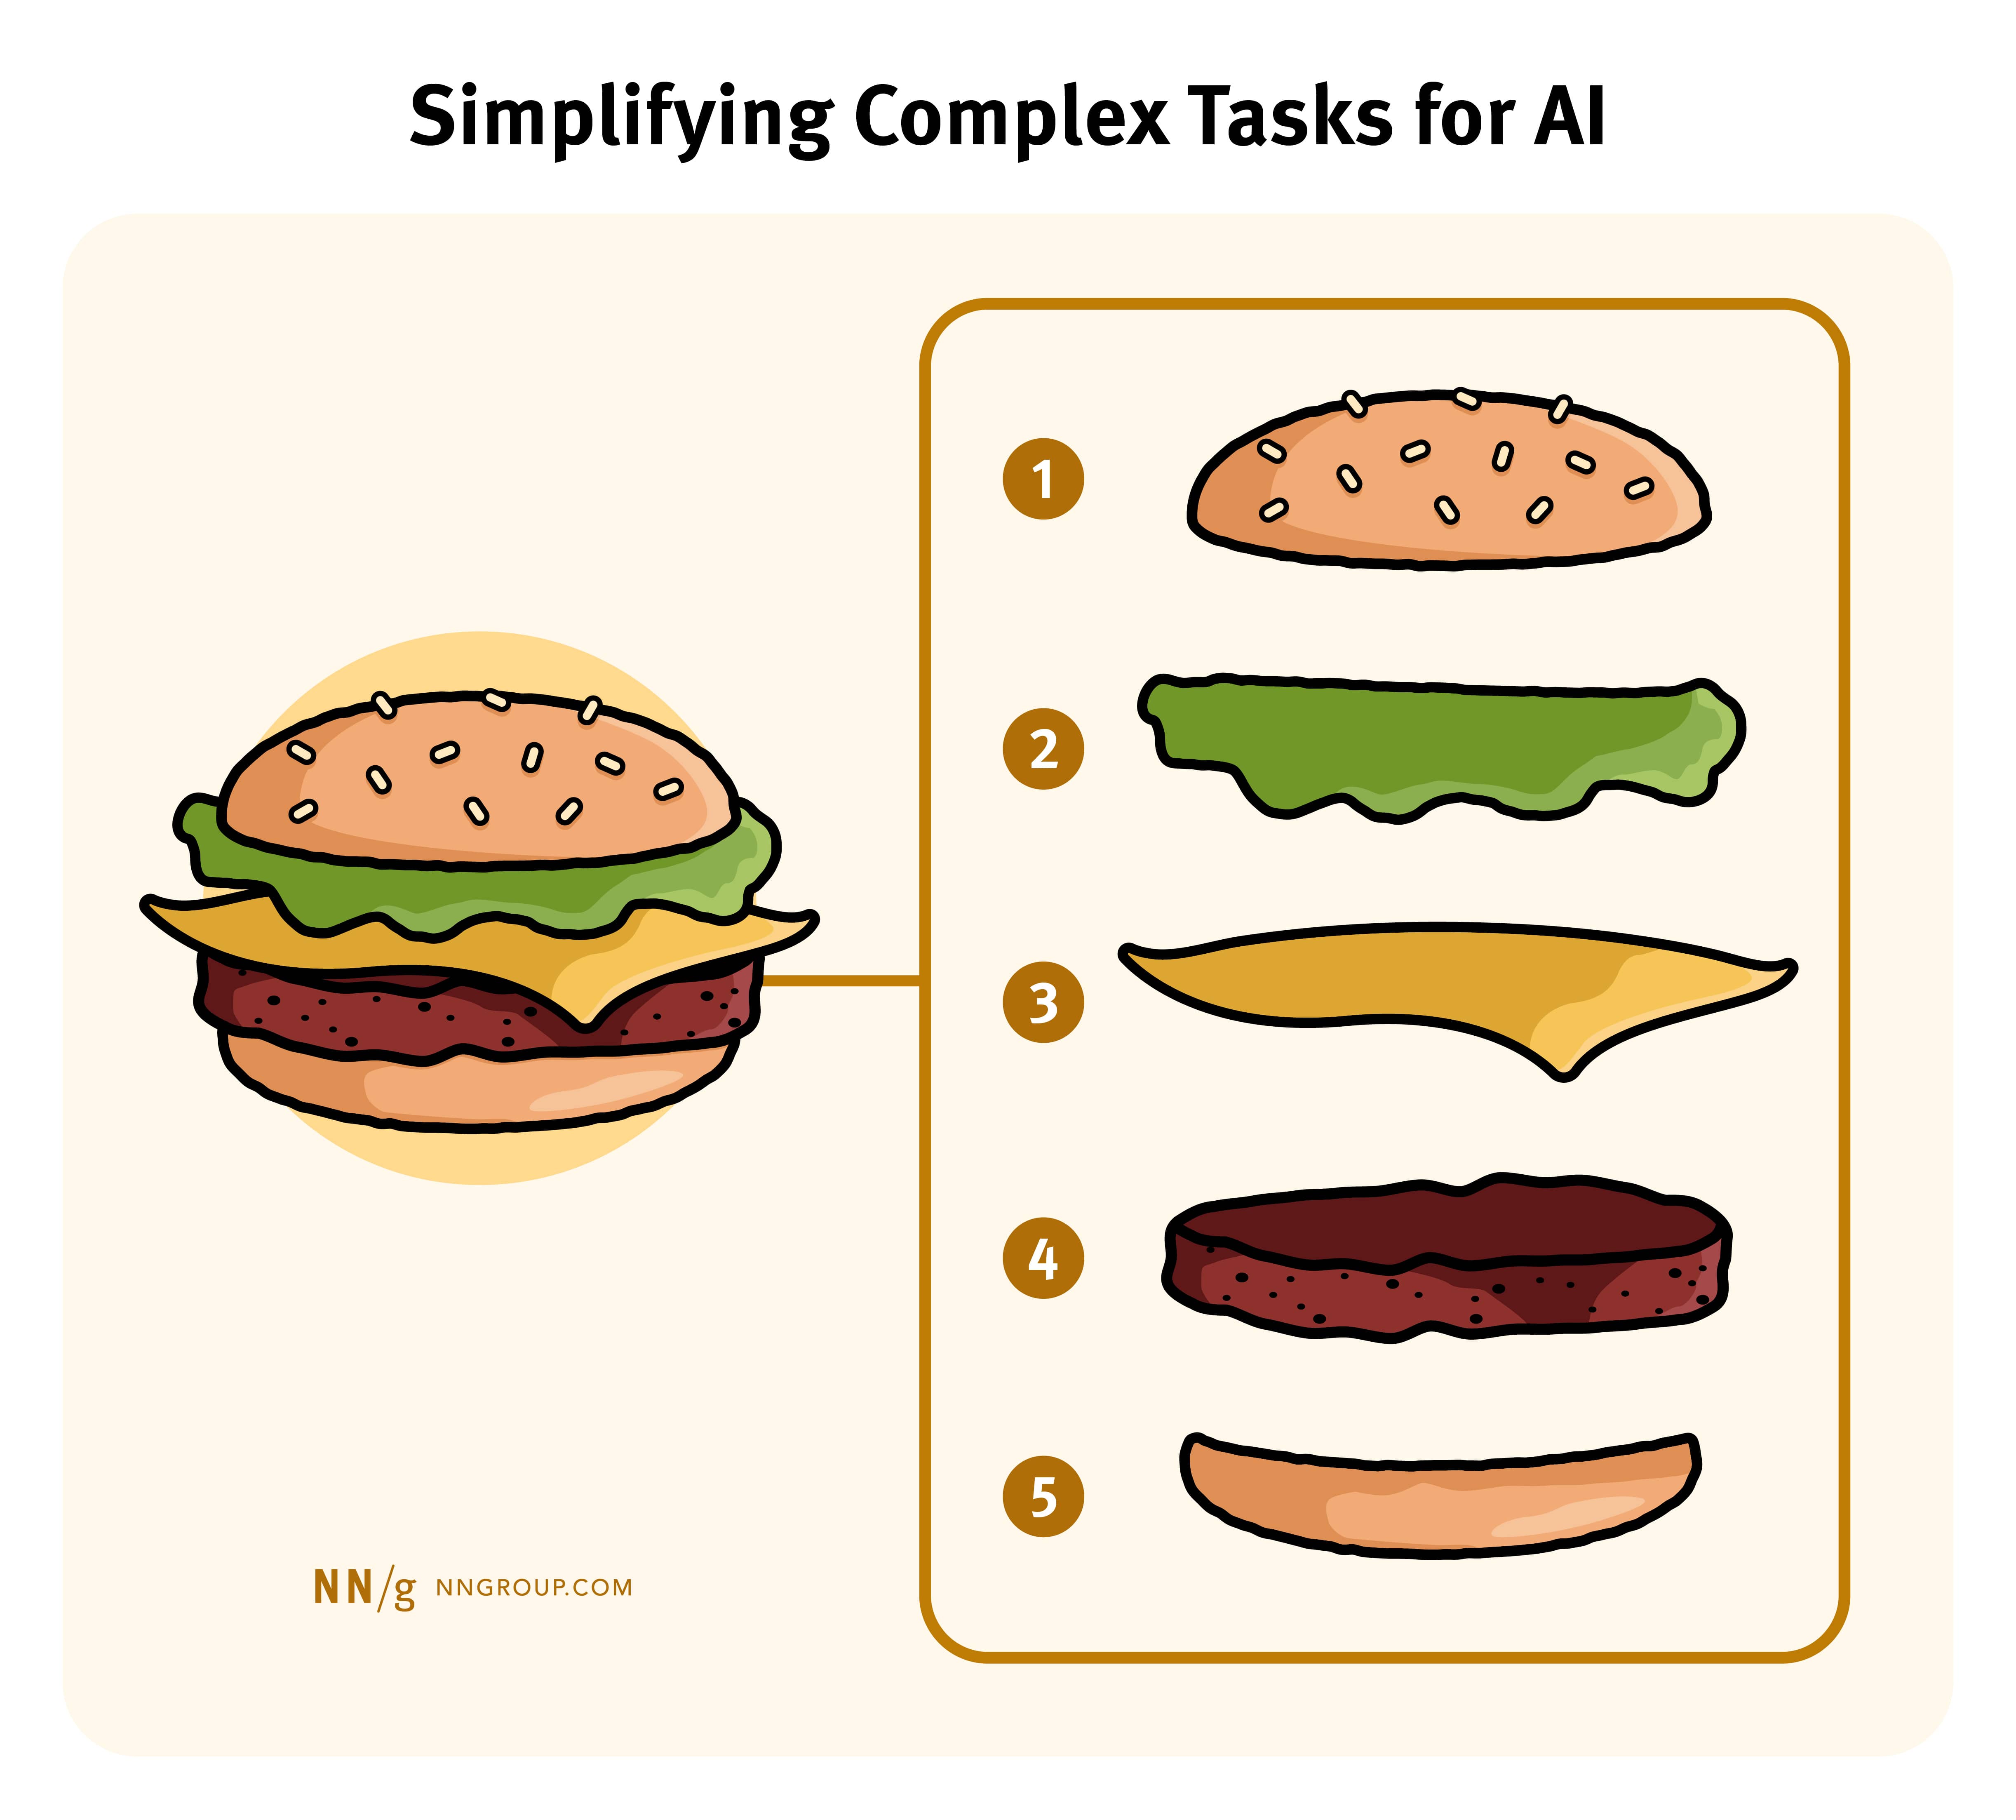
Don’t expect the AI to ask you the right questions in order to get a comprehensive outcome. View the AI tool as a UX assistant , not as a UX mentor. You need to feed into the AI all the steps and details you want it to consider.
Follow the steps below for the best results.
Step 1: Provide Context
Imagine asking an experienced colleague for recommendations on what research study to run without giving them any context on what project you’re working on and what you’re trying to achieve. They would probably say, "It depends on what you’re trying to learn.” Conversing with AI presents no exception.
Start your conversation with enough context , especially if the AI tool does not already have this information stored about you or your current project. ( ChatGPT 4 allows users to store context for each new conversation.)
The contextual information you share should include who you work for, the scope of your project, and what you’re looking to achieve. Remember that some AI tools may use your conversations to train their models, so share only information you would be comfortable with being in the open domain.
Prompt Template: I work for [type or organization] . My company provides [what kind of product, service, or experience] . I need to run a user-research study to learn [something about users or a problem] .
Step 2: Generate Research Questions
After providing the AI tool with context, ask it to suggest specific research questions for the study. Here’s an example from a recent study on research repositories that I conducted for NN/g.
Prompt Example: I will run a research study and report on how UX practitioners across different organizations set up and use research repositories. Please generate 10 research questions that would be suitable for this sort of study.
It’s a good idea to ask generative AI tools for more options or ideas than you think you’ll need, because some will not be a good fit.
Microsoft Copilot responded to the prompt above with the 10 research questions below.
10 Research questions generated by Microsoft Copilot
Who are the primary users of the research repository within different organizations? What motivates users to engage with the research repository? How do different teams (design, product, sales, marketing) access and benefit from the research repository? What challenges do practitioners face when contributing to or retrieving information from the repository? What types of research artifacts (reports, raw data, templates) are most commonly stored in the repository? How do organizations structure their research repositories? What tools and templates are commonly used to facilitate research repository management? How do practitioners ensure the quality and accuracy of information in the repository? What impact does the research repository have on decision-making and project outcomes? What strategies can organizations implement to encourage widespread adoption and active participation in the research repository?
To broaden your pool of research questions, ask for further research questions or provide the same prompt in a new session. Repeat this process as many times as you need to generate a list that feels exhaustive of what you’d like to learn.
Some of the research questions Copilot generated for me were appropriate, and others were not. As a result, I had AI generate more research questions to choose from.
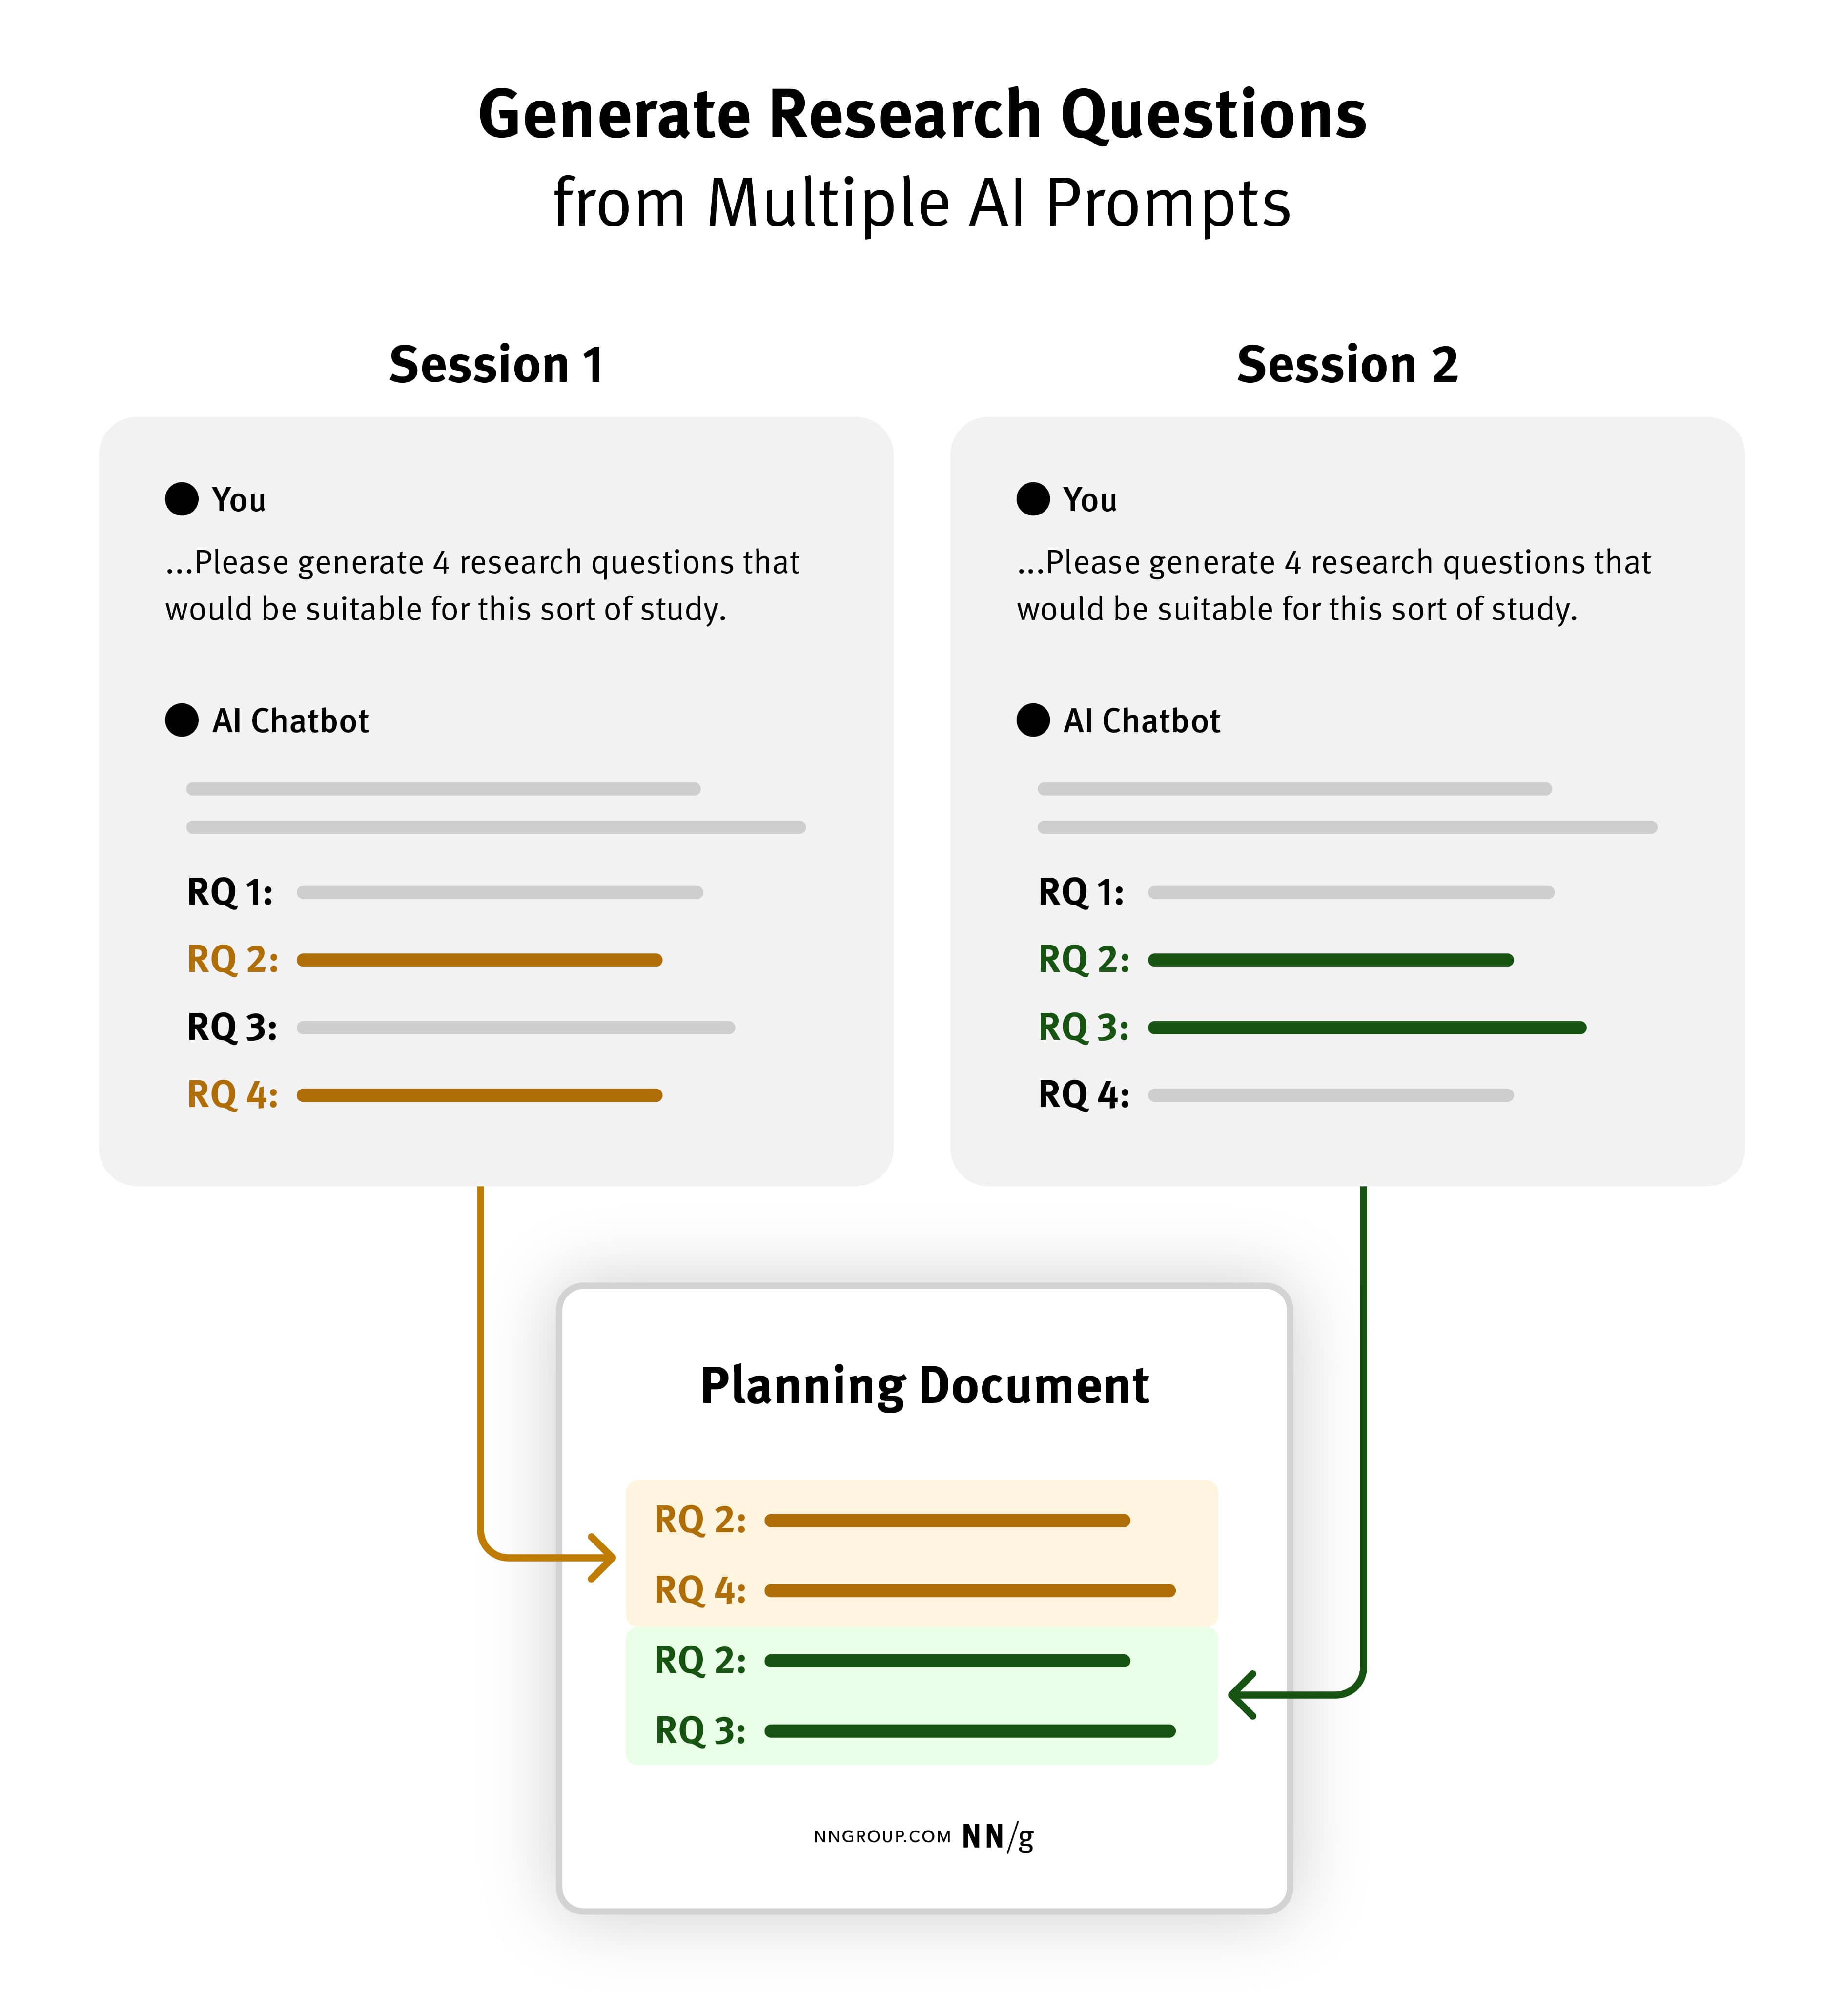
Unfortunately, most AI chatbots don’t offer an easy way to dismiss suggestions or combine specific responses and work from only these (a behavior called apple-picking ).
Pulling in generated research questions into an offline document (like a FigJam or Google Doc) allows you to easily group items, remove duplicates, or reword suggested research questions.
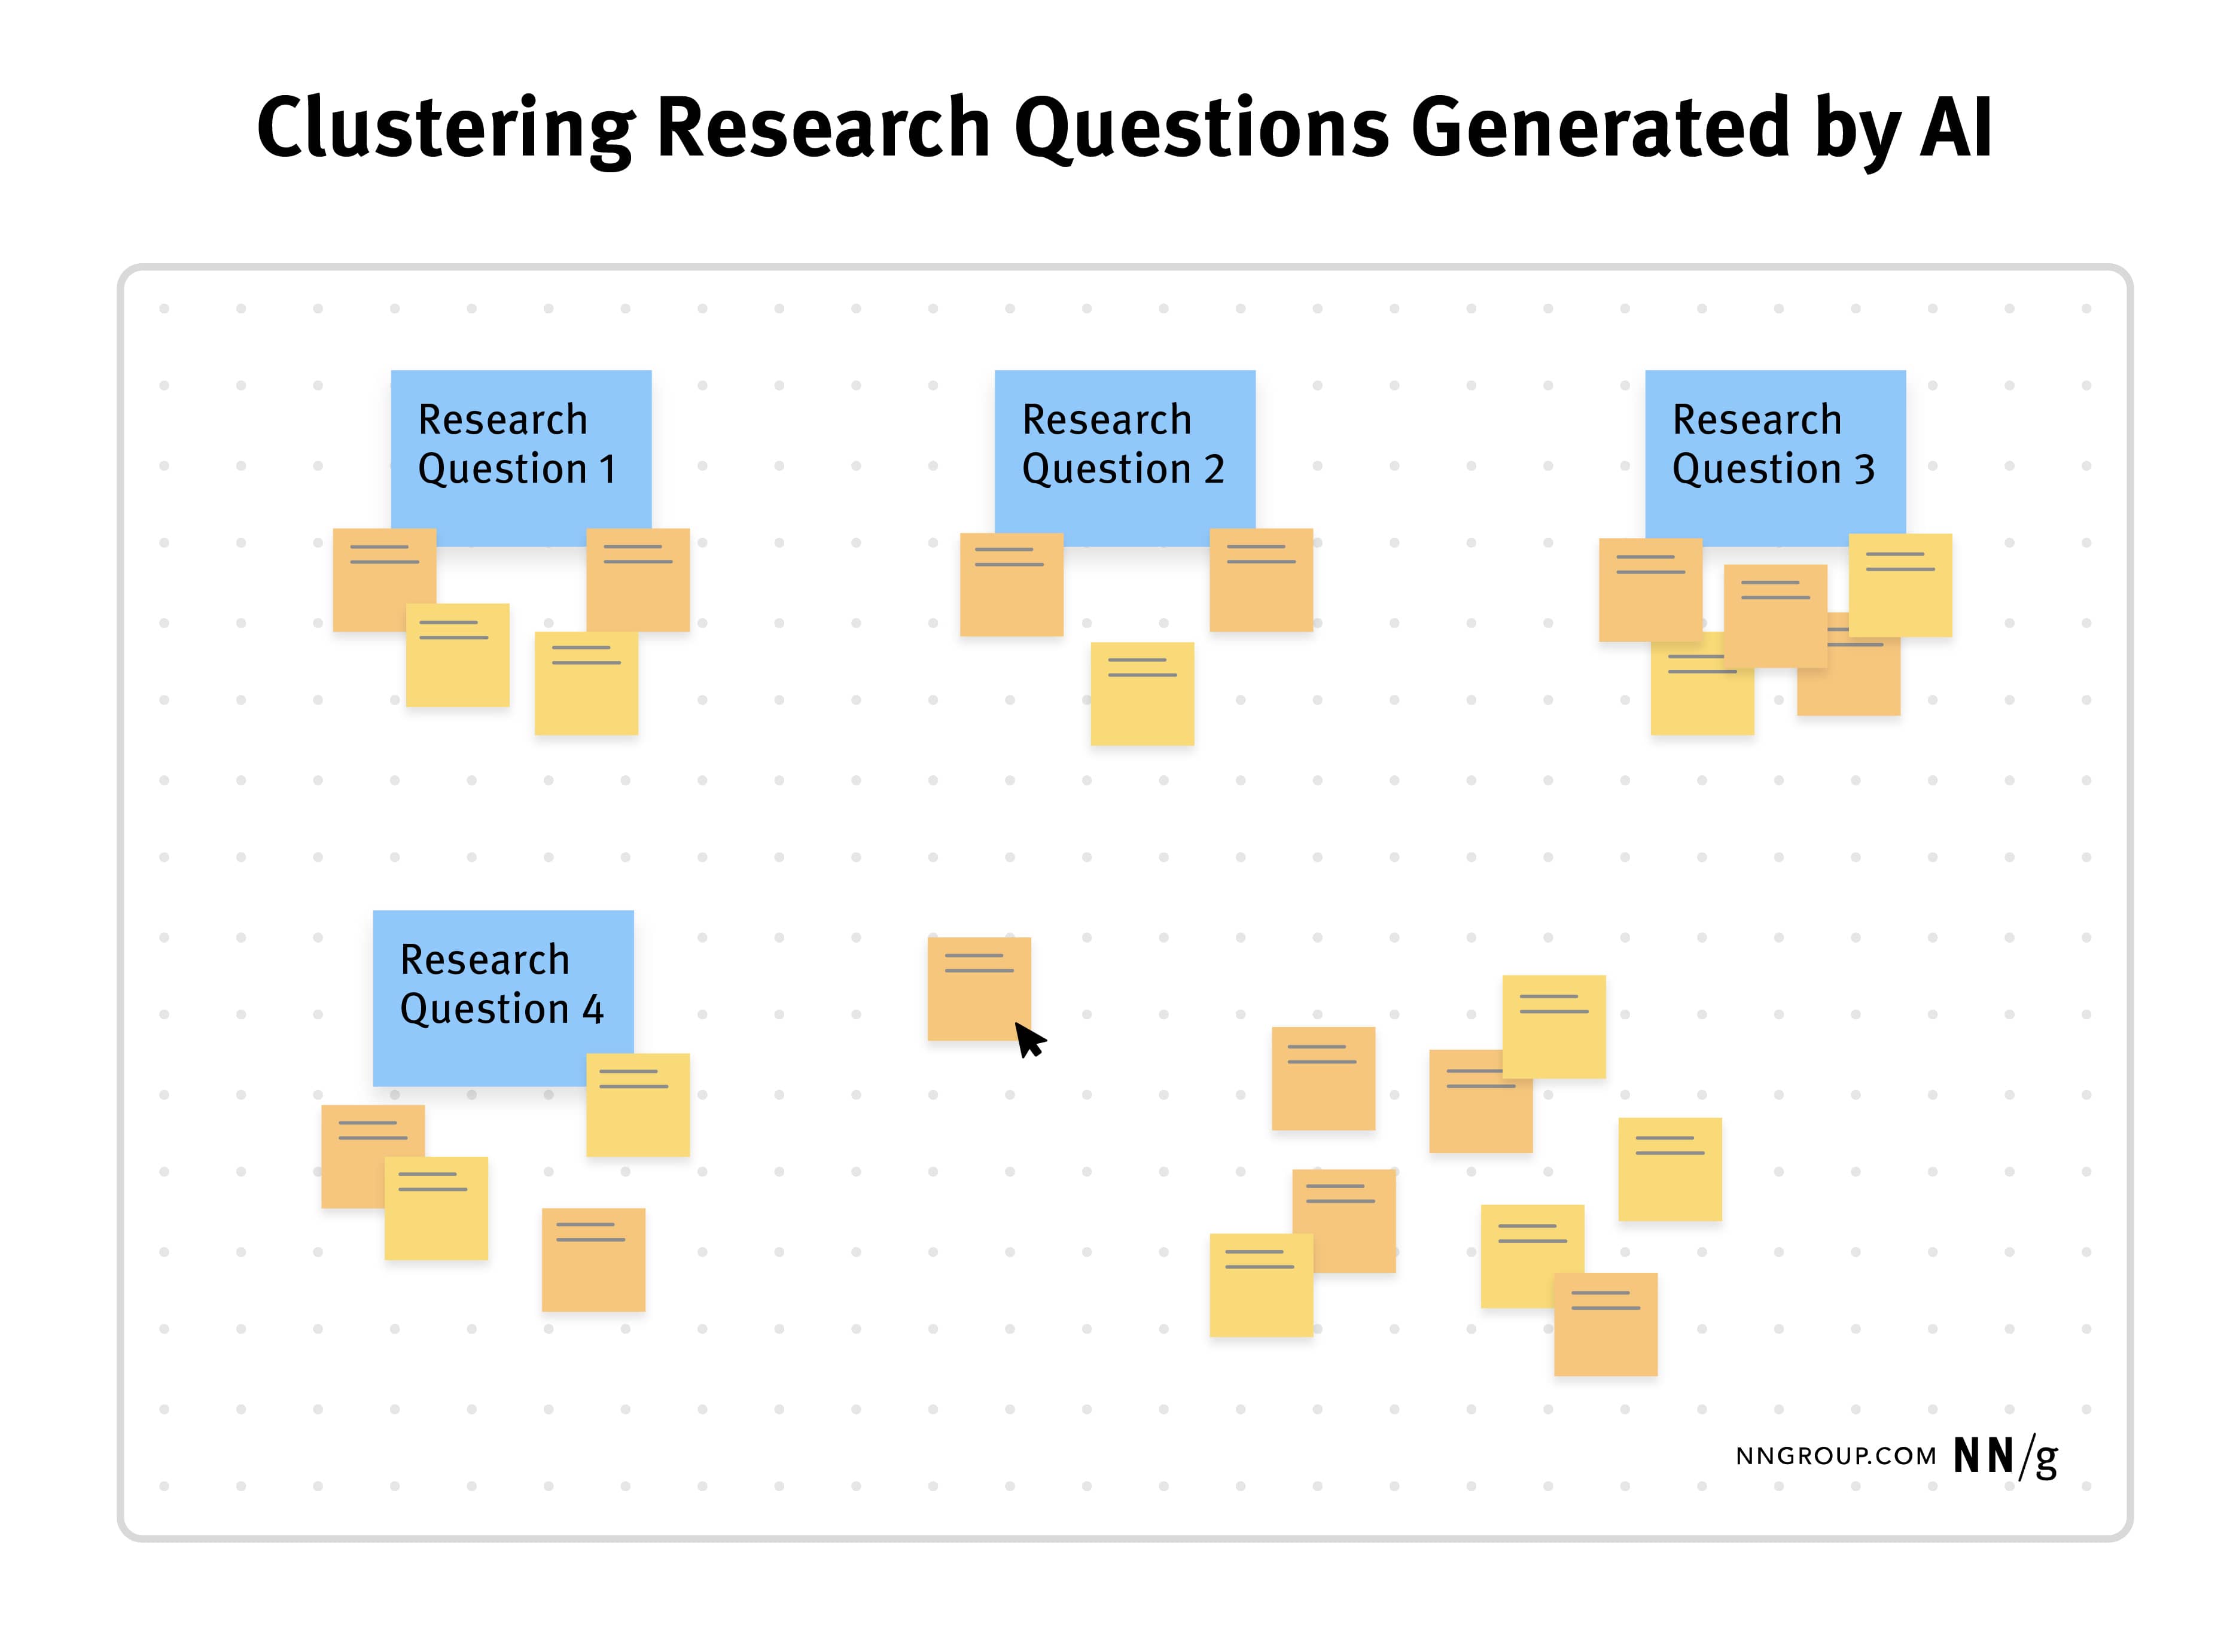
Begin a new chat session with your selected and refined set of research questions, so that the unwanted research questions are removed from the chat history.
Step 3: Request Methods
After sharing the context and your chosen research questions, ask the AI tool to identify suitable research methods.
Example Prompt : What study would you suggest to answer these research questions? Please be specific; cite which research questions would be answered by which research method if you suggest multiple methods.
Generative-AI advice is not always good advice. Often, these tools will suggest various methods and suggest you triangulate data from multiple sources. This approach is not always needed. Also, not all methods will be practical or the best fit for your study. Additionally, AI may suggest interviews and focus groups even for research questions better suited to a behavioral research method .
Ask AI chatbots to tell you which research methods would be suited to which research question and why. We also recommend doing some further reading on your own about any methods that are unfamiliar to you.
In response to the prompt above (and given my chosen research questions), ChatGPT recommended a survey, interviews with select UX practitioners, and case studies. These were all my chosen methods, so AI had done well here!
Step 4: Request Inclusion Criteria
AI can create inclusion criteria — a necessary component of your research plan. Do this step only after generating research questions and methods since these will inform who should participate in the research study.
Inclusion criteria (or recruitment criteria) are specific characteristics of the target population that need to be represented in your sample.
Start with inclusion criteria before asking the AI to help you write a screening questionnaire ; AI can only craft an appropriate screener after it “knows” who you’re looking to recruit.
Example Prompt: So that I recruit the right people for my interviews, help me create some inclusion criteria. What characteristics or behaviors should I recruit for?
Step 5: Request Help with Screeners, Interview Questions, and Tasks
Finally, ask the AI to put together:
- Interview questions or an interview guide (if conducting interviews)
- Tasks for a usability test
- Diary-study prompts (if relevant)
- Recruitment confirmation emails or other communication messages.
Unfortunately, there are a lot of bad examples of the above on the web. Conversational AI has been trained on all this data. Therefore, don’t be surprised if it produces poor study collateral on its first attempt! This is a major risk area for new researchers.
One way to mitigate this danger is to give the AI tool advice when crafting any of these outputs . Think of AI as a new research assistant who can learn extremely quickly.
Common mistakes that AI tools make include:
- Using words that appear in the interface in task instructions (priming)
- Creating task instructions that ask users to imagine they are someone that they are not
- Not including a goal or a call to action in the task instruction
- Not including distractor options in screening questionnaires
- Using overenthusiastic marketing language in recruitment materials
It’s not surprising that AI makes these mistakes since UX practitioners also make them!
To improve outputs, feed the AI essential tips, such as:
- When crafting tasks: Do not use the name of words or link labels in the task instruction. Find a natural-language equivalent to explain what the participant should do . (You can ask AI to “read” a website or an image.)
- When crafting recruitment materials: Use neutral and concise language in the recruitment email. Avoid using overly enthusiastic marketing language.
- When crafting a screener: Include multiple-choice questions and answer options that might disguise what the study is about and who I am looking to recruit.
Additionally, when possible, feed the AI with good examples of screener questionnaires, tasks, or interview questions, so it can follow their format or style.
Even with this advice, AI can still make mistakes. If you’re doubting its answers, check primary sources or speak with an experienced researcher for old-fashioned human guidance.
If you have ChatGPT’s Plus Plan, you can use our GPT for planning your research.
With the proper context, examples, and advice, AI tools, like ChatGPT and Microsoft Copilot, can craft helpful research questions, tasks, interview questions, and other study collateral far more quickly than you could if you started from scratch.
Research leads and ResearchOps personnel can support junior researchers and PWDRs (People Who Do Research) by providing examples and advice that can be fed to AI agents. Experienced researchers can benefit from using AI to speed up their research-planning process and obtain further inspiration.
Free Downloads
Related courses, practical ai for ux professionals.
Leverage artificial intelligence tools to enhance your UX work and save valuable time
Interaction
ResearchOps: Scaling User Research
Orchestrate and optimize research to amplify its impact
Analytics and User Experience
Study your users’ real-life behaviors and make data-informed design decisions
Related Topics
- Artificial Intelligence Artificial Intelligence
- Research Methods
Learn More:

AI on Intranets: 5 Valuable Features
Anna Kaley · 3 min

ELIZA Effect: Why We Fall in Love With AI
Caleb Sponheim · 3 min

Is Aggressive Marketing Influencing the UX of AI Agents?
Jakob Nielsen · 2 min
Related Articles:
Generative UI and Outcome-Oriented Design
Kate Moran and Sarah Gibbons · 6 min
AI Chat Is Not (Always) the Answer
Sarah Gibbons and Kate Moran · 5 min
The UX of AI: Lessons from Perplexity
Kate Moran · 5 min
Response Outlining with Generative-AI Chatbots
Tarun Mugunthan · 3 min
Sycophancy in Generative-AI Chatbots
Caleb Sponheim · 4 min
Prompt Structure in Conversations with Generative AI
Raluca Budiu, Feifei Liu, Amy Zhang, and Emma Cionca · 16 min
Thank you for visiting nature.com. You are using a browser version with limited support for CSS. To obtain the best experience, we recommend you use a more up to date browser (or turn off compatibility mode in Internet Explorer). In the meantime, to ensure continued support, we are displaying the site without styles and JavaScript.
- View all journals
- My Account Login
- Explore content
- About the journal
- Publish with us
- Sign up for alerts
- Open access
- Published: 26 March 2024
Predicting and improving complex beer flavor through machine learning
- Michiel Schreurs ORCID: orcid.org/0000-0002-9449-5619 1 , 2 , 3 na1 ,
- Supinya Piampongsant 1 , 2 , 3 na1 ,
- Miguel Roncoroni ORCID: orcid.org/0000-0001-7461-1427 1 , 2 , 3 na1 ,
- Lloyd Cool ORCID: orcid.org/0000-0001-9936-3124 1 , 2 , 3 , 4 ,
- Beatriz Herrera-Malaver ORCID: orcid.org/0000-0002-5096-9974 1 , 2 , 3 ,
- Christophe Vanderaa ORCID: orcid.org/0000-0001-7443-5427 4 ,
- Florian A. Theßeling 1 , 2 , 3 ,
- Łukasz Kreft ORCID: orcid.org/0000-0001-7620-4657 5 ,
- Alexander Botzki ORCID: orcid.org/0000-0001-6691-4233 5 ,
- Philippe Malcorps 6 ,
- Luk Daenen 6 ,
- Tom Wenseleers ORCID: orcid.org/0000-0002-1434-861X 4 &
- Kevin J. Verstrepen ORCID: orcid.org/0000-0002-3077-6219 1 , 2 , 3
Nature Communications volume 15 , Article number: 2368 ( 2024 ) Cite this article
50k Accesses
850 Altmetric
Metrics details
- Chemical engineering
- Gas chromatography
- Machine learning
- Metabolomics
- Taste receptors
The perception and appreciation of food flavor depends on many interacting chemical compounds and external factors, and therefore proves challenging to understand and predict. Here, we combine extensive chemical and sensory analyses of 250 different beers to train machine learning models that allow predicting flavor and consumer appreciation. For each beer, we measure over 200 chemical properties, perform quantitative descriptive sensory analysis with a trained tasting panel and map data from over 180,000 consumer reviews to train 10 different machine learning models. The best-performing algorithm, Gradient Boosting, yields models that significantly outperform predictions based on conventional statistics and accurately predict complex food features and consumer appreciation from chemical profiles. Model dissection allows identifying specific and unexpected compounds as drivers of beer flavor and appreciation. Adding these compounds results in variants of commercial alcoholic and non-alcoholic beers with improved consumer appreciation. Together, our study reveals how big data and machine learning uncover complex links between food chemistry, flavor and consumer perception, and lays the foundation to develop novel, tailored foods with superior flavors.
BitterSweet: Building machine learning models for predicting the bitter and sweet taste of small molecules
Rudraksh Tuwani, Somin Wadhwa & Ganesh Bagler

Sensory lexicon and aroma volatiles analysis of brewing malt
Xiaoxia Su, Miao Yu, … Tianyi Du

Predicting odor from molecular structure: a multi-label classification approach
Kushagra Saini & Venkatnarayan Ramanathan
Introduction
Predicting and understanding food perception and appreciation is one of the major challenges in food science. Accurate modeling of food flavor and appreciation could yield important opportunities for both producers and consumers, including quality control, product fingerprinting, counterfeit detection, spoilage detection, and the development of new products and product combinations (food pairing) 1 , 2 , 3 , 4 , 5 , 6 . Accurate models for flavor and consumer appreciation would contribute greatly to our scientific understanding of how humans perceive and appreciate flavor. Moreover, accurate predictive models would also facilitate and standardize existing food assessment methods and could supplement or replace assessments by trained and consumer tasting panels, which are variable, expensive and time-consuming 7 , 8 , 9 . Lastly, apart from providing objective, quantitative, accurate and contextual information that can help producers, models can also guide consumers in understanding their personal preferences 10 .
Despite the myriad of applications, predicting food flavor and appreciation from its chemical properties remains a largely elusive goal in sensory science, especially for complex food and beverages 11 , 12 . A key obstacle is the immense number of flavor-active chemicals underlying food flavor. Flavor compounds can vary widely in chemical structure and concentration, making them technically challenging and labor-intensive to quantify, even in the face of innovations in metabolomics, such as non-targeted metabolic fingerprinting 13 , 14 . Moreover, sensory analysis is perhaps even more complicated. Flavor perception is highly complex, resulting from hundreds of different molecules interacting at the physiochemical and sensorial level. Sensory perception is often non-linear, characterized by complex and concentration-dependent synergistic and antagonistic effects 15 , 16 , 17 , 18 , 19 , 20 , 21 that are further convoluted by the genetics, environment, culture and psychology of consumers 22 , 23 , 24 . Perceived flavor is therefore difficult to measure, with problems of sensitivity, accuracy, and reproducibility that can only be resolved by gathering sufficiently large datasets 25 . Trained tasting panels are considered the prime source of quality sensory data, but require meticulous training, are low throughput and high cost. Public databases containing consumer reviews of food products could provide a valuable alternative, especially for studying appreciation scores, which do not require formal training 25 . Public databases offer the advantage of amassing large amounts of data, increasing the statistical power to identify potential drivers of appreciation. However, public datasets suffer from biases, including a bias in the volunteers that contribute to the database, as well as confounding factors such as price, cult status and psychological conformity towards previous ratings of the product.
Classical multivariate statistics and machine learning methods have been used to predict flavor of specific compounds by, for example, linking structural properties of a compound to its potential biological activities or linking concentrations of specific compounds to sensory profiles 1 , 26 . Importantly, most previous studies focused on predicting organoleptic properties of single compounds (often based on their chemical structure) 27 , 28 , 29 , 30 , 31 , 32 , 33 , thus ignoring the fact that these compounds are present in a complex matrix in food or beverages and excluding complex interactions between compounds. Moreover, the classical statistics commonly used in sensory science 34 , 35 , 36 , 37 , 38 , 39 require a large sample size and sufficient variance amongst predictors to create accurate models. They are not fit for studying an extensive set of hundreds of interacting flavor compounds, since they are sensitive to outliers, have a high tendency to overfit and are less suited for non-linear and discontinuous relationships 40 .
In this study, we combine extensive chemical analyses and sensory data of a set of different commercial beers with machine learning approaches to develop models that predict taste, smell, mouthfeel and appreciation from compound concentrations. Beer is particularly suited to model the relationship between chemistry, flavor and appreciation. First, beer is a complex product, consisting of thousands of flavor compounds that partake in complex sensory interactions 41 , 42 , 43 . This chemical diversity arises from the raw materials (malt, yeast, hops, water and spices) and biochemical conversions during the brewing process (kilning, mashing, boiling, fermentation, maturation and aging) 44 , 45 . Second, the advent of the internet saw beer consumers embrace online review platforms, such as RateBeer (ZX Ventures, Anheuser-Busch InBev SA/NV) and BeerAdvocate (Next Glass, inc.). In this way, the beer community provides massive data sets of beer flavor and appreciation scores, creating extraordinarily large sensory databases to complement the analyses of our professional sensory panel. Specifically, we characterize over 200 chemical properties of 250 commercial beers, spread across 22 beer styles, and link these to the descriptive sensory profiling data of a 16-person in-house trained tasting panel and data acquired from over 180,000 public consumer reviews. These unique and extensive datasets enable us to train a suite of machine learning models to predict flavor and appreciation from a beer’s chemical profile. Dissection of the best-performing models allows us to pinpoint specific compounds as potential drivers of beer flavor and appreciation. Follow-up experiments confirm the importance of these compounds and ultimately allow us to significantly improve the flavor and appreciation of selected commercial beers. Together, our study represents a significant step towards understanding complex flavors and reinforces the value of machine learning to develop and refine complex foods. In this way, it represents a stepping stone for further computer-aided food engineering applications 46 .
To generate a comprehensive dataset on beer flavor, we selected 250 commercial Belgian beers across 22 different beer styles (Supplementary Fig. S1 ). Beers with ≤ 4.2% alcohol by volume (ABV) were classified as non-alcoholic and low-alcoholic. Blonds and Tripels constitute a significant portion of the dataset (12.4% and 11.2%, respectively) reflecting their presence on the Belgian beer market and the heterogeneity of beers within these styles. By contrast, lager beers are less diverse and dominated by a handful of brands. Rare styles such as Brut or Faro make up only a small fraction of the dataset (2% and 1%, respectively) because fewer of these beers are produced and because they are dominated by distinct characteristics in terms of flavor and chemical composition.
Extensive analysis identifies relationships between chemical compounds in beer
For each beer, we measured 226 different chemical properties, including common brewing parameters such as alcohol content, iso-alpha acids, pH, sugar concentration 47 , and over 200 flavor compounds (Methods, Supplementary Table S1 ). A large portion (37.2%) are terpenoids arising from hopping, responsible for herbal and fruity flavors 16 , 48 . A second major category are yeast metabolites, such as esters and alcohols, that result in fruity and solvent notes 48 , 49 , 50 . Other measured compounds are primarily derived from malt, or other microbes such as non- Saccharomyces yeasts and bacteria (‘wild flora’). Compounds that arise from spices or staling are labeled under ‘Others’. Five attributes (caloric value, total acids and total ester, hop aroma and sulfur compounds) are calculated from multiple individually measured compounds.
As a first step in identifying relationships between chemical properties, we determined correlations between the concentrations of the compounds (Fig. 1 , upper panel, Supplementary Data 1 and 2 , and Supplementary Fig. S2 . For the sake of clarity, only a subset of the measured compounds is shown in Fig. 1 ). Compounds of the same origin typically show a positive correlation, while absence of correlation hints at parameters varying independently. For example, the hop aroma compounds citronellol, and alpha-terpineol show moderate correlations with each other (Spearman’s rho=0.39 and 0.57), but not with the bittering hop component iso-alpha acids (Spearman’s rho=0.16 and −0.07). This illustrates how brewers can independently modify hop aroma and bitterness by selecting hop varieties and dosage time. If hops are added early in the boiling phase, chemical conversions increase bitterness while aromas evaporate, conversely, late addition of hops preserves aroma but limits bitterness 51 . Similarly, hop-derived iso-alpha acids show a strong anti-correlation with lactic acid and acetic acid, likely reflecting growth inhibition of lactic acid and acetic acid bacteria, or the consequent use of fewer hops in sour beer styles, such as West Flanders ales and Fruit beers, that rely on these bacteria for their distinct flavors 52 . Finally, yeast-derived esters (ethyl acetate, ethyl decanoate, ethyl hexanoate, ethyl octanoate) and alcohols (ethanol, isoamyl alcohol, isobutanol, and glycerol), correlate with Spearman coefficients above 0.5, suggesting that these secondary metabolites are correlated with the yeast genetic background and/or fermentation parameters and may be difficult to influence individually, although the choice of yeast strain may offer some control 53 .

Spearman rank correlations are shown. Descriptors are grouped according to their origin (malt (blue), hops (green), yeast (red), wild flora (yellow), Others (black)), and sensory aspect (aroma, taste, palate, and overall appreciation). Please note that for the chemical compounds, for the sake of clarity, only a subset of the total number of measured compounds is shown, with an emphasis on the key compounds for each source. For more details, see the main text and Methods section. Chemical data can be found in Supplementary Data 1 , correlations between all chemical compounds are depicted in Supplementary Fig. S2 and correlation values can be found in Supplementary Data 2 . See Supplementary Data 4 for sensory panel assessments and Supplementary Data 5 for correlation values between all sensory descriptors.
Interestingly, different beer styles show distinct patterns for some flavor compounds (Supplementary Fig. S3 ). These observations agree with expectations for key beer styles, and serve as a control for our measurements. For instance, Stouts generally show high values for color (darker), while hoppy beers contain elevated levels of iso-alpha acids, compounds associated with bitter hop taste. Acetic and lactic acid are not prevalent in most beers, with notable exceptions such as Kriek, Lambic, Faro, West Flanders ales and Flanders Old Brown, which use acid-producing bacteria ( Lactobacillus and Pediococcus ) or unconventional yeast ( Brettanomyces ) 54 , 55 . Glycerol, ethanol and esters show similar distributions across all beer styles, reflecting their common origin as products of yeast metabolism during fermentation 45 , 53 . Finally, low/no-alcohol beers contain low concentrations of glycerol and esters. This is in line with the production process for most of the low/no-alcohol beers in our dataset, which are produced through limiting fermentation or by stripping away alcohol via evaporation or dialysis, with both methods having the unintended side-effect of reducing the amount of flavor compounds in the final beer 56 , 57 .
Besides expected associations, our data also reveals less trivial associations between beer styles and specific parameters. For example, geraniol and citronellol, two monoterpenoids responsible for citrus, floral and rose flavors and characteristic of Citra hops, are found in relatively high amounts in Christmas, Saison, and Brett/co-fermented beers, where they may originate from terpenoid-rich spices such as coriander seeds instead of hops 58 .
Tasting panel assessments reveal sensorial relationships in beer
To assess the sensory profile of each beer, a trained tasting panel evaluated each of the 250 beers for 50 sensory attributes, including different hop, malt and yeast flavors, off-flavors and spices. Panelists used a tasting sheet (Supplementary Data 3 ) to score the different attributes. Panel consistency was evaluated by repeating 12 samples across different sessions and performing ANOVA. In 95% of cases no significant difference was found across sessions ( p > 0.05), indicating good panel consistency (Supplementary Table S2 ).
Aroma and taste perception reported by the trained panel are often linked (Fig. 1 , bottom left panel and Supplementary Data 4 and 5 ), with high correlations between hops aroma and taste (Spearman’s rho=0.83). Bitter taste was found to correlate with hop aroma and taste in general (Spearman’s rho=0.80 and 0.69), and particularly with “grassy” noble hops (Spearman’s rho=0.75). Barnyard flavor, most often associated with sour beers, is identified together with stale hops (Spearman’s rho=0.97) that are used in these beers. Lactic and acetic acid, which often co-occur, are correlated (Spearman’s rho=0.66). Interestingly, sweetness and bitterness are anti-correlated (Spearman’s rho = −0.48), confirming the hypothesis that they mask each other 59 , 60 . Beer body is highly correlated with alcohol (Spearman’s rho = 0.79), and overall appreciation is found to correlate with multiple aspects that describe beer mouthfeel (alcohol, carbonation; Spearman’s rho= 0.32, 0.39), as well as with hop and ester aroma intensity (Spearman’s rho=0.39 and 0.35).
Similar to the chemical analyses, sensorial analyses confirmed typical features of specific beer styles (Supplementary Fig. S4 ). For example, sour beers (Faro, Flanders Old Brown, Fruit beer, Kriek, Lambic, West Flanders ale) were rated acidic, with flavors of both acetic and lactic acid. Hoppy beers were found to be bitter and showed hop-associated aromas like citrus and tropical fruit. Malt taste is most detected among scotch, stout/porters, and strong ales, while low/no-alcohol beers, which often have a reputation for being ‘worty’ (reminiscent of unfermented, sweet malt extract) appear in the middle. Unsurprisingly, hop aromas are most strongly detected among hoppy beers. Like its chemical counterpart (Supplementary Fig. S3 ), acidity shows a right-skewed distribution, with the most acidic beers being Krieks, Lambics, and West Flanders ales.
Tasting panel assessments of specific flavors correlate with chemical composition
We find that the concentrations of several chemical compounds strongly correlate with specific aroma or taste, as evaluated by the tasting panel (Fig. 2 , Supplementary Fig. S5 , Supplementary Data 6 ). In some cases, these correlations confirm expectations and serve as a useful control for data quality. For example, iso-alpha acids, the bittering compounds in hops, strongly correlate with bitterness (Spearman’s rho=0.68), while ethanol and glycerol correlate with tasters’ perceptions of alcohol and body, the mouthfeel sensation of fullness (Spearman’s rho=0.82/0.62 and 0.72/0.57 respectively) and darker color from roasted malts is a good indication of malt perception (Spearman’s rho=0.54).

Heatmap colors indicate Spearman’s Rho. Axes are organized according to sensory categories (aroma, taste, mouthfeel, overall), chemical categories and chemical sources in beer (malt (blue), hops (green), yeast (red), wild flora (yellow), Others (black)). See Supplementary Data 6 for all correlation values.
Interestingly, for some relationships between chemical compounds and perceived flavor, correlations are weaker than expected. For example, the rose-smelling phenethyl acetate only weakly correlates with floral aroma. This hints at more complex relationships and interactions between compounds and suggests a need for a more complex model than simple correlations. Lastly, we uncovered unexpected correlations. For instance, the esters ethyl decanoate and ethyl octanoate appear to correlate slightly with hop perception and bitterness, possibly due to their fruity flavor. Iron is anti-correlated with hop aromas and bitterness, most likely because it is also anti-correlated with iso-alpha acids. This could be a sign of metal chelation of hop acids 61 , given that our analyses measure unbound hop acids and total iron content, or could result from the higher iron content in dark and Fruit beers, which typically have less hoppy and bitter flavors 62 .
Public consumer reviews complement expert panel data
To complement and expand the sensory data of our trained tasting panel, we collected 180,000 reviews of our 250 beers from the online consumer review platform RateBeer. This provided numerical scores for beer appearance, aroma, taste, palate, overall quality as well as the average overall score.
Public datasets are known to suffer from biases, such as price, cult status and psychological conformity towards previous ratings of a product. For example, prices correlate with appreciation scores for these online consumer reviews (rho=0.49, Supplementary Fig. S6 ), but not for our trained tasting panel (rho=0.19). This suggests that prices affect consumer appreciation, which has been reported in wine 63 , while blind tastings are unaffected. Moreover, we observe that some beer styles, like lagers and non-alcoholic beers, generally receive lower scores, reflecting that online reviewers are mostly beer aficionados with a preference for specialty beers over lager beers. In general, we find a modest correlation between our trained panel’s overall appreciation score and the online consumer appreciation scores (Fig. 3 , rho=0.29). Apart from the aforementioned biases in the online datasets, serving temperature, sample freshness and surroundings, which are all tightly controlled during the tasting panel sessions, can vary tremendously across online consumers and can further contribute to (among others, appreciation) differences between the two categories of tasters. Importantly, in contrast to the overall appreciation scores, for many sensory aspects the results from the professional panel correlated well with results obtained from RateBeer reviews. Correlations were highest for features that are relatively easy to recognize even for untrained tasters, like bitterness, sweetness, alcohol and malt aroma (Fig. 3 and below).

RateBeer text mining results can be found in Supplementary Data 7 . Rho values shown are Spearman correlation values, with asterisks indicating significant correlations ( p < 0.05, two-sided). All p values were smaller than 0.001, except for Esters aroma (0.0553), Esters taste (0.3275), Esters aroma—banana (0.0019), Coriander (0.0508) and Diacetyl (0.0134).
Besides collecting consumer appreciation from these online reviews, we developed automated text analysis tools to gather additional data from review texts (Supplementary Data 7 ). Processing review texts on the RateBeer database yielded comparable results to the scores given by the trained panel for many common sensory aspects, including acidity, bitterness, sweetness, alcohol, malt, and hop tastes (Fig. 3 ). This is in line with what would be expected, since these attributes require less training for accurate assessment and are less influenced by environmental factors such as temperature, serving glass and odors in the environment. Consumer reviews also correlate well with our trained panel for 4-vinyl guaiacol, a compound associated with a very characteristic aroma. By contrast, correlations for more specific aromas like ester, coriander or diacetyl are underrepresented in the online reviews, underscoring the importance of using a trained tasting panel and standardized tasting sheets with explicit factors to be scored for evaluating specific aspects of a beer. Taken together, our results suggest that public reviews are trustworthy for some, but not all, flavor features and can complement or substitute taste panel data for these sensory aspects.
Models can predict beer sensory profiles from chemical data
The rich datasets of chemical analyses, tasting panel assessments and public reviews gathered in the first part of this study provided us with a unique opportunity to develop predictive models that link chemical data to sensorial features. Given the complexity of beer flavor, basic statistical tools such as correlations or linear regression may not always be the most suitable for making accurate predictions. Instead, we applied different machine learning models that can model both simple linear and complex interactive relationships. Specifically, we constructed a set of regression models to predict (a) trained panel scores for beer flavor and quality and (b) public reviews’ appreciation scores from beer chemical profiles. We trained and tested 10 different models (Methods), 3 linear regression-based models (simple linear regression with first-order interactions (LR), lasso regression with first-order interactions (Lasso), partial least squares regressor (PLSR)), 5 decision tree models (AdaBoost regressor (ABR), extra trees (ET), gradient boosting regressor (GBR), random forest (RF) and XGBoost regressor (XGBR)), 1 support vector regression (SVR), and 1 artificial neural network (ANN) model.
To compare the performance of our machine learning models, the dataset was randomly split into a training and test set, stratified by beer style. After a model was trained on data in the training set, its performance was evaluated on its ability to predict the test dataset obtained from multi-output models (based on the coefficient of determination, see Methods). Additionally, individual-attribute models were ranked per descriptor and the average rank was calculated, as proposed by Korneva et al. 64 . Importantly, both ways of evaluating the models’ performance agreed in general. Performance of the different models varied (Table 1 ). It should be noted that all models perform better at predicting RateBeer results than results from our trained tasting panel. One reason could be that sensory data is inherently variable, and this variability is averaged out with the large number of public reviews from RateBeer. Additionally, all tree-based models perform better at predicting taste than aroma. Linear models (LR) performed particularly poorly, with negative R 2 values, due to severe overfitting (training set R 2 = 1). Overfitting is a common issue in linear models with many parameters and limited samples, especially with interaction terms further amplifying the number of parameters. L1 regularization (Lasso) successfully overcomes this overfitting, out-competing multiple tree-based models on the RateBeer dataset. Similarly, the dimensionality reduction of PLSR avoids overfitting and improves performance, to some extent. Still, tree-based models (ABR, ET, GBR, RF and XGBR) show the best performance, out-competing the linear models (LR, Lasso, PLSR) commonly used in sensory science 65 .
GBR models showed the best overall performance in predicting sensory responses from chemical information, with R 2 values up to 0.75 depending on the predicted sensory feature (Supplementary Table S4 ). The GBR models predict consumer appreciation (RateBeer) better than our trained panel’s appreciation (R 2 value of 0.67 compared to R 2 value of 0.09) (Supplementary Table S3 and Supplementary Table S4 ). ANN models showed intermediate performance, likely because neural networks typically perform best with larger datasets 66 . The SVR shows intermediate performance, mostly due to the weak predictions of specific attributes that lower the overall performance (Supplementary Table S4 ).
Model dissection identifies specific, unexpected compounds as drivers of consumer appreciation
Next, we leveraged our models to infer important contributors to sensory perception and consumer appreciation. Consumer preference is a crucial sensory aspects, because a product that shows low consumer appreciation scores often does not succeed commercially 25 . Additionally, the requirement for a large number of representative evaluators makes consumer trials one of the more costly and time-consuming aspects of product development. Hence, a model for predicting chemical drivers of overall appreciation would be a welcome addition to the available toolbox for food development and optimization.
Since GBR models on our RateBeer dataset showed the best overall performance, we focused on these models. Specifically, we used two approaches to identify important contributors. First, rankings of the most important predictors for each sensorial trait in the GBR models were obtained based on impurity-based feature importance (mean decrease in impurity). High-ranked parameters were hypothesized to be either the true causal chemical properties underlying the trait, to correlate with the actual causal properties, or to take part in sensory interactions affecting the trait 67 (Fig. 4A ). In a second approach, we used SHAP 68 to determine which parameters contributed most to the model for making predictions of consumer appreciation (Fig. 4B ). SHAP calculates parameter contributions to model predictions on a per-sample basis, which can be aggregated into an importance score.

A The impurity-based feature importance (mean deviance in impurity, MDI) calculated from the Gradient Boosting Regression (GBR) model predicting RateBeer appreciation scores. The top 15 highest ranked chemical properties are shown. B SHAP summary plot for the top 15 parameters contributing to our GBR model. Each point on the graph represents a sample from our dataset. The color represents the concentration of that parameter, with bluer colors representing low values and redder colors representing higher values. Greater absolute values on the horizontal axis indicate a higher impact of the parameter on the prediction of the model. C Spearman correlations between the 15 most important chemical properties and consumer overall appreciation. Numbers indicate the Spearman Rho correlation coefficient, and the rank of this correlation compared to all other correlations. The top 15 important compounds were determined using SHAP (panel B).
Both approaches identified ethyl acetate as the most predictive parameter for beer appreciation (Fig. 4 ). Ethyl acetate is the most abundant ester in beer with a typical ‘fruity’, ‘solvent’ and ‘alcoholic’ flavor, but is often considered less important than other esters like isoamyl acetate. The second most important parameter identified by SHAP is ethanol, the most abundant beer compound after water. Apart from directly contributing to beer flavor and mouthfeel, ethanol drastically influences the physical properties of beer, dictating how easily volatile compounds escape the beer matrix to contribute to beer aroma 69 . Importantly, it should also be noted that the importance of ethanol for appreciation is likely inflated by the very low appreciation scores of non-alcoholic beers (Supplementary Fig. S4 ). Despite not often being considered a driver of beer appreciation, protein level also ranks highly in both approaches, possibly due to its effect on mouthfeel and body 70 . Lactic acid, which contributes to the tart taste of sour beers, is the fourth most important parameter identified by SHAP, possibly due to the generally high appreciation of sour beers in our dataset.
Interestingly, some of the most important predictive parameters for our model are not well-established as beer flavors or are even commonly regarded as being negative for beer quality. For example, our models identify methanethiol and ethyl phenyl acetate, an ester commonly linked to beer staling 71 , as a key factor contributing to beer appreciation. Although there is no doubt that high concentrations of these compounds are considered unpleasant, the positive effects of modest concentrations are not yet known 72 , 73 .
To compare our approach to conventional statistics, we evaluated how well the 15 most important SHAP-derived parameters correlate with consumer appreciation (Fig. 4C ). Interestingly, only 6 of the properties derived by SHAP rank amongst the top 15 most correlated parameters. For some chemical compounds, the correlations are so low that they would have likely been considered unimportant. For example, lactic acid, the fourth most important parameter, shows a bimodal distribution for appreciation, with sour beers forming a separate cluster, that is missed entirely by the Spearman correlation. Additionally, the correlation plots reveal outliers, emphasizing the need for robust analysis tools. Together, this highlights the need for alternative models, like the Gradient Boosting model, that better grasp the complexity of (beer) flavor.
Finally, to observe the relationships between these chemical properties and their predicted targets, partial dependence plots were constructed for the six most important predictors of consumer appreciation 74 , 75 , 76 (Supplementary Fig. S7 ). One-way partial dependence plots show how a change in concentration affects the predicted appreciation. These plots reveal an important limitation of our models: appreciation predictions remain constant at ever-increasing concentrations. This implies that once a threshold concentration is reached, further increasing the concentration does not affect appreciation. This is false, as it is well-documented that certain compounds become unpleasant at high concentrations, including ethyl acetate (‘nail polish’) 77 and methanethiol (‘sulfury’ and ‘rotten cabbage’) 78 . The inability of our models to grasp that flavor compounds have optimal levels, above which they become negative, is a consequence of working with commercial beer brands where (off-)flavors are rarely too high to negatively impact the product. The two-way partial dependence plots show how changing the concentration of two compounds influences predicted appreciation, visualizing their interactions (Supplementary Fig. S7 ). In our case, the top 5 parameters are dominated by additive or synergistic interactions, with high concentrations for both compounds resulting in the highest predicted appreciation.
To assess the robustness of our best-performing models and model predictions, we performed 100 iterations of the GBR, RF and ET models. In general, all iterations of the models yielded similar performance (Supplementary Fig. S8 ). Moreover, the main predictors (including the top predictors ethanol and ethyl acetate) remained virtually the same, especially for GBR and RF. For the iterations of the ET model, we did observe more variation in the top predictors, which is likely a consequence of the model’s inherent random architecture in combination with co-correlations between certain predictors. However, even in this case, several of the top predictors (ethanol and ethyl acetate) remain unchanged, although their rank in importance changes (Supplementary Fig. S8 ).
Next, we investigated if a combination of RateBeer and trained panel data into one consolidated dataset would lead to stronger models, under the hypothesis that such a model would suffer less from bias in the datasets. A GBR model was trained to predict appreciation on the combined dataset. This model underperformed compared to the RateBeer model, both in the native case and when including a dataset identifier (R 2 = 0.67, 0.26 and 0.42 respectively). For the latter, the dataset identifier is the most important feature (Supplementary Fig. S9 ), while most of the feature importance remains unchanged, with ethyl acetate and ethanol ranking highest, like in the original model trained only on RateBeer data. It seems that the large variation in the panel dataset introduces noise, weakening the models’ performances and reliability. In addition, it seems reasonable to assume that both datasets are fundamentally different, with the panel dataset obtained by blind tastings by a trained professional panel.
Lastly, we evaluated whether beer style identifiers would further enhance the model’s performance. A GBR model was trained with parameters that explicitly encoded the styles of the samples. This did not improve model performance (R2 = 0.66 with style information vs R2 = 0.67). The most important chemical features are consistent with the model trained without style information (eg. ethanol and ethyl acetate), and with the exception of the most preferred (strong ale) and least preferred (low/no-alcohol) styles, none of the styles were among the most important features (Supplementary Fig. S9 , Supplementary Table S5 and S6 ). This is likely due to a combination of style-specific chemical signatures, such as iso-alpha acids and lactic acid, that implicitly convey style information to the original models, as well as the low number of samples belonging to some styles, making it difficult for the model to learn style-specific patterns. Moreover, beer styles are not rigorously defined, with some styles overlapping in features and some beers being misattributed to a specific style, all of which leads to more noise in models that use style parameters.
Model validation
To test if our predictive models give insight into beer appreciation, we set up experiments aimed at improving existing commercial beers. We specifically selected overall appreciation as the trait to be examined because of its complexity and commercial relevance. Beer flavor comprises a complex bouquet rather than single aromas and tastes 53 . Hence, adding a single compound to the extent that a difference is noticeable may lead to an unbalanced, artificial flavor. Therefore, we evaluated the effect of combinations of compounds. Because Blond beers represent the most extensive style in our dataset, we selected a beer from this style as the starting material for these experiments (Beer 64 in Supplementary Data 1 ).
In the first set of experiments, we adjusted the concentrations of compounds that made up the most important predictors of overall appreciation (ethyl acetate, ethanol, lactic acid, ethyl phenyl acetate) together with correlated compounds (ethyl hexanoate, isoamyl acetate, glycerol), bringing them up to 95 th percentile ethanol-normalized concentrations (Methods) within the Blond group (‘Spiked’ concentration in Fig. 5A ). Compared to controls, the spiked beers were found to have significantly improved overall appreciation among trained panelists, with panelist noting increased intensity of ester flavors, sweetness, alcohol, and body fullness (Fig. 5B ). To disentangle the contribution of ethanol to these results, a second experiment was performed without the addition of ethanol. This resulted in a similar outcome, including increased perception of alcohol and overall appreciation.

Adding the top chemical compounds, identified as best predictors of appreciation by our model, into poorly appreciated beers results in increased appreciation from our trained panel. Results of sensory tests between base beers and those spiked with compounds identified as the best predictors by the model. A Blond and Non/Low-alcohol (0.0% ABV) base beers were brought up to 95th-percentile ethanol-normalized concentrations within each style. B For each sensory attribute, tasters indicated the more intense sample and selected the sample they preferred. The numbers above the bars correspond to the p values that indicate significant changes in perceived flavor (two-sided binomial test: alpha 0.05, n = 20 or 13).
In a last experiment, we tested whether using the model’s predictions can boost the appreciation of a non-alcoholic beer (beer 223 in Supplementary Data 1 ). Again, the addition of a mixture of predicted compounds (omitting ethanol, in this case) resulted in a significant increase in appreciation, body, ester flavor and sweetness.
Predicting flavor and consumer appreciation from chemical composition is one of the ultimate goals of sensory science. A reliable, systematic and unbiased way to link chemical profiles to flavor and food appreciation would be a significant asset to the food and beverage industry. Such tools would substantially aid in quality control and recipe development, offer an efficient and cost-effective alternative to pilot studies and consumer trials and would ultimately allow food manufacturers to produce superior, tailor-made products that better meet the demands of specific consumer groups more efficiently.
A limited set of studies have previously tried, to varying degrees of success, to predict beer flavor and beer popularity based on (a limited set of) chemical compounds and flavors 79 , 80 . Current sensitive, high-throughput technologies allow measuring an unprecedented number of chemical compounds and properties in a large set of samples, yielding a dataset that can train models that help close the gaps between chemistry and flavor, even for a complex natural product like beer. To our knowledge, no previous research gathered data at this scale (250 samples, 226 chemical parameters, 50 sensory attributes and 5 consumer scores) to disentangle and validate the chemical aspects driving beer preference using various machine-learning techniques. We find that modern machine learning models outperform conventional statistical tools, such as correlations and linear models, and can successfully predict flavor appreciation from chemical composition. This could be attributed to the natural incorporation of interactions and non-linear or discontinuous effects in machine learning models, which are not easily grasped by the linear model architecture. While linear models and partial least squares regression represent the most widespread statistical approaches in sensory science, in part because they allow interpretation 65 , 81 , 82 , modern machine learning methods allow for building better predictive models while preserving the possibility to dissect and exploit the underlying patterns. Of the 10 different models we trained, tree-based models, such as our best performing GBR, showed the best overall performance in predicting sensory responses from chemical information, outcompeting artificial neural networks. This agrees with previous reports for models trained on tabular data 83 . Our results are in line with the findings of Colantonio et al. who also identified the gradient boosting architecture as performing best at predicting appreciation and flavor (of tomatoes and blueberries, in their specific study) 26 . Importantly, besides our larger experimental scale, we were able to directly confirm our models’ predictions in vivo.
Our study confirms that flavor compound concentration does not always correlate with perception, suggesting complex interactions that are often missed by more conventional statistics and simple models. Specifically, we find that tree-based algorithms may perform best in developing models that link complex food chemistry with aroma. Furthermore, we show that massive datasets of untrained consumer reviews provide a valuable source of data, that can complement or even replace trained tasting panels, especially for appreciation and basic flavors, such as sweetness and bitterness. This holds despite biases that are known to occur in such datasets, such as price or conformity bias. Moreover, GBR models predict taste better than aroma. This is likely because taste (e.g. bitterness) often directly relates to the corresponding chemical measurements (e.g., iso-alpha acids), whereas such a link is less clear for aromas, which often result from the interplay between multiple volatile compounds. We also find that our models are best at predicting acidity and alcohol, likely because there is a direct relation between the measured chemical compounds (acids and ethanol) and the corresponding perceived sensorial attribute (acidity and alcohol), and because even untrained consumers are generally able to recognize these flavors and aromas.
The predictions of our final models, trained on review data, hold even for blind tastings with small groups of trained tasters, as demonstrated by our ability to validate specific compounds as drivers of beer flavor and appreciation. Since adding a single compound to the extent of a noticeable difference may result in an unbalanced flavor profile, we specifically tested our identified key drivers as a combination of compounds. While this approach does not allow us to validate if a particular single compound would affect flavor and/or appreciation, our experiments do show that this combination of compounds increases consumer appreciation.
It is important to stress that, while it represents an important step forward, our approach still has several major limitations. A key weakness of the GBR model architecture is that amongst co-correlating variables, the largest main effect is consistently preferred for model building. As a result, co-correlating variables often have artificially low importance scores, both for impurity and SHAP-based methods, like we observed in the comparison to the more randomized Extra Trees models. This implies that chemicals identified as key drivers of a specific sensory feature by GBR might not be the true causative compounds, but rather co-correlate with the actual causative chemical. For example, the high importance of ethyl acetate could be (partially) attributed to the total ester content, ethanol or ethyl hexanoate (rho=0.77, rho=0.72 and rho=0.68), while ethyl phenylacetate could hide the importance of prenyl isobutyrate and ethyl benzoate (rho=0.77 and rho=0.76). Expanding our GBR model to include beer style as a parameter did not yield additional power or insight. This is likely due to style-specific chemical signatures, such as iso-alpha acids and lactic acid, that implicitly convey style information to the original model, as well as the smaller sample size per style, limiting the power to uncover style-specific patterns. This can be partly attributed to the curse of dimensionality, where the high number of parameters results in the models mainly incorporating single parameter effects, rather than complex interactions such as style-dependent effects 67 . A larger number of samples may overcome some of these limitations and offer more insight into style-specific effects. On the other hand, beer style is not a rigid scientific classification, and beers within one style often differ a lot, which further complicates the analysis of style as a model factor.
Our study is limited to beers from Belgian breweries. Although these beers cover a large portion of the beer styles available globally, some beer styles and consumer patterns may be missing, while other features might be overrepresented. For example, many Belgian ales exhibit yeast-driven flavor profiles, which is reflected in the chemical drivers of appreciation discovered by this study. In future work, expanding the scope to include diverse markets and beer styles could lead to the identification of even more drivers of appreciation and better models for special niche products that were not present in our beer set.
In addition to inherent limitations of GBR models, there are also some limitations associated with studying food aroma. Even if our chemical analyses measured most of the known aroma compounds, the total number of flavor compounds in complex foods like beer is still larger than the subset we were able to measure in this study. For example, hop-derived thiols, that influence flavor at very low concentrations, are notoriously difficult to measure in a high-throughput experiment. Moreover, consumer perception remains subjective and prone to biases that are difficult to avoid. It is also important to stress that the models are still immature and that more extensive datasets will be crucial for developing more complete models in the future. Besides more samples and parameters, our dataset does not include any demographic information about the tasters. Including such data could lead to better models that grasp external factors like age and culture. Another limitation is that our set of beers consists of high-quality end-products and lacks beers that are unfit for sale, which limits the current model in accurately predicting products that are appreciated very badly. Finally, while models could be readily applied in quality control, their use in sensory science and product development is restrained by their inability to discern causal relationships. Given that the models cannot distinguish compounds that genuinely drive consumer perception from those that merely correlate, validation experiments are essential to identify true causative compounds.
Despite the inherent limitations, dissection of our models enabled us to pinpoint specific molecules as potential drivers of beer aroma and consumer appreciation, including compounds that were unexpected and would not have been identified using standard approaches. Important drivers of beer appreciation uncovered by our models include protein levels, ethyl acetate, ethyl phenyl acetate and lactic acid. Currently, many brewers already use lactic acid to acidify their brewing water and ensure optimal pH for enzymatic activity during the mashing process. Our results suggest that adding lactic acid can also improve beer appreciation, although its individual effect remains to be tested. Interestingly, ethanol appears to be unnecessary to improve beer appreciation, both for blond beer and alcohol-free beer. Given the growing consumer interest in alcohol-free beer, with a predicted annual market growth of >7% 84 , it is relevant for brewers to know what compounds can further increase consumer appreciation of these beers. Hence, our model may readily provide avenues to further improve the flavor and consumer appreciation of both alcoholic and non-alcoholic beers, which is generally considered one of the key challenges for future beer production.
Whereas we see a direct implementation of our results for the development of superior alcohol-free beverages and other food products, our study can also serve as a stepping stone for the development of novel alcohol-containing beverages. We want to echo the growing body of scientific evidence for the negative effects of alcohol consumption, both on the individual level by the mutagenic, teratogenic and carcinogenic effects of ethanol 85 , 86 , as well as the burden on society caused by alcohol abuse and addiction. We encourage the use of our results for the production of healthier, tastier products, including novel and improved beverages with lower alcohol contents. Furthermore, we strongly discourage the use of these technologies to improve the appreciation or addictive properties of harmful substances.
The present work demonstrates that despite some important remaining hurdles, combining the latest developments in chemical analyses, sensory analysis and modern machine learning methods offers exciting avenues for food chemistry and engineering. Soon, these tools may provide solutions in quality control and recipe development, as well as new approaches to sensory science and flavor research.
Beer selection
250 commercial Belgian beers were selected to cover the broad diversity of beer styles and corresponding diversity in chemical composition and aroma. See Supplementary Fig. S1 .
Chemical dataset
Sample preparation.
Beers within their expiration date were purchased from commercial retailers. Samples were prepared in biological duplicates at room temperature, unless explicitly stated otherwise. Bottle pressure was measured with a manual pressure device (Steinfurth Mess-Systeme GmbH) and used to calculate CO 2 concentration. The beer was poured through two filter papers (Macherey-Nagel, 500713032 MN 713 ¼) to remove carbon dioxide and prevent spontaneous foaming. Samples were then prepared for measurements by targeted Headspace-Gas Chromatography-Flame Ionization Detector/Flame Photometric Detector (HS-GC-FID/FPD), Headspace-Solid Phase Microextraction-Gas Chromatography-Mass Spectrometry (HS-SPME-GC-MS), colorimetric analysis, enzymatic analysis, Near-Infrared (NIR) analysis, as described in the sections below. The mean values of biological duplicates are reported for each compound.
HS-GC-FID/FPD
HS-GC-FID/FPD (Shimadzu GC 2010 Plus) was used to measure higher alcohols, acetaldehyde, esters, 4-vinyl guaicol, and sulfur compounds. Each measurement comprised 5 ml of sample pipetted into a 20 ml glass vial containing 1.75 g NaCl (VWR, 27810.295). 100 µl of 2-heptanol (Sigma-Aldrich, H3003) (internal standard) solution in ethanol (Fisher Chemical, E/0650DF/C17) was added for a final concentration of 2.44 mg/L. Samples were flushed with nitrogen for 10 s, sealed with a silicone septum, stored at −80 °C and analyzed in batches of 20.
The GC was equipped with a DB-WAXetr column (length, 30 m; internal diameter, 0.32 mm; layer thickness, 0.50 µm; Agilent Technologies, Santa Clara, CA, USA) to the FID and an HP-5 column (length, 30 m; internal diameter, 0.25 mm; layer thickness, 0.25 µm; Agilent Technologies, Santa Clara, CA, USA) to the FPD. N 2 was used as the carrier gas. Samples were incubated for 20 min at 70 °C in the headspace autosampler (Flow rate, 35 cm/s; Injection volume, 1000 µL; Injection mode, split; Combi PAL autosampler, CTC analytics, Switzerland). The injector, FID and FPD temperatures were kept at 250 °C. The GC oven temperature was first held at 50 °C for 5 min and then allowed to rise to 80 °C at a rate of 5 °C/min, followed by a second ramp of 4 °C/min until 200 °C kept for 3 min and a final ramp of (4 °C/min) until 230 °C for 1 min. Results were analyzed with the GCSolution software version 2.4 (Shimadzu, Kyoto, Japan). The GC was calibrated with a 5% EtOH solution (VWR International) containing the volatiles under study (Supplementary Table S7 ).
HS-SPME-GC-MS
HS-SPME-GC-MS (Shimadzu GCMS-QP-2010 Ultra) was used to measure additional volatile compounds, mainly comprising terpenoids and esters. Samples were analyzed by HS-SPME using a triphase DVB/Carboxen/PDMS 50/30 μm SPME fiber (Supelco Co., Bellefonte, PA, USA) followed by gas chromatography (Thermo Fisher Scientific Trace 1300 series, USA) coupled to a mass spectrometer (Thermo Fisher Scientific ISQ series MS) equipped with a TriPlus RSH autosampler. 5 ml of degassed beer sample was placed in 20 ml vials containing 1.75 g NaCl (VWR, 27810.295). 5 µl internal standard mix was added, containing 2-heptanol (1 g/L) (Sigma-Aldrich, H3003), 4-fluorobenzaldehyde (1 g/L) (Sigma-Aldrich, 128376), 2,3-hexanedione (1 g/L) (Sigma-Aldrich, 144169) and guaiacol (1 g/L) (Sigma-Aldrich, W253200) in ethanol (Fisher Chemical, E/0650DF/C17). Each sample was incubated at 60 °C in the autosampler oven with constant agitation. After 5 min equilibration, the SPME fiber was exposed to the sample headspace for 30 min. The compounds trapped on the fiber were thermally desorbed in the injection port of the chromatograph by heating the fiber for 15 min at 270 °C.
The GC-MS was equipped with a low polarity RXi-5Sil MS column (length, 20 m; internal diameter, 0.18 mm; layer thickness, 0.18 µm; Restek, Bellefonte, PA, USA). Injection was performed in splitless mode at 320 °C, a split flow of 9 ml/min, a purge flow of 5 ml/min and an open valve time of 3 min. To obtain a pulsed injection, a programmed gas flow was used whereby the helium gas flow was set at 2.7 mL/min for 0.1 min, followed by a decrease in flow of 20 ml/min to the normal 0.9 mL/min. The temperature was first held at 30 °C for 3 min and then allowed to rise to 80 °C at a rate of 7 °C/min, followed by a second ramp of 2 °C/min till 125 °C and a final ramp of 8 °C/min with a final temperature of 270 °C.
Mass acquisition range was 33 to 550 amu at a scan rate of 5 scans/s. Electron impact ionization energy was 70 eV. The interface and ion source were kept at 275 °C and 250 °C, respectively. A mix of linear n-alkanes (from C7 to C40, Supelco Co.) was injected into the GC-MS under identical conditions to serve as external retention index markers. Identification and quantification of the compounds were performed using an in-house developed R script as described in Goelen et al. and Reher et al. 87 , 88 (for package information, see Supplementary Table S8 ). Briefly, chromatograms were analyzed using AMDIS (v2.71) 89 to separate overlapping peaks and obtain pure compound spectra. The NIST MS Search software (v2.0 g) in combination with the NIST2017, FFNSC3 and Adams4 libraries were used to manually identify the empirical spectra, taking into account the expected retention time. After background subtraction and correcting for retention time shifts between samples run on different days based on alkane ladders, compound elution profiles were extracted and integrated using a file with 284 target compounds of interest, which were either recovered in our identified AMDIS list of spectra or were known to occur in beer. Compound elution profiles were estimated for every peak in every chromatogram over a time-restricted window using weighted non-negative least square analysis after which peak areas were integrated 87 , 88 . Batch effect correction was performed by normalizing against the most stable internal standard compound, 4-fluorobenzaldehyde. Out of all 284 target compounds that were analyzed, 167 were visually judged to have reliable elution profiles and were used for final analysis.
Discrete photometric and enzymatic analysis
Discrete photometric and enzymatic analysis (Thermo Scientific TM Gallery TM Plus Beermaster Discrete Analyzer) was used to measure acetic acid, ammonia, beta-glucan, iso-alpha acids, color, sugars, glycerol, iron, pH, protein, and sulfite. 2 ml of sample volume was used for the analyses. Information regarding the reagents and standard solutions used for analyses and calibrations is included in Supplementary Table S7 and Supplementary Table S9 .
NIR analyses
NIR analysis (Anton Paar Alcolyzer Beer ME System) was used to measure ethanol. Measurements comprised 50 ml of sample, and a 10% EtOH solution was used for calibration.
Correlation calculations
Pairwise Spearman Rank correlations were calculated between all chemical properties.
Sensory dataset
Trained panel.
Our trained tasting panel consisted of volunteers who gave prior verbal informed consent. All compounds used for the validation experiment were of food-grade quality. The tasting sessions were approved by the Social and Societal Ethics Committee of the KU Leuven (G-2022-5677-R2(MAR)). All online reviewers agreed to the Terms and Conditions of the RateBeer website.
Sensory analysis was performed according to the American Society of Brewing Chemists (ASBC) Sensory Analysis Methods 90 . 30 volunteers were screened through a series of triangle tests. The sixteen most sensitive and consistent tasters were retained as taste panel members. The resulting panel was diverse in age [22–42, mean: 29], sex [56% male] and nationality [7 different countries]. The panel developed a consensus vocabulary to describe beer aroma, taste and mouthfeel. Panelists were trained to identify and score 50 different attributes, using a 7-point scale to rate attributes’ intensity. The scoring sheet is included as Supplementary Data 3 . Sensory assessments took place between 10–12 a.m. The beers were served in black-colored glasses. Per session, between 5 and 12 beers of the same style were tasted at 12 °C to 16 °C. Two reference beers were added to each set and indicated as ‘Reference 1 & 2’, allowing panel members to calibrate their ratings. Not all panelists were present at every tasting. Scores were scaled by standard deviation and mean-centered per taster. Values are represented as z-scores and clustered by Euclidean distance. Pairwise Spearman correlations were calculated between taste and aroma sensory attributes. Panel consistency was evaluated by repeating samples on different sessions and performing ANOVA to identify differences, using the ‘stats’ package (v4.2.2) in R (for package information, see Supplementary Table S8 ).
Online reviews from a public database
The ‘scrapy’ package in Python (v3.6) (for package information, see Supplementary Table S8 ). was used to collect 232,288 online reviews (mean=922, min=6, max=5343) from RateBeer, an online beer review database. Each review entry comprised 5 numerical scores (appearance, aroma, taste, palate and overall quality) and an optional review text. The total number of reviews per reviewer was collected separately. Numerical scores were scaled and centered per rater, and mean scores were calculated per beer.
For the review texts, the language was estimated using the packages ‘langdetect’ and ‘langid’ in Python. Reviews that were classified as English by both packages were kept. Reviewers with fewer than 100 entries overall were discarded. 181,025 reviews from >6000 reviewers from >40 countries remained. Text processing was done using the ‘nltk’ package in Python. Texts were corrected for slang and misspellings; proper nouns and rare words that are relevant to the beer context were specified and kept as-is (‘Chimay’,’Lambic’, etc.). A dictionary of semantically similar sensorial terms, for example ‘floral’ and ‘flower’, was created and collapsed together into one term. Words were stemmed and lemmatized to avoid identifying words such as ‘acid’ and ‘acidity’ as separate terms. Numbers and punctuation were removed.
Sentences from up to 50 randomly chosen reviews per beer were manually categorized according to the aspect of beer they describe (appearance, aroma, taste, palate, overall quality—not to be confused with the 5 numerical scores described above) or flagged as irrelevant if they contained no useful information. If a beer contained fewer than 50 reviews, all reviews were manually classified. This labeled data set was used to train a model that classified the rest of the sentences for all beers 91 . Sentences describing taste and aroma were extracted, and term frequency–inverse document frequency (TFIDF) was implemented to calculate enrichment scores for sensorial words per beer.
The sex of the tasting subject was not considered when building our sensory database. Instead, results from different panelists were averaged, both for our trained panel (56% male, 44% female) and the RateBeer reviews (70% male, 30% female for RateBeer as a whole).
Beer price collection and processing
Beer prices were collected from the following stores: Colruyt, Delhaize, Total Wine, BeerHawk, The Belgian Beer Shop, The Belgian Shop, and Beer of Belgium. Where applicable, prices were converted to Euros and normalized per liter. Spearman correlations were calculated between these prices and mean overall appreciation scores from RateBeer and the taste panel, respectively.
Pairwise Spearman Rank correlations were calculated between all sensory properties.
Machine learning models
Predictive modeling of sensory profiles from chemical data.
Regression models were constructed to predict (a) trained panel scores for beer flavors and quality from beer chemical profiles and (b) public reviews’ appreciation scores from beer chemical profiles. Z-scores were used to represent sensory attributes in both data sets. Chemical properties with log-normal distributions (Shapiro-Wilk test, p < 0.05 ) were log-transformed. Missing chemical measurements (0.1% of all data) were replaced with mean values per attribute. Observations from 250 beers were randomly separated into a training set (70%, 175 beers) and a test set (30%, 75 beers), stratified per beer style. Chemical measurements (p = 231) were normalized based on the training set average and standard deviation. In total, three linear regression-based models: linear regression with first-order interaction terms (LR), lasso regression with first-order interaction terms (Lasso) and partial least squares regression (PLSR); five decision tree models, Adaboost regressor (ABR), Extra Trees (ET), Gradient Boosting regressor (GBR), Random Forest (RF) and XGBoost regressor (XGBR); one support vector machine model (SVR) and one artificial neural network model (ANN) were trained. The models were implemented using the ‘scikit-learn’ package (v1.2.2) and ‘xgboost’ package (v1.7.3) in Python (v3.9.16). Models were trained, and hyperparameters optimized, using five-fold cross-validated grid search with the coefficient of determination (R 2 ) as the evaluation metric. The ANN (scikit-learn’s MLPRegressor) was optimized using Bayesian Tree-Structured Parzen Estimator optimization with the ‘Optuna’ Python package (v3.2.0). Individual models were trained per attribute, and a multi-output model was trained on all attributes simultaneously.
Model dissection
GBR was found to outperform other methods, resulting in models with the highest average R 2 values in both trained panel and public review data sets. Impurity-based rankings of the most important predictors for each predicted sensorial trait were obtained using the ‘scikit-learn’ package. To observe the relationships between these chemical properties and their predicted targets, partial dependence plots (PDP) were constructed for the six most important predictors of consumer appreciation 74 , 75 .
The ‘SHAP’ package in Python (v0.41.0) was implemented to provide an alternative ranking of predictor importance and to visualize the predictors’ effects as a function of their concentration 68 .
Validation of causal chemical properties
To validate the effects of the most important model features on predicted sensory attributes, beers were spiked with the chemical compounds identified by the models and descriptive sensory analyses were carried out according to the American Society of Brewing Chemists (ASBC) protocol 90 .
Compound spiking was done 30 min before tasting. Compounds were spiked into fresh beer bottles, that were immediately resealed and inverted three times. Fresh bottles of beer were opened for the same duration, resealed, and inverted thrice, to serve as controls. Pairs of spiked samples and controls were served simultaneously, chilled and in dark glasses as outlined in the Trained panel section above. Tasters were instructed to select the glass with the higher flavor intensity for each attribute (directional difference test 92 ) and to select the glass they prefer.
The final concentration after spiking was equal to the within-style average, after normalizing by ethanol concentration. This was done to ensure balanced flavor profiles in the final spiked beer. The same methods were applied to improve a non-alcoholic beer. Compounds were the following: ethyl acetate (Merck KGaA, W241415), ethyl hexanoate (Merck KGaA, W243906), isoamyl acetate (Merck KGaA, W205508), phenethyl acetate (Merck KGaA, W285706), ethanol (96%, Colruyt), glycerol (Merck KGaA, W252506), lactic acid (Merck KGaA, 261106).
Significant differences in preference or perceived intensity were determined by performing the two-sided binomial test on each attribute.
Reporting summary
Further information on research design is available in the Nature Portfolio Reporting Summary linked to this article.
Data availability
The data that support the findings of this work are available in the Supplementary Data files and have been deposited to Zenodo under accession code 10653704 93 . The RateBeer scores data are under restricted access, they are not publicly available as they are property of RateBeer (ZX Ventures, USA). Access can be obtained from the authors upon reasonable request and with permission of RateBeer (ZX Ventures, USA). Source data are provided with this paper.
Code availability
The code for training the machine learning models, analyzing the models, and generating the figures has been deposited to Zenodo under accession code 10653704 93 .
Tieman, D. et al. A chemical genetic roadmap to improved tomato flavor. Science 355 , 391–394 (2017).
Article ADS CAS PubMed Google Scholar
Plutowska, B. & Wardencki, W. Application of gas chromatography–olfactometry (GC–O) in analysis and quality assessment of alcoholic beverages – A review. Food Chem. 107 , 449–463 (2008).
Article CAS Google Scholar
Legin, A., Rudnitskaya, A., Seleznev, B. & Vlasov, Y. Electronic tongue for quality assessment of ethanol, vodka and eau-de-vie. Anal. Chim. Acta 534 , 129–135 (2005).
Loutfi, A., Coradeschi, S., Mani, G. K., Shankar, P. & Rayappan, J. B. B. Electronic noses for food quality: A review. J. Food Eng. 144 , 103–111 (2015).
Ahn, Y.-Y., Ahnert, S. E., Bagrow, J. P. & Barabási, A.-L. Flavor network and the principles of food pairing. Sci. Rep. 1 , 196 (2011).
Article CAS PubMed PubMed Central Google Scholar
Bartoshuk, L. M. & Klee, H. J. Better fruits and vegetables through sensory analysis. Curr. Biol. 23 , R374–R378 (2013).
Article CAS PubMed Google Scholar
Piggott, J. R. Design questions in sensory and consumer science. Food Qual. Prefer. 3293 , 217–220 (1995).
Article Google Scholar
Kermit, M. & Lengard, V. Assessing the performance of a sensory panel-panellist monitoring and tracking. J. Chemom. 19 , 154–161 (2005).
Cook, D. J., Hollowood, T. A., Linforth, R. S. T. & Taylor, A. J. Correlating instrumental measurements of texture and flavour release with human perception. Int. J. Food Sci. Technol. 40 , 631–641 (2005).
Chinchanachokchai, S., Thontirawong, P. & Chinchanachokchai, P. A tale of two recommender systems: The moderating role of consumer expertise on artificial intelligence based product recommendations. J. Retail. Consum. Serv. 61 , 1–12 (2021).
Ross, C. F. Sensory science at the human-machine interface. Trends Food Sci. Technol. 20 , 63–72 (2009).
Chambers, E. IV & Koppel, K. Associations of volatile compounds with sensory aroma and flavor: The complex nature of flavor. Molecules 18 , 4887–4905 (2013).
Pinu, F. R. Metabolomics—The new frontier in food safety and quality research. Food Res. Int. 72 , 80–81 (2015).
Danezis, G. P., Tsagkaris, A. S., Brusic, V. & Georgiou, C. A. Food authentication: state of the art and prospects. Curr. Opin. Food Sci. 10 , 22–31 (2016).
Shepherd, G. M. Smell images and the flavour system in the human brain. Nature 444 , 316–321 (2006).
Meilgaard, M. C. Prediction of flavor differences between beers from their chemical composition. J. Agric. Food Chem. 30 , 1009–1017 (1982).
Xu, L. et al. Widespread receptor-driven modulation in peripheral olfactory coding. Science 368 , eaaz5390 (2020).
Kupferschmidt, K. Following the flavor. Science 340 , 808–809 (2013).
Billesbølle, C. B. et al. Structural basis of odorant recognition by a human odorant receptor. Nature 615 , 742–749 (2023).
Article ADS PubMed PubMed Central Google Scholar
Smith, B. Perspective: Complexities of flavour. Nature 486 , S6–S6 (2012).
Pfister, P. et al. Odorant receptor inhibition is fundamental to odor encoding. Curr. Biol. 30 , 2574–2587 (2020).
Moskowitz, H. W., Kumaraiah, V., Sharma, K. N., Jacobs, H. L. & Sharma, S. D. Cross-cultural differences in simple taste preferences. Science 190 , 1217–1218 (1975).
Eriksson, N. et al. A genetic variant near olfactory receptor genes influences cilantro preference. Flavour 1 , 22 (2012).
Ferdenzi, C. et al. Variability of affective responses to odors: Culture, gender, and olfactory knowledge. Chem. Senses 38 , 175–186 (2013).
Article PubMed Google Scholar
Lawless, H. T. & Heymann, H. Sensory evaluation of food: Principles and practices. (Springer, New York, NY). https://doi.org/10.1007/978-1-4419-6488-5 (2010).
Colantonio, V. et al. Metabolomic selection for enhanced fruit flavor. Proc. Natl. Acad. Sci. 119 , e2115865119 (2022).
Fritz, F., Preissner, R. & Banerjee, P. VirtualTaste: a web server for the prediction of organoleptic properties of chemical compounds. Nucleic Acids Res 49 , W679–W684 (2021).
Tuwani, R., Wadhwa, S. & Bagler, G. BitterSweet: Building machine learning models for predicting the bitter and sweet taste of small molecules. Sci. Rep. 9 , 1–13 (2019).
Dagan-Wiener, A. et al. Bitter or not? BitterPredict, a tool for predicting taste from chemical structure. Sci. Rep. 7 , 1–13 (2017).
Pallante, L. et al. Toward a general and interpretable umami taste predictor using a multi-objective machine learning approach. Sci. Rep. 12 , 1–11 (2022).
Malavolta, M. et al. A survey on computational taste predictors. Eur. Food Res. Technol. 248 , 2215–2235 (2022).
Lee, B. K. et al. A principal odor map unifies diverse tasks in olfactory perception. Science 381 , 999–1006 (2023).
Mayhew, E. J. et al. Transport features predict if a molecule is odorous. Proc. Natl. Acad. Sci. 119 , e2116576119 (2022).
Niu, Y. et al. Sensory evaluation of the synergism among ester odorants in light aroma-type liquor by odor threshold, aroma intensity and flash GC electronic nose. Food Res. Int. 113 , 102–114 (2018).
Yu, P., Low, M. Y. & Zhou, W. Design of experiments and regression modelling in food flavour and sensory analysis: A review. Trends Food Sci. Technol. 71 , 202–215 (2018).
Oladokun, O. et al. The impact of hop bitter acid and polyphenol profiles on the perceived bitterness of beer. Food Chem. 205 , 212–220 (2016).
Linforth, R., Cabannes, M., Hewson, L., Yang, N. & Taylor, A. Effect of fat content on flavor delivery during consumption: An in vivo model. J. Agric. Food Chem. 58 , 6905–6911 (2010).
Guo, S., Na Jom, K. & Ge, Y. Influence of roasting condition on flavor profile of sunflower seeds: A flavoromics approach. Sci. Rep. 9 , 11295 (2019).
Ren, Q. et al. The changes of microbial community and flavor compound in the fermentation process of Chinese rice wine using Fagopyrum tataricum grain as feedstock. Sci. Rep. 9 , 3365 (2019).
Hastie, T., Friedman, J. & Tibshirani, R. The Elements of Statistical Learning. (Springer, New York, NY). https://doi.org/10.1007/978-0-387-21606-5 (2001).
Dietz, C., Cook, D., Huismann, M., Wilson, C. & Ford, R. The multisensory perception of hop essential oil: a review. J. Inst. Brew. 126 , 320–342 (2020).
CAS Google Scholar
Roncoroni, Miguel & Verstrepen, Kevin Joan. Belgian Beer: Tested and Tasted. (Lannoo, 2018).
Meilgaard, M. Flavor chemistry of beer: Part II: Flavor and threshold of 239 aroma volatiles. in (1975).
Bokulich, N. A. & Bamforth, C. W. The microbiology of malting and brewing. Microbiol. Mol. Biol. Rev. MMBR 77 , 157–172 (2013).
Dzialo, M. C., Park, R., Steensels, J., Lievens, B. & Verstrepen, K. J. Physiology, ecology and industrial applications of aroma formation in yeast. FEMS Microbiol. Rev. 41 , S95–S128 (2017).
Article PubMed PubMed Central Google Scholar
Datta, A. et al. Computer-aided food engineering. Nat. Food 3 , 894–904 (2022).
American Society of Brewing Chemists. Beer Methods. (American Society of Brewing Chemists, St. Paul, MN, U.S.A.).
Olaniran, A. O., Hiralal, L., Mokoena, M. P. & Pillay, B. Flavour-active volatile compounds in beer: production, regulation and control. J. Inst. Brew. 123 , 13–23 (2017).
Verstrepen, K. J. et al. Flavor-active esters: Adding fruitiness to beer. J. Biosci. Bioeng. 96 , 110–118 (2003).
Meilgaard, M. C. Flavour chemistry of beer. part I: flavour interaction between principal volatiles. Master Brew. Assoc. Am. Tech. Q 12 , 107–117 (1975).
Briggs, D. E., Boulton, C. A., Brookes, P. A. & Stevens, R. Brewing 227–254. (Woodhead Publishing). https://doi.org/10.1533/9781855739062.227 (2004).
Bossaert, S., Crauwels, S., De Rouck, G. & Lievens, B. The power of sour - A review: Old traditions, new opportunities. BrewingScience 72 , 78–88 (2019).
Google Scholar
Verstrepen, K. J. et al. Flavor active esters: Adding fruitiness to beer. J. Biosci. Bioeng. 96 , 110–118 (2003).
Snauwaert, I. et al. Microbial diversity and metabolite composition of Belgian red-brown acidic ales. Int. J. Food Microbiol. 221 , 1–11 (2016).
Spitaels, F. et al. The microbial diversity of traditional spontaneously fermented lambic beer. PLoS ONE 9 , e95384 (2014).
Blanco, C. A., Andrés-Iglesias, C. & Montero, O. Low-alcohol Beers: Flavor Compounds, Defects, and Improvement Strategies. Crit. Rev. Food Sci. Nutr. 56 , 1379–1388 (2016).
Jackowski, M. & Trusek, A. Non-Alcohol. beer Prod. – Overv. 20 , 32–38 (2018).
Takoi, K. et al. The contribution of geraniol metabolism to the citrus flavour of beer: Synergy of geraniol and β-citronellol under coexistence with excess linalool. J. Inst. Brew. 116 , 251–260 (2010).
Kroeze, J. H. & Bartoshuk, L. M. Bitterness suppression as revealed by split-tongue taste stimulation in humans. Physiol. Behav. 35 , 779–783 (1985).
Mennella, J. A. et al. A spoonful of sugar helps the medicine go down”: Bitter masking bysucrose among children and adults. Chem. Senses 40 , 17–25 (2015).
Wietstock, P., Kunz, T., Perreira, F. & Methner, F.-J. Metal chelation behavior of hop acids in buffered model systems. BrewingScience 69 , 56–63 (2016).
Sancho, D., Blanco, C. A., Caballero, I. & Pascual, A. Free iron in pale, dark and alcohol-free commercial lager beers. J. Sci. Food Agric. 91 , 1142–1147 (2011).
Rodrigues, H. & Parr, W. V. Contribution of cross-cultural studies to understanding wine appreciation: A review. Food Res. Int. 115 , 251–258 (2019).
Korneva, E. & Blockeel, H. Towards better evaluation of multi-target regression models. in ECML PKDD 2020 Workshops (eds. Koprinska, I. et al.) 353–362 (Springer International Publishing, Cham, 2020). https://doi.org/10.1007/978-3-030-65965-3_23 .
Gastón Ares. Mathematical and Statistical Methods in Food Science and Technology. (Wiley, 2013).
Grinsztajn, L., Oyallon, E. & Varoquaux, G. Why do tree-based models still outperform deep learning on tabular data? Preprint at http://arxiv.org/abs/2207.08815 (2022).
Gries, S. T. Statistics for Linguistics with R: A Practical Introduction. in Statistics for Linguistics with R (De Gruyter Mouton, 2021). https://doi.org/10.1515/9783110718256 .
Lundberg, S. M. et al. From local explanations to global understanding with explainable AI for trees. Nat. Mach. Intell. 2 , 56–67 (2020).
Ickes, C. M. & Cadwallader, K. R. Effects of ethanol on flavor perception in alcoholic beverages. Chemosens. Percept. 10 , 119–134 (2017).
Kato, M. et al. Influence of high molecular weight polypeptides on the mouthfeel of commercial beer. J. Inst. Brew. 127 , 27–40 (2021).
Wauters, R. et al. Novel Saccharomyces cerevisiae variants slow down the accumulation of staling aldehydes and improve beer shelf-life. Food Chem. 398 , 1–11 (2023).
Li, H., Jia, S. & Zhang, W. Rapid determination of low-level sulfur compounds in beer by headspace gas chromatography with a pulsed flame photometric detector. J. Am. Soc. Brew. Chem. 66 , 188–191 (2008).
Dercksen, A., Laurens, J., Torline, P., Axcell, B. C. & Rohwer, E. Quantitative analysis of volatile sulfur compounds in beer using a membrane extraction interface. J. Am. Soc. Brew. Chem. 54 , 228–233 (1996).
Molnar, C. Interpretable Machine Learning: A Guide for Making Black-Box Models Interpretable. (2020).
Zhao, Q. & Hastie, T. Causal interpretations of black-box models. J. Bus. Econ. Stat. Publ. Am. Stat. Assoc. 39 , 272–281 (2019).
Article MathSciNet Google Scholar
Hastie, T., Tibshirani, R. & Friedman, J. The Elements of Statistical Learning. (Springer, 2019).
Labrado, D. et al. Identification by NMR of key compounds present in beer distillates and residual phases after dealcoholization by vacuum distillation. J. Sci. Food Agric. 100 , 3971–3978 (2020).
Lusk, L. T., Kay, S. B., Porubcan, A. & Ryder, D. S. Key olfactory cues for beer oxidation. J. Am. Soc. Brew. Chem. 70 , 257–261 (2012).
Gonzalez Viejo, C., Torrico, D. D., Dunshea, F. R. & Fuentes, S. Development of artificial neural network models to assess beer acceptability based on sensory properties using a robotic pourer: A comparative model approach to achieve an artificial intelligence system. Beverages 5 , 33 (2019).
Gonzalez Viejo, C., Fuentes, S., Torrico, D. D., Godbole, A. & Dunshea, F. R. Chemical characterization of aromas in beer and their effect on consumers liking. Food Chem. 293 , 479–485 (2019).
Gilbert, J. L. et al. Identifying breeding priorities for blueberry flavor using biochemical, sensory, and genotype by environment analyses. PLOS ONE 10 , 1–21 (2015).
Goulet, C. et al. Role of an esterase in flavor volatile variation within the tomato clade. Proc. Natl. Acad. Sci. 109 , 19009–19014 (2012).
Article ADS CAS PubMed PubMed Central Google Scholar
Borisov, V. et al. Deep Neural Networks and Tabular Data: A Survey. IEEE Trans. Neural Netw. Learn. Syst. 1–21 https://doi.org/10.1109/TNNLS.2022.3229161 (2022).
Statista. Statista Consumer Market Outlook: Beer - Worldwide.
Seitz, H. K. & Stickel, F. Molecular mechanisms of alcoholmediated carcinogenesis. Nat. Rev. Cancer 7 , 599–612 (2007).
Voordeckers, K. et al. Ethanol exposure increases mutation rate through error-prone polymerases. Nat. Commun. 11 , 3664 (2020).
Goelen, T. et al. Bacterial phylogeny predicts volatile organic compound composition and olfactory response of an aphid parasitoid. Oikos 129 , 1415–1428 (2020).
Article ADS Google Scholar
Reher, T. et al. Evaluation of hop (Humulus lupulus) as a repellent for the management of Drosophila suzukii. Crop Prot. 124 , 104839 (2019).
Stein, S. E. An integrated method for spectrum extraction and compound identification from gas chromatography/mass spectrometry data. J. Am. Soc. Mass Spectrom. 10 , 770–781 (1999).
American Society of Brewing Chemists. Sensory Analysis Methods. (American Society of Brewing Chemists, St. Paul, MN, U.S.A., 1992).
McAuley, J., Leskovec, J. & Jurafsky, D. Learning Attitudes and Attributes from Multi-Aspect Reviews. Preprint at https://doi.org/10.48550/arXiv.1210.3926 (2012).
Meilgaard, M. C., Carr, B. T. & Carr, B. T. Sensory Evaluation Techniques. (CRC Press, Boca Raton). https://doi.org/10.1201/b16452 (2014).
Schreurs, M. et al. Data from: Predicting and improving complex beer flavor through machine learning. Zenodo https://doi.org/10.5281/zenodo.10653704 (2024).
Download references
Acknowledgements
We thank all lab members for their discussions and thank all tasting panel members for their contributions. Special thanks go out to Dr. Karin Voordeckers for her tremendous help in proofreading and improving the manuscript. M.S. was supported by a Baillet-Latour fellowship, L.C. acknowledges financial support from KU Leuven (C16/17/006), F.A.T. was supported by a PhD fellowship from FWO (1S08821N). Research in the lab of K.J.V. is supported by KU Leuven, FWO, VIB, VLAIO and the Brewing Science Serves Health Fund. Research in the lab of T.W. is supported by FWO (G.0A51.15) and KU Leuven (C16/17/006).
Author information
These authors contributed equally: Michiel Schreurs, Supinya Piampongsant, Miguel Roncoroni.
Authors and Affiliations
VIB—KU Leuven Center for Microbiology, Gaston Geenslaan 1, B-3001, Leuven, Belgium
Michiel Schreurs, Supinya Piampongsant, Miguel Roncoroni, Lloyd Cool, Beatriz Herrera-Malaver, Florian A. Theßeling & Kevin J. Verstrepen
CMPG Laboratory of Genetics and Genomics, KU Leuven, Gaston Geenslaan 1, B-3001, Leuven, Belgium
Leuven Institute for Beer Research (LIBR), Gaston Geenslaan 1, B-3001, Leuven, Belgium
Laboratory of Socioecology and Social Evolution, KU Leuven, Naamsestraat 59, B-3000, Leuven, Belgium
Lloyd Cool, Christophe Vanderaa & Tom Wenseleers
VIB Bioinformatics Core, VIB, Rijvisschestraat 120, B-9052, Ghent, Belgium
Łukasz Kreft & Alexander Botzki
AB InBev SA/NV, Brouwerijplein 1, B-3000, Leuven, Belgium
Philippe Malcorps & Luk Daenen
You can also search for this author in PubMed Google Scholar
Contributions
S.P., M.S. and K.J.V. conceived the experiments. S.P., M.S. and K.J.V. designed the experiments. S.P., M.S., M.R., B.H. and F.A.T. performed the experiments. S.P., M.S., L.C., C.V., L.K., A.B., P.M., L.D., T.W. and K.J.V. contributed analysis ideas. S.P., M.S., L.C., C.V., T.W. and K.J.V. analyzed the data. All authors contributed to writing the manuscript.
Corresponding author
Correspondence to Kevin J. Verstrepen .
Ethics declarations
Competing interests.
K.J.V. is affiliated with bar.on. The other authors declare no competing interests.
Peer review
Peer review information.
Nature Communications thanks Florian Bauer, Andrew John Macintosh and the other, anonymous, reviewer(s) for their contribution to the peer review of this work. A peer review file is available.
Additional information
Publisher’s note Springer Nature remains neutral with regard to jurisdictional claims in published maps and institutional affiliations.
Supplementary information
Supplementary information, peer review file, description of additional supplementary files, supplementary data 1, supplementary data 2, supplementary data 3, supplementary data 4, supplementary data 5, supplementary data 6, supplementary data 7, reporting summary, source data, source data, rights and permissions.
Open Access This article is licensed under a Creative Commons Attribution 4.0 International License, which permits use, sharing, adaptation, distribution and reproduction in any medium or format, as long as you give appropriate credit to the original author(s) and the source, provide a link to the Creative Commons licence, and indicate if changes were made. The images or other third party material in this article are included in the article’s Creative Commons licence, unless indicated otherwise in a credit line to the material. If material is not included in the article’s Creative Commons licence and your intended use is not permitted by statutory regulation or exceeds the permitted use, you will need to obtain permission directly from the copyright holder. To view a copy of this licence, visit http://creativecommons.org/licenses/by/4.0/ .
Reprints and permissions
About this article
Cite this article.
Schreurs, M., Piampongsant, S., Roncoroni, M. et al. Predicting and improving complex beer flavor through machine learning. Nat Commun 15 , 2368 (2024). https://doi.org/10.1038/s41467-024-46346-0
Download citation
Received : 30 October 2023
Accepted : 21 February 2024
Published : 26 March 2024
DOI : https://doi.org/10.1038/s41467-024-46346-0
Share this article
Anyone you share the following link with will be able to read this content:
Sorry, a shareable link is not currently available for this article.
Provided by the Springer Nature SharedIt content-sharing initiative
By submitting a comment you agree to abide by our Terms and Community Guidelines . If you find something abusive or that does not comply with our terms or guidelines please flag it as inappropriate.
Quick links
- Explore articles by subject
- Guide to authors
- Editorial policies
Sign up for the Nature Briefing: Translational Research newsletter — top stories in biotechnology, drug discovery and pharma.

Have a language expert improve your writing
Run a free plagiarism check in 10 minutes, generate accurate citations for free.
- Knowledge Base
Methodology
- What Is Qualitative Research? | Methods & Examples
What Is Qualitative Research? | Methods & Examples
Published on June 19, 2020 by Pritha Bhandari . Revised on June 22, 2023.
Qualitative research involves collecting and analyzing non-numerical data (e.g., text, video, or audio) to understand concepts, opinions, or experiences. It can be used to gather in-depth insights into a problem or generate new ideas for research.
Qualitative research is the opposite of quantitative research , which involves collecting and analyzing numerical data for statistical analysis.
Qualitative research is commonly used in the humanities and social sciences, in subjects such as anthropology, sociology, education, health sciences, history, etc.
- How does social media shape body image in teenagers?
- How do children and adults interpret healthy eating in the UK?
- What factors influence employee retention in a large organization?
- How is anxiety experienced around the world?
- How can teachers integrate social issues into science curriculums?
Table of contents
Approaches to qualitative research, qualitative research methods, qualitative data analysis, advantages of qualitative research, disadvantages of qualitative research, other interesting articles, frequently asked questions about qualitative research.
Qualitative research is used to understand how people experience the world. While there are many approaches to qualitative research, they tend to be flexible and focus on retaining rich meaning when interpreting data.
Common approaches include grounded theory, ethnography , action research , phenomenological research, and narrative research. They share some similarities, but emphasize different aims and perspectives.
Note that qualitative research is at risk for certain research biases including the Hawthorne effect , observer bias , recall bias , and social desirability bias . While not always totally avoidable, awareness of potential biases as you collect and analyze your data can prevent them from impacting your work too much.
Prevent plagiarism. Run a free check.
Each of the research approaches involve using one or more data collection methods . These are some of the most common qualitative methods:
- Observations: recording what you have seen, heard, or encountered in detailed field notes.
- Interviews: personally asking people questions in one-on-one conversations.
- Focus groups: asking questions and generating discussion among a group of people.
- Surveys : distributing questionnaires with open-ended questions.
- Secondary research: collecting existing data in the form of texts, images, audio or video recordings, etc.
- You take field notes with observations and reflect on your own experiences of the company culture.
- You distribute open-ended surveys to employees across all the company’s offices by email to find out if the culture varies across locations.
- You conduct in-depth interviews with employees in your office to learn about their experiences and perspectives in greater detail.
Qualitative researchers often consider themselves “instruments” in research because all observations, interpretations and analyses are filtered through their own personal lens.
For this reason, when writing up your methodology for qualitative research, it’s important to reflect on your approach and to thoroughly explain the choices you made in collecting and analyzing the data.
Qualitative data can take the form of texts, photos, videos and audio. For example, you might be working with interview transcripts, survey responses, fieldnotes, or recordings from natural settings.
Most types of qualitative data analysis share the same five steps:
- Prepare and organize your data. This may mean transcribing interviews or typing up fieldnotes.
- Review and explore your data. Examine the data for patterns or repeated ideas that emerge.
- Develop a data coding system. Based on your initial ideas, establish a set of codes that you can apply to categorize your data.
- Assign codes to the data. For example, in qualitative survey analysis, this may mean going through each participant’s responses and tagging them with codes in a spreadsheet. As you go through your data, you can create new codes to add to your system if necessary.
- Identify recurring themes. Link codes together into cohesive, overarching themes.
There are several specific approaches to analyzing qualitative data. Although these methods share similar processes, they emphasize different concepts.
Qualitative research often tries to preserve the voice and perspective of participants and can be adjusted as new research questions arise. Qualitative research is good for:
- Flexibility
The data collection and analysis process can be adapted as new ideas or patterns emerge. They are not rigidly decided beforehand.
- Natural settings
Data collection occurs in real-world contexts or in naturalistic ways.
- Meaningful insights
Detailed descriptions of people’s experiences, feelings and perceptions can be used in designing, testing or improving systems or products.
- Generation of new ideas
Open-ended responses mean that researchers can uncover novel problems or opportunities that they wouldn’t have thought of otherwise.
Receive feedback on language, structure, and formatting
Professional editors proofread and edit your paper by focusing on:
- Academic style
- Vague sentences
- Style consistency
See an example

Researchers must consider practical and theoretical limitations in analyzing and interpreting their data. Qualitative research suffers from:
- Unreliability
The real-world setting often makes qualitative research unreliable because of uncontrolled factors that affect the data.
- Subjectivity
Due to the researcher’s primary role in analyzing and interpreting data, qualitative research cannot be replicated . The researcher decides what is important and what is irrelevant in data analysis, so interpretations of the same data can vary greatly.
- Limited generalizability
Small samples are often used to gather detailed data about specific contexts. Despite rigorous analysis procedures, it is difficult to draw generalizable conclusions because the data may be biased and unrepresentative of the wider population .
- Labor-intensive
Although software can be used to manage and record large amounts of text, data analysis often has to be checked or performed manually.
If you want to know more about statistics , methodology , or research bias , make sure to check out some of our other articles with explanations and examples.
- Chi square goodness of fit test
- Degrees of freedom
- Null hypothesis
- Discourse analysis
- Control groups
- Mixed methods research
- Non-probability sampling
- Quantitative research
- Inclusion and exclusion criteria
Research bias
- Rosenthal effect
- Implicit bias
- Cognitive bias
- Selection bias
- Negativity bias
- Status quo bias
Quantitative research deals with numbers and statistics, while qualitative research deals with words and meanings.
Quantitative methods allow you to systematically measure variables and test hypotheses . Qualitative methods allow you to explore concepts and experiences in more detail.
There are five common approaches to qualitative research :
- Grounded theory involves collecting data in order to develop new theories.
- Ethnography involves immersing yourself in a group or organization to understand its culture.
- Narrative research involves interpreting stories to understand how people make sense of their experiences and perceptions.
- Phenomenological research involves investigating phenomena through people’s lived experiences.
- Action research links theory and practice in several cycles to drive innovative changes.
Data collection is the systematic process by which observations or measurements are gathered in research. It is used in many different contexts by academics, governments, businesses, and other organizations.
There are various approaches to qualitative data analysis , but they all share five steps in common:
- Prepare and organize your data.
- Review and explore your data.
- Develop a data coding system.
- Assign codes to the data.
- Identify recurring themes.
The specifics of each step depend on the focus of the analysis. Some common approaches include textual analysis , thematic analysis , and discourse analysis .
Cite this Scribbr article
If you want to cite this source, you can copy and paste the citation or click the “Cite this Scribbr article” button to automatically add the citation to our free Citation Generator.
Bhandari, P. (2023, June 22). What Is Qualitative Research? | Methods & Examples. Scribbr. Retrieved April 8, 2024, from https://www.scribbr.com/methodology/qualitative-research/
Is this article helpful?

Pritha Bhandari
Other students also liked, qualitative vs. quantitative research | differences, examples & methods, how to do thematic analysis | step-by-step guide & examples, unlimited academic ai-proofreading.
✔ Document error-free in 5minutes ✔ Unlimited document corrections ✔ Specialized in correcting academic texts
IMAGES
VIDEO
COMMENTS
How to Write Research Methodology. Writing a research methodology involves explaining the methods and techniques you used to conduct research, collect data, and analyze results. It's an essential section of any research paper or thesis, as it helps readers understand the validity and reliability of your findings. Here are the steps to write a ...
Step 1: Explain your methodological approach. Step 2: Describe your data collection methods. Step 3: Describe your analysis method. Step 4: Evaluate and justify the methodological choices you made. Tips for writing a strong methodology chapter. Other interesting articles.
Your Methods Section contextualizes the results of your study, giving editors, reviewers and readers alike the information they need to understand and interpret your work. Your methods are key to establishing the credibility of your study, along with your data and the results themselves. A complete methods section should provide enough detail ...
Research methods are specific procedures for collecting and analyzing data. Developing your research methods is an integral part of your research design. When planning your methods, there are two key decisions you will make. First, decide how you will collect data. Your methods depend on what type of data you need to answer your research question:
Provide the rationality behind your chosen approach. Based on logic and reason, let your readers know why you have chosen said research methodologies. Additionally, you have to build strong arguments supporting why your chosen research method is the best way to achieve the desired outcome. 3. Explain your mechanism.
Research papers in the social and natural sciences often follow APA style. This article focuses on reporting quantitative research methods. In your APA methods section, you should report enough information to understand and replicate your study, including detailed information on the sample, measures, and procedures used.
Methodology in research is defined as the systematic method to resolve a research problem through data gathering using various techniques, providing an interpretation of data gathered and drawing conclusions about the research data. Essentially, a research methodology is the blueprint of a research or study (Murthy & Bhojanna, 2009, p. 32).
Revised on 10 October 2022. Your research methodology discusses and explains the data collection and analysis methods you used in your research. A key part of your thesis, dissertation, or research paper, the methodology chapter explains what you did and how you did it, allowing readers to evaluate the reliability and validity of your research.
About Research Methods. This guide provides an overview of research methods, how to choose and use them, and supports and resources at UC Berkeley. As Patten and Newhart note in the book Understanding Research Methods, "Research methods are the building blocks of the scientific enterprise. They are the "how" for building systematic knowledge.
A quantitative approach and statistical analysis would give you a bigger picture. 3. Identify how your analysis answers your research questions. Relate your methodology back to your original research questions and present a proposed outcome based on your analysis.
4. Use subheadings: Dividing the Methods section in terms of the experiments helps the reader to follow the section better. You may write the specific objective of each experiment as a subheading. Alternatively, if applicable, the name of each experiment can also be used as subheading. 5.
Unlike in quantitative research where hypotheses are usually developed to be tested, qualitative research can lead to both hypothesis-testing and hypothesis-generating outcomes.2 When studies require both quantitative and qualitative research questions, this suggests an integrative process between both research methods wherein a single mixed ...
Table of contents. Step 1: Consider your aims and approach. Step 2: Choose a type of research design. Step 3: Identify your population and sampling method. Step 4: Choose your data collection methods. Step 5: Plan your data collection procedures. Step 6: Decide on your data analysis strategies.
Writing the Research Paper. Write a detailed outline. Almost the rough content of every paragraph. The order of the various topics in your paper. On the basis of the outline, start writing a part by planning the content, and then write it down. Put a visible mark (which you will later delete) where you need to quote a source, and write in the ...
Definition, Types, and Examples. Research methodology 1,2 is a structured and scientific approach used to collect, analyze, and interpret quantitative or qualitative data to answer research questions or test hypotheses. A research methodology is like a plan for carrying out research and helps keep researchers on track by limiting the scope of ...
Learn how to write a strong methodology chapter that allows readers to evaluate the reliability and validity of the research. A good methodology chapter incl...
Choosing an optimal research methodology is crucial for the success of any research project. The methodology you select will determine the type of data you collect, how you collect it, and how you analyse it. Understanding the different types of research methods available along with their strengths and weaknesses, is thus imperative to make an ...
A research design is a strategy for answering your research question using empirical data. Creating a research design means making decisions about: Your overall research objectives and approach. Whether you'll rely on primary research or secondary research. Your sampling methods or criteria for selecting subjects. Your data collection methods.
Methods section is a crucial part of a manuscript and emphasizes the reliability and validity of a research study. And knowing how to write the methods section of a research paper is the first step in mastering scientific writing. Read this article to understand the importance, purpose, and the best way to write the methods section of a research paper.
Literature reviews offer a critical synthesis of empirical and theoretical literature to assess the strength of evidence, develop guidelines for practice and policymaking, and identify areas for future research.1 It is often essential and usually the first task in any research endeavour, particularly in masters or doctoral level education. For effective data extraction and rigorous synthesis ...
Writing Up Research. Writing a research paper means entering into a conversation that is already occurring in the field. Your paper will explain the current state of the topic (what others are saying), your addition to the topic (what you say about the topic), and what it all means. The following tips and techniques for writing academic papers ...
Proficient in data gathering and adept at structuring qualitative research assignments, these professionals can significantly elevate your academic results. 8. Surveys. This method is mostly used ...
A research plan is a document that outlines the research objectives and how the research will be executed. Research plans should include: The research goals or questions that the research is hoping to achieve or answer; The method to be used and a description of how it will be carried out; The tasks or questions that will be given to study ...
Show how your research addresses a gap or contributes to a debate; Evaluate the current state of research and demonstrate your knowledge of the scholarly debates around your topic. Writing literature reviews is a particularly important skill if you want to apply for graduate school or pursue a career in research. We've written a step-by-step ...
Interestingly, different beer styles show distinct patterns for some flavor compounds (Supplementary Fig. S3).These observations agree with expectations for key beer styles, and serve as a control ...
Plan-Do-Study-Act Directions and Examples. The Plan-Do-Study-Act (PDSA) method is a way to test a change that is implemented. Going through the prescribed four steps guides the thinking process into breaking down the task into steps and then evaluating the outcome, improving on it, and testing again. Most of us go through some or all of these ...
Qualitative research involves collecting and analyzing non-numerical data (e.g., text, video, or audio) to understand concepts, opinions, or experiences. It can be used to gather in-depth insights into a problem or generate new ideas for research. Qualitative research is the opposite of quantitative research, which involves collecting and ...