

Operational Hypothesis
An Operational Hypothesis is a testable statement or prediction made in research that not only proposes a relationship between two or more variables but also clearly defines those variables in operational terms, meaning how they will be measured or manipulated within the study. It forms the basis of an experiment that seeks to prove or disprove the assumed relationship, thus helping to drive scientific research.
The Core Components of an Operational Hypothesis
Understanding an operational hypothesis involves identifying its key components and how they interact.
The Variables
An operational hypothesis must contain two or more variables — factors that can be manipulated, controlled, or measured in an experiment.
The Proposed Relationship
Beyond identifying the variables, an operational hypothesis specifies the type of relationship expected between them. This could be a correlation, a cause-and-effect relationship, or another type of association.
The Importance of Operationalizing Variables
Operationalizing variables — defining them in measurable terms — is a critical step in forming an operational hypothesis. This process ensures the variables are quantifiable, enhancing the reliability and validity of the research.
Constructing an Operational Hypothesis
Creating an operational hypothesis is a fundamental step in the scientific method and research process. It involves generating a precise, testable statement that predicts the outcome of a study based on the research question. An operational hypothesis must clearly identify and define the variables under study and describe the expected relationship between them. The process of creating an operational hypothesis involves several key steps:
Steps to Construct an Operational Hypothesis
- Define the Research Question : Start by clearly identifying the research question. This question should highlight the key aspect or phenomenon that the study aims to investigate.
- Identify the Variables : Next, identify the key variables in your study. Variables are elements that you will measure, control, or manipulate in your research. There are typically two types of variables in a hypothesis: the independent variable (the cause) and the dependent variable (the effect).
- Operationalize the Variables : Once you’ve identified the variables, you must operationalize them. This involves defining your variables in such a way that they can be easily measured, manipulated, or controlled during the experiment.
- Predict the Relationship : The final step involves predicting the relationship between the variables. This could be an increase, decrease, or any other type of correlation between the independent and dependent variables.
By following these steps, you will create an operational hypothesis that provides a clear direction for your research, ensuring that your study is grounded in a testable prediction.
Evaluating the Strength of an Operational Hypothesis
Not all operational hypotheses are created equal. The strength of an operational hypothesis can significantly influence the validity of a study. There are several key factors that contribute to the strength of an operational hypothesis:
- Clarity : A strong operational hypothesis is clear and unambiguous. It precisely defines all variables and the expected relationship between them.
- Testability : A key feature of an operational hypothesis is that it must be testable. That is, it should predict an outcome that can be observed and measured.
- Operationalization of Variables : The operationalization of variables contributes to the strength of an operational hypothesis. When variables are clearly defined in measurable terms, it enhances the reliability of the study.
- Alignment with Research : Finally, a strong operational hypothesis aligns closely with the research question and the overall goals of the study.
By carefully crafting and evaluating an operational hypothesis, researchers can ensure that their work provides valuable, valid, and actionable insights.
Examples of Operational Hypotheses
To illustrate the concept further, this section will provide examples of well-constructed operational hypotheses in various research fields.
The operational hypothesis is a fundamental component of scientific inquiry, guiding the research design and providing a clear framework for testing assumptions. By understanding how to construct and evaluate an operational hypothesis, we can ensure our research is both rigorous and meaningful.
Examples of Operational Hypothesis:
- In Education : An operational hypothesis in an educational study might be: “Students who receive tutoring (Independent Variable) will show a 20% improvement in standardized test scores (Dependent Variable) compared to students who did not receive tutoring.”
- In Psychology : In a psychological study, an operational hypothesis could be: “Individuals who meditate for 20 minutes each day (Independent Variable) will report a 15% decrease in self-reported stress levels (Dependent Variable) after eight weeks compared to those who do not meditate.”
- In Health Science : An operational hypothesis in a health science study might be: “Participants who drink eight glasses of water daily (Independent Variable) will show a 10% decrease in reported fatigue levels (Dependent Variable) after three weeks compared to those who drink four glasses of water daily.”
- In Environmental Science : In an environmental study, an operational hypothesis could be: “Cities that implement recycling programs (Independent Variable) will see a 25% reduction in landfill waste (Dependent Variable) after one year compared to cities without recycling programs.”
Have a language expert improve your writing
Run a free plagiarism check in 10 minutes, automatically generate references for free.
- Knowledge Base
- Dissertation
- Operationalisation | A Guide with Examples, Pros & Cons
Operationalisation | A Guide with Examples, Pros & Cons
Published on 6 May 2022 by Pritha Bhandari . Revised on 10 October 2022.
Operationalisation means turning abstract concepts into measurable observations. Although some concepts, like height or age, are easily measured, others, like spirituality or anxiety, are not.
Through operationalisation, you can systematically collect data on processes and phenomena that aren’t directly observable.
- Self-rating scores on a social anxiety scale
- Number of recent behavioural incidents of avoidance of crowded places
- Intensity of physical anxiety symptoms in social situations
Instantly correct all language mistakes in your text
Be assured that you'll submit flawless writing. Upload your document to correct all your mistakes.

Table of contents
Why operationalisation matters, how to operationalise concepts, strengths of operationalisation, limitations of operationalisation, frequently asked questions about operationalisation.
In quantitative research , it’s important to precisely define the variables that you want to study.
Without transparent and specific operational definitions, researchers may measure irrelevant concepts or inconsistently apply methods. Operationalisation reduces subjectivity and increases the reliability of your study.
Your choice of operational definition can sometimes affect your results. For example, an experimental intervention for social anxiety may reduce self-rating anxiety scores but not behavioural avoidance of crowded places. This means that your results are context-specific and may not generalise to different real-life settings.
Generally, abstract concepts can be operationalised in many different ways. These differences mean that you may actually measure slightly different aspects of a concept, so it’s important to be specific about what you are measuring.
If you test a hypothesis using multiple operationalisations of a concept, you can check whether your results depend on the type of measure that you use. If your results don’t vary when you use different measures, then they are said to be ‘robust’.
The only proofreading tool specialized in correcting academic writing
The academic proofreading tool has been trained on 1000s of academic texts and by native English editors. Making it the most accurate and reliable proofreading tool for students.

Correct my document today
There are three main steps for operationalisation:
- Identify the main concepts you are interested in studying.
- Choose a variable to represent each of the concepts.
- Select indicators for each of your variables.
Step 1: Identify the main concepts you are interested in studying
Based on your research interests and goals, define your topic and come up with an initial research question .
There are two main concepts in your research question:
- Social media behaviour
Step 2: Choose a variable to represent each of the concepts
Your main concepts may each have many variables , or properties, that you can measure.
For instance, are you going to measure the amount of sleep or the quality of sleep? And are you going to measure how often teenagers use social media, which social media they use, or when they use it?
- Alternate hypothesis: Lower quality of sleep is related to higher night-time social media use in teenagers.
- Null hypothesis: There is no relation between quality of sleep and night-time social media use in teenagers.
Step 3: Select indicators for each of your variables
To measure your variables, decide on indicators that can represent them numerically.
Sometimes these indicators will be obvious: for example, the amount of sleep is represented by the number of hours per night. But a variable like sleep quality is harder to measure.
You can come up with practical ideas for how to measure variables based on previously published studies. These may include established scales or questionnaires that you can distribute to your participants. If none are available that are appropriate for your sample, you can develop your own scales or questionnaires.
- To measure sleep quality, you give participants wristbands that track sleep phases.
- To measure night-time social media use, you create a questionnaire that asks participants to track how much time they spend using social media in bed.
After operationalising your concepts, it’s important to report your study variables and indicators when writing up your methodology section. You can evaluate how your choice of operationalisation may have affected your results or interpretations in the discussion section.
Operationalisation makes it possible to consistently measure variables across different contexts.
Scientific research is based on observable and measurable findings. Operational definitions break down intangible concepts into recordable characteristics.
Objectivity
A standardised approach for collecting data leaves little room for subjective or biased personal interpretations of observations.
Reliability
A good operationalisation can be used consistently by other researchers. If other people measure the same thing using your operational definition, they should all get the same results.
Operational definitions of concepts can sometimes be problematic.
Underdetermination
Many concepts vary across different time periods and social settings.
For example, poverty is a worldwide phenomenon, but the exact income level that determines poverty can differ significantly across countries.
Reductiveness
Operational definitions can easily miss meaningful and subjective perceptions of concepts by trying to reduce complex concepts to numbers.
For example, asking consumers to rate their satisfaction with a service on a 5-point scale will tell you nothing about why they felt that way.
Lack of universality
Context-specific operationalisations help preserve real-life experiences, but make it hard to compare studies if the measures differ significantly.
For example, corruption can be operationalised in a wide range of ways (e.g., perceptions of corrupt business practices, or frequency of bribe requests from public officials), but the measures may not consistently reflect the same concept.
Prevent plagiarism, run a free check.
Operationalisation means turning abstract conceptual ideas into measurable observations.
For example, the concept of social anxiety isn’t directly observable, but it can be operationally defined in terms of self-rating scores, behavioural avoidance of crowded places, or physical anxiety symptoms in social situations.
Before collecting data , it’s important to consider how you will operationalise the variables that you want to measure.
In scientific research, concepts are the abstract ideas or phenomena that are being studied (e.g., educational achievement). Variables are properties or characteristics of the concept (e.g., performance at school), while indicators are ways of measuring or quantifying variables (e.g., yearly grade reports).
The process of turning abstract concepts into measurable variables and indicators is called operationalisation .
Reliability and validity are both about how well a method measures something:
- Reliability refers to the consistency of a measure (whether the results can be reproduced under the same conditions).
- Validity refers to the accuracy of a measure (whether the results really do represent what they are supposed to measure).
If you are doing experimental research , you also have to consider the internal and external validity of your experiment.
Cite this Scribbr article
If you want to cite this source, you can copy and paste the citation or click the ‘Cite this Scribbr article’ button to automatically add the citation to our free Reference Generator.
Bhandari, P. (2022, October 10). Operationalisation | A Guide with Examples, Pros & Cons. Scribbr. Retrieved 22 April 2024, from https://www.scribbr.co.uk/thesis-dissertation/operationalisation/
Is this article helpful?

Pritha Bhandari
- cognitive sophistication
- tolerance of diversity
- exposure to higher levels of math or science
- age (which is currently related to educational level in many countries)
- social class and other variables.
- For example, suppose you designed a treatment to help people stop smoking. Because you are really dedicated, you assigned the same individuals simultaneously to (1) a "stop smoking" nicotine patch; (2) a "quit buddy"; and (3) a discussion support group. Compared with a group in which no intervention at all occurred, your experimental group now smokes 10 fewer cigarettes per day.
- There is no relationship among two or more variables (EXAMPLE: the correlation between educational level and income is zero)
- Or that two or more populations or subpopulations are essentially the same (EXAMPLE: women and men have the same average science knowledge scores.)
- the difference between two and three children = one child.
- the difference between eight and nine children also = one child.
- the difference between completing ninth grade and tenth grade is one year of school
- the difference between completing junior and senior year of college is one year of school
- In addition to all the properties of nominal, ordinal, and interval variables, ratio variables also have a fixed/non-arbitrary zero point. Non arbitrary means that it is impossible to go below a score of zero for that variable. For example, any bottom score on IQ or aptitude tests is created by human beings and not nature. On the other hand, scientists believe they have isolated an "absolute zero." You can't get colder than that.
- Resources Home 🏠
- Try SciSpace Copilot
- Search research papers
- Add Copilot Extension
- Try AI Detector
- Try Paraphraser
- Try Citation Generator
- April Papers
- June Papers
- July Papers

The Craft of Writing a Strong Hypothesis

Table of Contents
Writing a hypothesis is one of the essential elements of a scientific research paper. It needs to be to the point, clearly communicating what your research is trying to accomplish. A blurry, drawn-out, or complexly-structured hypothesis can confuse your readers. Or worse, the editor and peer reviewers.
A captivating hypothesis is not too intricate. This blog will take you through the process so that, by the end of it, you have a better idea of how to convey your research paper's intent in just one sentence.
What is a Hypothesis?
The first step in your scientific endeavor, a hypothesis, is a strong, concise statement that forms the basis of your research. It is not the same as a thesis statement , which is a brief summary of your research paper .
The sole purpose of a hypothesis is to predict your paper's findings, data, and conclusion. It comes from a place of curiosity and intuition . When you write a hypothesis, you're essentially making an educated guess based on scientific prejudices and evidence, which is further proven or disproven through the scientific method.
The reason for undertaking research is to observe a specific phenomenon. A hypothesis, therefore, lays out what the said phenomenon is. And it does so through two variables, an independent and dependent variable.
The independent variable is the cause behind the observation, while the dependent variable is the effect of the cause. A good example of this is “mixing red and blue forms purple.” In this hypothesis, mixing red and blue is the independent variable as you're combining the two colors at your own will. The formation of purple is the dependent variable as, in this case, it is conditional to the independent variable.
Different Types of Hypotheses

Types of hypotheses
Some would stand by the notion that there are only two types of hypotheses: a Null hypothesis and an Alternative hypothesis. While that may have some truth to it, it would be better to fully distinguish the most common forms as these terms come up so often, which might leave you out of context.
Apart from Null and Alternative, there are Complex, Simple, Directional, Non-Directional, Statistical, and Associative and casual hypotheses. They don't necessarily have to be exclusive, as one hypothesis can tick many boxes, but knowing the distinctions between them will make it easier for you to construct your own.
1. Null hypothesis
A null hypothesis proposes no relationship between two variables. Denoted by H 0 , it is a negative statement like “Attending physiotherapy sessions does not affect athletes' on-field performance.” Here, the author claims physiotherapy sessions have no effect on on-field performances. Even if there is, it's only a coincidence.
2. Alternative hypothesis
Considered to be the opposite of a null hypothesis, an alternative hypothesis is donated as H1 or Ha. It explicitly states that the dependent variable affects the independent variable. A good alternative hypothesis example is “Attending physiotherapy sessions improves athletes' on-field performance.” or “Water evaporates at 100 °C. ” The alternative hypothesis further branches into directional and non-directional.
- Directional hypothesis: A hypothesis that states the result would be either positive or negative is called directional hypothesis. It accompanies H1 with either the ‘<' or ‘>' sign.
- Non-directional hypothesis: A non-directional hypothesis only claims an effect on the dependent variable. It does not clarify whether the result would be positive or negative. The sign for a non-directional hypothesis is ‘≠.'
3. Simple hypothesis
A simple hypothesis is a statement made to reflect the relation between exactly two variables. One independent and one dependent. Consider the example, “Smoking is a prominent cause of lung cancer." The dependent variable, lung cancer, is dependent on the independent variable, smoking.
4. Complex hypothesis
In contrast to a simple hypothesis, a complex hypothesis implies the relationship between multiple independent and dependent variables. For instance, “Individuals who eat more fruits tend to have higher immunity, lesser cholesterol, and high metabolism.” The independent variable is eating more fruits, while the dependent variables are higher immunity, lesser cholesterol, and high metabolism.
5. Associative and casual hypothesis
Associative and casual hypotheses don't exhibit how many variables there will be. They define the relationship between the variables. In an associative hypothesis, changing any one variable, dependent or independent, affects others. In a casual hypothesis, the independent variable directly affects the dependent.
6. Empirical hypothesis
Also referred to as the working hypothesis, an empirical hypothesis claims a theory's validation via experiments and observation. This way, the statement appears justifiable and different from a wild guess.
Say, the hypothesis is “Women who take iron tablets face a lesser risk of anemia than those who take vitamin B12.” This is an example of an empirical hypothesis where the researcher the statement after assessing a group of women who take iron tablets and charting the findings.
7. Statistical hypothesis
The point of a statistical hypothesis is to test an already existing hypothesis by studying a population sample. Hypothesis like “44% of the Indian population belong in the age group of 22-27.” leverage evidence to prove or disprove a particular statement.
Characteristics of a Good Hypothesis
Writing a hypothesis is essential as it can make or break your research for you. That includes your chances of getting published in a journal. So when you're designing one, keep an eye out for these pointers:
- A research hypothesis has to be simple yet clear to look justifiable enough.
- It has to be testable — your research would be rendered pointless if too far-fetched into reality or limited by technology.
- It has to be precise about the results —what you are trying to do and achieve through it should come out in your hypothesis.
- A research hypothesis should be self-explanatory, leaving no doubt in the reader's mind.
- If you are developing a relational hypothesis, you need to include the variables and establish an appropriate relationship among them.
- A hypothesis must keep and reflect the scope for further investigations and experiments.
Separating a Hypothesis from a Prediction
Outside of academia, hypothesis and prediction are often used interchangeably. In research writing, this is not only confusing but also incorrect. And although a hypothesis and prediction are guesses at their core, there are many differences between them.
A hypothesis is an educated guess or even a testable prediction validated through research. It aims to analyze the gathered evidence and facts to define a relationship between variables and put forth a logical explanation behind the nature of events.
Predictions are assumptions or expected outcomes made without any backing evidence. They are more fictionally inclined regardless of where they originate from.
For this reason, a hypothesis holds much more weight than a prediction. It sticks to the scientific method rather than pure guesswork. "Planets revolve around the Sun." is an example of a hypothesis as it is previous knowledge and observed trends. Additionally, we can test it through the scientific method.
Whereas "COVID-19 will be eradicated by 2030." is a prediction. Even though it results from past trends, we can't prove or disprove it. So, the only way this gets validated is to wait and watch if COVID-19 cases end by 2030.
Finally, How to Write a Hypothesis

Quick tips on writing a hypothesis
1. Be clear about your research question
A hypothesis should instantly address the research question or the problem statement. To do so, you need to ask a question. Understand the constraints of your undertaken research topic and then formulate a simple and topic-centric problem. Only after that can you develop a hypothesis and further test for evidence.
2. Carry out a recce
Once you have your research's foundation laid out, it would be best to conduct preliminary research. Go through previous theories, academic papers, data, and experiments before you start curating your research hypothesis. It will give you an idea of your hypothesis's viability or originality.
Making use of references from relevant research papers helps draft a good research hypothesis. SciSpace Discover offers a repository of over 270 million research papers to browse through and gain a deeper understanding of related studies on a particular topic. Additionally, you can use SciSpace Copilot , your AI research assistant, for reading any lengthy research paper and getting a more summarized context of it. A hypothesis can be formed after evaluating many such summarized research papers. Copilot also offers explanations for theories and equations, explains paper in simplified version, allows you to highlight any text in the paper or clip math equations and tables and provides a deeper, clear understanding of what is being said. This can improve the hypothesis by helping you identify potential research gaps.
3. Create a 3-dimensional hypothesis
Variables are an essential part of any reasonable hypothesis. So, identify your independent and dependent variable(s) and form a correlation between them. The ideal way to do this is to write the hypothetical assumption in the ‘if-then' form. If you use this form, make sure that you state the predefined relationship between the variables.
In another way, you can choose to present your hypothesis as a comparison between two variables. Here, you must specify the difference you expect to observe in the results.
4. Write the first draft
Now that everything is in place, it's time to write your hypothesis. For starters, create the first draft. In this version, write what you expect to find from your research.
Clearly separate your independent and dependent variables and the link between them. Don't fixate on syntax at this stage. The goal is to ensure your hypothesis addresses the issue.
5. Proof your hypothesis
After preparing the first draft of your hypothesis, you need to inspect it thoroughly. It should tick all the boxes, like being concise, straightforward, relevant, and accurate. Your final hypothesis has to be well-structured as well.
Research projects are an exciting and crucial part of being a scholar. And once you have your research question, you need a great hypothesis to begin conducting research. Thus, knowing how to write a hypothesis is very important.
Now that you have a firmer grasp on what a good hypothesis constitutes, the different kinds there are, and what process to follow, you will find it much easier to write your hypothesis, which ultimately helps your research.
Now it's easier than ever to streamline your research workflow with SciSpace Discover . Its integrated, comprehensive end-to-end platform for research allows scholars to easily discover, write and publish their research and fosters collaboration.
It includes everything you need, including a repository of over 270 million research papers across disciplines, SEO-optimized summaries and public profiles to show your expertise and experience.
If you found these tips on writing a research hypothesis useful, head over to our blog on Statistical Hypothesis Testing to learn about the top researchers, papers, and institutions in this domain.
Frequently Asked Questions (FAQs)
1. what is the definition of hypothesis.
According to the Oxford dictionary, a hypothesis is defined as “An idea or explanation of something that is based on a few known facts, but that has not yet been proved to be true or correct”.
2. What is an example of hypothesis?
The hypothesis is a statement that proposes a relationship between two or more variables. An example: "If we increase the number of new users who join our platform by 25%, then we will see an increase in revenue."
3. What is an example of null hypothesis?
A null hypothesis is a statement that there is no relationship between two variables. The null hypothesis is written as H0. The null hypothesis states that there is no effect. For example, if you're studying whether or not a particular type of exercise increases strength, your null hypothesis will be "there is no difference in strength between people who exercise and people who don't."
4. What are the types of research?
• Fundamental research
• Applied research
• Qualitative research
• Quantitative research
• Mixed research
• Exploratory research
• Longitudinal research
• Cross-sectional research
• Field research
• Laboratory research
• Fixed research
• Flexible research
• Action research
• Policy research
• Classification research
• Comparative research
• Causal research
• Inductive research
• Deductive research
5. How to write a hypothesis?
• Your hypothesis should be able to predict the relationship and outcome.
• Avoid wordiness by keeping it simple and brief.
• Your hypothesis should contain observable and testable outcomes.
• Your hypothesis should be relevant to the research question.
6. What are the 2 types of hypothesis?
• Null hypotheses are used to test the claim that "there is no difference between two groups of data".
• Alternative hypotheses test the claim that "there is a difference between two data groups".
7. Difference between research question and research hypothesis?
A research question is a broad, open-ended question you will try to answer through your research. A hypothesis is a statement based on prior research or theory that you expect to be true due to your study. Example - Research question: What are the factors that influence the adoption of the new technology? Research hypothesis: There is a positive relationship between age, education and income level with the adoption of the new technology.
8. What is plural for hypothesis?
The plural of hypothesis is hypotheses. Here's an example of how it would be used in a statement, "Numerous well-considered hypotheses are presented in this part, and they are supported by tables and figures that are well-illustrated."
9. What is the red queen hypothesis?
The red queen hypothesis in evolutionary biology states that species must constantly evolve to avoid extinction because if they don't, they will be outcompeted by other species that are evolving. Leigh Van Valen first proposed it in 1973; since then, it has been tested and substantiated many times.
10. Who is known as the father of null hypothesis?
The father of the null hypothesis is Sir Ronald Fisher. He published a paper in 1925 that introduced the concept of null hypothesis testing, and he was also the first to use the term itself.
11. When to reject null hypothesis?
You need to find a significant difference between your two populations to reject the null hypothesis. You can determine that by running statistical tests such as an independent sample t-test or a dependent sample t-test. You should reject the null hypothesis if the p-value is less than 0.05.
You might also like

Consensus GPT vs. SciSpace GPT: Choose the Best GPT for Research

Literature Review and Theoretical Framework: Understanding the Differences

Types of Essays in Academic Writing - Quick Guide (2024)
The Research Hypothesis: Role and Construction
- First Online: 01 January 2012
Cite this chapter

- Phyllis G. Supino EdD 3
5991 Accesses
A hypothesis is a logical construct, interposed between a problem and its solution, which represents a proposed answer to a research question. It gives direction to the investigator’s thinking about the problem and, therefore, facilitates a solution. There are three primary modes of inference by which hypotheses are developed: deduction (reasoning from a general propositions to specific instances), induction (reasoning from specific instances to a general proposition), and abduction (formulation/acceptance on probation of a hypothesis to explain a surprising observation).
A research hypothesis should reflect an inference about variables; be stated as a grammatically complete, declarative sentence; be expressed simply and unambiguously; provide an adequate answer to the research problem; and be testable. Hypotheses can be classified as conceptual versus operational, single versus bi- or multivariable, causal or not causal, mechanistic versus nonmechanistic, and null or alternative. Hypotheses most commonly entail statements about “variables” which, in turn, can be classified according to their level of measurement (scaling characteristics) or according to their role in the hypothesis (independent, dependent, moderator, control, or intervening).
A hypothesis is rendered operational when its broadly (conceptually) stated variables are replaced by operational definitions of those variables. Hypotheses stated in this manner are called operational hypotheses, specific hypotheses, or predictions and facilitate testing.
Wrong hypotheses, rightly worked from, have produced more results than unguided observation
—Augustus De Morgan, 1872[ 1 ]—
This is a preview of subscription content, log in via an institution to check access.
Access this chapter
- Available as PDF
- Read on any device
- Instant download
- Own it forever
- Available as EPUB and PDF
- Compact, lightweight edition
- Dispatched in 3 to 5 business days
- Free shipping worldwide - see info
- Durable hardcover edition
Tax calculation will be finalised at checkout
Purchases are for personal use only
Institutional subscriptions
De Morgan A, De Morgan S. A budget of paradoxes. London: Longmans Green; 1872.
Google Scholar
Leedy Paul D. Practical research. Planning and design. 2nd ed. New York: Macmillan; 1960.
Bernard C. Introduction to the study of experimental medicine. New York: Dover; 1957.
Erren TC. The quest for questions—on the logical force of science. Med Hypotheses. 2004;62:635–40.
Article PubMed Google Scholar
Peirce CS. Collected papers of Charles Sanders Peirce, vol. 7. In: Hartshorne C, Weiss P, editors. Boston: The Belknap Press of Harvard University Press; 1966.
Aristotle. The complete works of Aristotle: the revised Oxford Translation. In: Barnes J, editor. vol. 2. Princeton/New Jersey: Princeton University Press; 1984.
Polit D, Beck CT. Conceptualizing a study to generate evidence for nursing. In: Polit D, Beck CT, editors. Nursing research: generating and assessing evidence for nursing practice. 8th ed. Philadelphia: Wolters Kluwer/Lippincott Williams and Wilkins; 2008. Chapter 4.
Jenicek M, Hitchcock DL. Evidence-based practice. Logic and critical thinking in medicine. Chicago: AMA Press; 2005.
Bacon F. The novum organon or a true guide to the interpretation of nature. A new translation by the Rev G.W. Kitchin. Oxford: The University Press; 1855.
Popper KR. Objective knowledge: an evolutionary approach (revised edition). New York: Oxford University Press; 1979.
Morgan AJ, Parker S. Translational mini-review series on vaccines: the Edward Jenner Museum and the history of vaccination. Clin Exp Immunol. 2007;147:389–94.
Article PubMed CAS Google Scholar
Pead PJ. Benjamin Jesty: new light in the dawn of vaccination. Lancet. 2003;362:2104–9.
Lee JA. The scientific endeavor: a primer on scientific principles and practice. San Francisco: Addison-Wesley Longman; 2000.
Allchin D. Lawson’s shoehorn, or should the philosophy of science be rated, ‘X’? Science and Education. 2003;12:315–29.
Article Google Scholar
Lawson AE. What is the role of induction and deduction in reasoning and scientific inquiry? J Res Sci Teach. 2005;42:716–40.
Peirce CS. Collected papers of Charles Sanders Peirce, vol. 2. In: Hartshorne C, Weiss P, editors. Boston: The Belknap Press of Harvard University Press; 1965.
Bonfantini MA, Proni G. To guess or not to guess? In: Eco U, Sebeok T, editors. The sign of three: Dupin, Holmes, Peirce. Bloomington: Indiana University Press; 1983. Chapter 5.
Peirce CS. Collected papers of Charles Sanders Peirce, vol. 5. In: Hartshorne C, Weiss P, editors. Boston: The Belknap Press of Harvard University Press; 1965.
Flach PA, Kakas AC. Abductive and inductive reasoning: background issues. In: Flach PA, Kakas AC, editors. Abduction and induction. Essays on their relation and integration. The Netherlands: Klewer; 2000. Chapter 1.
Murray JF. Voltaire, Walpole and Pasteur: variations on the theme of discovery. Am J Respir Crit Care Med. 2005;172:423–6.
Danemark B, Ekstrom M, Jakobsen L, Karlsson JC. Methodological implications, generalization, scientific inference, models (Part II) In: explaining society. Critical realism in the social sciences. New York: Routledge; 2002.
Pasteur L. Inaugural lecture as professor and dean of the faculty of sciences. In: Peterson H, editor. A treasury of the world’s greatest speeches. Douai, France: University of Lille 7 Dec 1954.
Swineburne R. Simplicity as evidence for truth. Milwaukee: Marquette University Press; 1997.
Sakar S, editor. Logical empiricism at its peak: Schlick, Carnap and Neurath. New York: Garland; 1996.
Popper K. The logic of scientific discovery. New York: Basic Books; 1959. 1934, trans. 1959.
Caws P. The philosophy of science. Princeton: D. Van Nostrand Company; 1965.
Popper K. Conjectures and refutations. The growth of scientific knowledge. 4th ed. London: Routledge and Keegan Paul; 1972.
Feyerabend PK. Against method, outline of an anarchistic theory of knowledge. London, UK: Verso; 1978.
Smith PG. Popper: conjectures and refutations (Chapter IV). In: Theory and reality: an introduction to the philosophy of science. Chicago: University of Chicago Press; 2003.
Blystone RV, Blodgett K. WWW: the scientific method. CBE Life Sci Educ. 2006;5:7–11.
Kleinbaum DG, Kupper LL, Morgenstern H. Epidemiological research. Principles and quantitative methods. New York: Van Nostrand Reinhold; 1982.
Fortune AE, Reid WJ. Research in social work. 3rd ed. New York: Columbia University Press; 1999.
Kerlinger FN. Foundations of behavioral research. 1st ed. New York: Hold, Reinhart and Winston; 1970.
Hoskins CN, Mariano C. Research in nursing and health. Understanding and using quantitative and qualitative methods. New York: Springer; 2004.
Tuckman BW. Conducting educational research. New York: Harcourt, Brace, Jovanovich; 1972.
Wang C, Chiari PC, Weihrauch D, Krolikowski JG, Warltier DC, Kersten JR, Pratt Jr PF, Pagel PS. Gender-specificity of delayed preconditioning by isoflurane in rabbits: potential role of endothelial nitric oxide synthase. Anesth Analg. 2006;103:274–80.
Beyer ME, Slesak G, Nerz S, Kazmaier S, Hoffmeister HM. Effects of endothelin-1 and IRL 1620 on myocardial contractility and myocardial energy metabolism. J Cardiovasc Pharmacol. 1995;26(Suppl 3):S150–2.
PubMed CAS Google Scholar
Stone J, Sharpe M. Amnesia for childhood in patients with unexplained neurological symptoms. J Neurol Neurosurg Psychiatry. 2002;72:416–7.
Naughton BJ, Moran M, Ghaly Y, Michalakes C. Computer tomography scanning and delirium in elder patients. Acad Emerg Med. 1997;4:1107–10.
Easterbrook PJ, Berlin JA, Gopalan R, Matthews DR. Publication bias in clinical research. Lancet. 1991;337:867–72.
Stern JM, Simes RJ. Publication bias: evidence of delayed publication in a cohort study of clinical research projects. BMJ. 1997;315:640–5.
Stevens SS. On the theory of scales and measurement. Science. 1946;103:677–80.
Knapp TR. Treating ordinal scales as interval scales: an attempt to resolve the controversy. Nurs Res. 1990;39:121–3.
The Cochrane Collaboration. Open Learning Material. www.cochrane-net.org/openlearning/html/mod14-3.htm . Accessed 12 Oct 2009.
MacCorquodale K, Meehl PE. On a distinction between hypothetical constructs and intervening variables. Psychol Rev. 1948;55:95–107.
Baron RM, Kenny DA. The moderator-mediator variable distinction in social psychological research: conceptual, strategic and statistical considerations. J Pers Soc Psychol. 1986;51:1173–82.
Williamson GM, Schultz R. Activity restriction mediates the association between pain and depressed affect: a study of younger and older adult cancer patients. Psychol Aging. 1995;10:369–78.
Song M, Lee EO. Development of a functional capacity model for the elderly. Res Nurs Health. 1998;21:189–98.
MacKinnon DP. Introduction to statistical mediation analysis. New York: Routledge; 2008.
Download references
Author information
Authors and affiliations.
Department of Medicine, College of Medicine, SUNY Downstate Medical Center, 450 Clarkson Avenue, 1199, Brooklyn, NY, 11203, USA
Phyllis G. Supino EdD
You can also search for this author in PubMed Google Scholar
Corresponding author
Correspondence to Phyllis G. Supino EdD .
Editor information
Editors and affiliations.
, Cardiovascular Medicine, SUNY Downstate Medical Center, Clarkson Avenue, box 1199 450, Brooklyn, 11203, USA
Phyllis G. Supino
, Cardiovascualr Medicine, SUNY Downstate Medical Center, Clarkson Avenue 450, Brooklyn, 11203, USA
Jeffrey S. Borer
Rights and permissions
Reprints and permissions
Copyright information
© 2012 Springer Science+Business Media, LLC
About this chapter
Supino, P.G. (2012). The Research Hypothesis: Role and Construction. In: Supino, P., Borer, J. (eds) Principles of Research Methodology. Springer, New York, NY. https://doi.org/10.1007/978-1-4614-3360-6_3
Download citation
DOI : https://doi.org/10.1007/978-1-4614-3360-6_3
Published : 18 April 2012
Publisher Name : Springer, New York, NY
Print ISBN : 978-1-4614-3359-0
Online ISBN : 978-1-4614-3360-6
eBook Packages : Medicine Medicine (R0)
Share this chapter
Anyone you share the following link with will be able to read this content:
Sorry, a shareable link is not currently available for this article.
Provided by the Springer Nature SharedIt content-sharing initiative
- Publish with us
Policies and ethics
- Find a journal
- Track your research
Want to create or adapt books like this? Learn more about how Pressbooks supports open publishing practices.
10.3 Operational definitions
Learning objectives.
Learners will be able to…
- Define and give an example of indicators and attributes for a variable
- Apply the three components of an operational definition to a variable
- Distinguish between levels of measurement for a variable and how those differences relate to measurement
- Describe the purpose of composite measures like scales and indices
Conceptual definitions are like dictionary definitions. They tell you what a concept means by defining it using other concepts. Operationalization occurs after conceptualization and is the process by which researchers spell out precisely how a concept will be measured in their study. It involves identifying the specific research procedures we will use to gather data about our concepts. It entails identifying indicators that can identify when your variable is present or not, the magnitude of the variable, and so forth.

Operationalization works by identifying specific indicators that will be taken to represent the ideas we are interested in studying. Let’s look at an example. Each day, Gallup researchers poll 1,000 randomly selected Americans to ask them about their well-being. To measure well-being, Gallup asks these people to respond to questions covering six broad areas: physical health, emotional health, work environment, life evaluation, healthy behaviors, and access to basic necessities. Gallup uses these six factors as indicators of the concept that they are really interested in, which is well-being .
Identifying indicators can be even simpler than this example. Political party affiliation is another relatively easy concept for which to identify indicators. If you asked a person what party they voted for in the last national election (or gained access to their voting records), you would get a good indication of their party affiliation. Of course, some voters split tickets between multiple parties when they vote and others swing from party to party each election, so our indicator is not perfect. Indeed, if our study were about political identity as a key concept, operationalizing it solely in terms of who they voted for in the previous election leaves out a lot of information about identity that is relevant to that concept. Nevertheless, it’s a pretty good indicator of political party affiliation.
Choosing indicators is not an arbitrary process. Your conceptual definitions point you in the direction of relevant indicators and then you can identify appropriate indicators in a scholarly manner using theory and empirical evidence. Specifically, empirical work will give you some examples of how the important concepts in an area have been measured in the past and what sorts of indicators have been used. Often, it makes sense to use the same indicators as previous researchers; however, you may find that some previous measures have potential weaknesses that your own study may improve upon.
So far in this section, all of the examples of indicators deal with questions you might ask a research participant on a questionnaire for survey research. If you plan to collect data from other sources, such as through direct observation or the analysis of available records, think practically about what the design of your study might look like and how you can collect data on various indicators feasibly. If your study asks about whether participants regularly change the oil in their car, you will likely not observe them directly doing so. Instead, you would rely on a survey question that asks them the frequency with which they change their oil or ask to see their car maintenance records.
TRACK 1 (IF YOU ARE CREATING A RESEARCH PROPOSAL FOR THIS CLASS):
What indicators are commonly used to measure the variables in your research question?
- How can you feasibly collect data on these indicators?
- Are you planning to collect your own data using a questionnaire or interview? Or are you planning to analyze available data like client files or raw data shared from another researcher’s project?
Remember, you need raw data . Your research project cannot rely solely on the results reported by other researchers or the arguments you read in the literature. A literature review is only the first part of a research project, and your review of the literature should inform the indicators you end up choosing when you measure the variables in your research question.
TRACK 2 (IF YOU AREN’T CREATING A RESEARCH PROPOSAL FOR THIS CLASS):
You are interested in studying older adults’ social-emotional well-being. Specifically, you would like to research the impact on levels of older adult loneliness of an intervention that pairs older adults living in assisted living communities with university student volunteers for a weekly conversation.
- How could you feasibly collect data on these indicators?
- Would you collect your own data using a questionnaire or interview? Or would you analyze available data like client files or raw data shared from another researcher’s project?
Steps in the Operationalization Process
Unlike conceptual definitions which contain other concepts, operational definition consists of the following components: (1) the variable being measured and its attributes, (2) the measure you will use, and (3) how you plan to interpret the data collected from that measure to draw conclusions about the variable you are measuring.
Step 1 of Operationalization: Specify variables and attributes
The first component, the variable, should be the easiest part. At this point in quantitative research, you should have a research question with identifiable variables. When social scientists measure concepts, they often use the language of variables and attributes . A variable refers to a quality or quantity that varies across people or situations. Attributes are the characteristics that make up a variable. For example, the variable hair color could contain attributes such as blonde, brown, black, red, gray, etc.
Levels of measurement
A variable’s attributes determine its level of measurement. There are four possible levels of measurement: nominal, ordinal, interval, and ratio. The first two levels of measurement are categorical , meaning their attributes are categories rather than numbers. The latter two levels of measurement are continuous , meaning their attributes are numbers within a range.
Nominal level of measurement
Hair color is an example of a nominal level of measurement. At the nominal level of measurement , attributes are categorical, and those categories cannot be mathematically ranked. In all nominal levels of measurement, there is no ranking order; the attributes are simply different. Gender and race are two additional variables measured at the nominal level. A variable that has only two possible attributes is called binary or dichotomous . If you are measuring whether an individual has received a specific service, this is a dichotomous variable, as the only two options are received or not received.
What attributes are contained in the variable hair color ? Brown, black, blonde, and red are common colors, but if we only list these attributes, many people may not fit into those categories. This means that our attributes were not exhaustive. Exhaustiveness means that every participant can find a choice for their attribute in the response options. It is up to the researcher to include the most comprehensive attribute choices relevant to their research questions. We may have to list a lot of colors before we can meet the criteria of exhaustiveness. Clearly, there is a point at which exhaustiveness has been reasonably met. If a person insists that their hair color is light burnt sienna , it is not your responsibility to list that as an option. Rather, that person would reasonably be described as brown-haired. Perhaps listing a category for other color would suffice to make our list of colors exhaustive.
What about a person who has multiple hair colors at the same time, such as red and black? They would fall into multiple attributes. This violates the rule of mutual exclusivity , in which a person cannot fall into two different attributes. Instead of listing all of the possible combinations of colors, perhaps you might include a multi-color attribute to describe people with more than one hair color.

Making sure researchers provide mutually exclusive and exhaustive attribute options is about making sure all people are represented in the data record. For many years, the attributes for gender were only male or female. Now, our understanding of gender has evolved to encompass more attributes that better reflect the diversity in the world. Children of parents from different races were often classified as one race or another, even if they identified with both. The option for bi-racial or multi-racial on a survey not only more accurately reflects the racial diversity in the real world but also validates and acknowledges people who identify in that manner. If we did not measure race in this way, we would leave empty the data record for people who identify as biracial or multiracial, impairing our search for truth.
Ordinal level of measurement
Unlike nominal-level measures, attributes at the ordinal level of measurement can be rank-ordered. For example, someone’s degree of satisfaction in their romantic relationship can be ordered by magnitude of satisfaction. That is, you could say you are not at all satisfied, a little satisfied, moderately satisfied, or highly satisfied. Even though these have a rank order to them (not at all satisfied is certainly worse than highly satisfied), we cannot calculate a mathematical distance between those attributes. We can simply say that one attribute of an ordinal-level variable is more or less than another attribute. A variable that is commonly measured at the ordinal level of measurement in social work is education (e.g., less than high school education, high school education or equivalent, some college, associate’s degree, college degree, graduate degree or higher). Just as with nominal level of measurement, ordinal-level attributes should also be exhaustive and mutually exclusive.
Rating scales for ordinal-level measurement
The fact that we cannot specify exactly how far apart the responses for different individuals in ordinal level of measurement can become clear when using rating scales . If you have ever taken a customer satisfaction survey or completed a course evaluation for school, you are familiar with rating scales such as, “On a scale of 1-5, with 1 being the lowest and 5 being the highest, how likely are you to recommend our company to other people?” Rating scales use numbers, but only as a shorthand, to indicate what attribute (highly likely, somewhat likely, etc.) the person feels describes them best. You wouldn’t say you are “2” likely to recommend the company, but you would say you are “not very likely” to recommend the company. In rating scales the difference between 2 = “ not very likely” and 3 = “ somewhat likely” is not quantifiable as a difference of 1. Likewise, we couldn’t say that it is the same as the difference between 3 = “ somewhat likely ” and 4 = “ very likely .”
Rating scales can be unipolar rating scales where only one dimension is tested, such as frequency (e.g., Never, Rarely, Sometimes, Often, Always) or strength of satisfaction (e.g., Not at all, Somewhat, Very). The attributes on a unipolar rating scale are different magnitudes of the same concept.
There are also bipolar rating scales where there is a dichotomous spectrum, such as liking or disliking (Like very much, Like somewhat, Like slightly, Neither like nor dislike, Dislike slightly, Dislike somewhat, Dislike very much). The attributes on the ends of a bipolar scale are opposites of one another. Figure 10.1 shows several examples of bipolar rating scales.

Interval level of measurement
Interval measures are continuous, meaning the meaning and interpretation of their attributes are numbers, rather than categories. Temperatures in Fahrenheit and Celsius are interval level, as are IQ scores and credit scores. Just like variables measured at the ordinal level, the attributes for variables measured at the interval level should be mutually exclusive and exhaustive, and are rank-ordered. In addition, they also have an equal distance between the attribute values.
The interval level of measurement allows us to examine “how much more” is one attribute when compared to another, which is not possible with nominal or ordinal measures. In other words, the unit of measurement allows us to compare the distance between attributes. The value of one unit of measurement (e.g., one degree Celsius, one IQ point) is always the same regardless of where in the range of values you look. The difference of 10 degrees between a temperature of 50 and 60 degrees Fahrenheit is the same as the difference between 60 and 70 degrees Fahrenheit.
We cannot, however, say with certainty what the ratio of one attribute is in comparison to another. For example, it would not make sense to say that a person with an IQ score of 140 has twice the IQ of a person with a score of 70. However, the difference between IQ scores of 80 and 100 is the same as the difference between IQ scores of 120 and 140.
You may find research in which ordinal-level variables are treated as if they are interval measures for analysis. This can be a problem because as we’ve noted, there is no way to know whether the difference between a 3 and a 4 on a rating scale is the same as the difference between a 2 and a 3. Those numbers are just placeholders for categories.
Ratio level of measurement
The final level of measurement is the ratio level of measurement . Variables measured at the ratio level of measurement are continuous variables, just like with interval scale. They, too, have equal intervals between each point. However, the ratio level of measurement has a true zero, which means that a value of zero on a ratio scale means that the variable you’re measuring is absent. For example, if you have no siblings, the a value of 0 indicates this (unlike a temperature of 0 which does not mean there is no temperature). What is the advantage of having a “true zero?” It allows you to calculate ratios. For example, if you have a three siblings, you can say that this is half the number of siblings as a person with six.
At the ratio level, the attribute values are mutually exclusive and exhaustive, can be rank-ordered, the distance between attributes is equal, and attributes have a true zero point. Thus, with these variables, we can say what the ratio of one attribute is in comparison to another. Examples of ratio-level variables include age and years of education. We know that a person who is 12 years old is twice as old as someone who is 6 years old. Height measured in meters and weight measured in kilograms are good examples. So are counts of discrete objects or events such as the number of siblings one has or the number of questions a student answers correctly on an exam. Measuring interval and ratio data is relatively easy, as people either select or input a number for their answer. If you ask a person how many eggs they purchased last week, they can simply tell you they purchased `a dozen eggs at the store, two at breakfast on Wednesday, or none at all.
The differences between each level of measurement are visualized in Table 10.2.
Levels of measurement=levels of specificity
We have spent time learning how to determine a variable’s level of measurement. Now what? How could we use this information to help us as we measure concepts and develop measurement tools? First, the types of statistical tests that we are able to use depend on level of measurement. With nominal-level measurement, for example, the only available measure of central tendency is the mode. With ordinal-level measurement, the median or mode can be used. Interval- and ratio-level measurement are typically considered the most desirable because they permit any indicators of central tendency to be computed (i.e., mean, median, or mode). Also, ratio-level measurement is the only level that allows meaningful statements about ratios of scores. The higher the level of measurement, the more options we have for the statistical tests we are able to conduct. This knowledge may help us decide what kind of data we need to gather, and how.
That said, we have to balance this knowledge with the understanding that sometimes, collecting data at a higher level of measurement could negatively impact our studies. For instance, sometimes providing answers in ranges may make prospective participants feel more comfortable responding to sensitive items. Imagine that you were interested in collecting information on topics such as income, number of sexual partners, number of times someone used illicit drugs, etc. You would have to think about the sensitivity of these items and determine if it would make more sense to collect some data at a lower level of measurement (e.g., nominal: asking if they are sexually active or not) versus a higher level such as ratio (e.g., their total number of sexual partners).
Finally, sometimes when analyzing data, researchers find a need to change a variable’s level of measurement. For example, a few years ago, a student was interested in studying the association between mental health and life satisfaction. This student used a variety of measures. One item asked about the number of mental health symptoms, reported as the actual number. When analyzing data, the student examined the mental health symptom variable and noticed that she had two groups, those with none or one symptoms and those with many symptoms. Instead of using the ratio level data (actual number of mental health symptoms), she collapsed her cases into two categories, few and many. She decided to use this variable in her analyses. It is important to note that you can move a higher level of data to a lower level of data; however, you are unable to move a lower level to a higher level.
- Check that the variables in your research question can vary…and that they are not constants or one of many potential attributes of a variable.
- Think about the attributes your variables have. Are they categorical or continuous? What level of measurement seems most appropriate?
Step 2 of Operationalization: Specify measures for each variable
Let’s pick a social work research question and walk through the process of operationalizing variables to see how specific we need to get. Suppose we hypothesize that residents of a psychiatric unit who are more depressed are less likely to be satisfied with care. Remember, this would be an inverse relationship—as levels of depression increase, satisfaction decreases. In this hypothesis, level of depression is the independent (or predictor) variable and satisfaction with care is the dependent (or outcome) variable.
How would you measure these key variables? What indicators would you look for? Some might say that levels of depression could be measured by observing a participant’s body language. They may also say that a depressed person will often express feelings of sadness or hopelessness. In addition, a satisfied person might be happy around service providers and often express gratitude. While these factors may indicate that the variables are present, they lack coherence. Unfortunately, what this “measure” is actually saying is that “I know depression and satisfaction when I see them.” In a research study, you need more precision for how you plan to measure your variables. Individual judgments are subjective, based on idiosyncratic experiences with depression and satisfaction. They couldn’t be replicated by another researcher. They also can’t be done consistently for a large group of people. Operationalization requires that you come up with a specific and rigorous measure for seeing who is depressed or satisfied.
Finding a good measure for your variable depends on the kind of variable it is. Variables that are directly observable might include things like taking someone’s blood pressure, marking attendance or participation in a group, and so forth. To measure an indirectly observable variable like age, you would probably put a question on a survey that asked, “How old are you?” Measuring a variable like income might first require some more conceptualization, though. Are you interested in this person’s individual income or the income of their family unit? This might matter if your participant does not work or is dependent on other family members for income. Do you count income from social welfare programs? Are you interested in their income per month or per year? Even though indirect observables are relatively easy to measure, the measures you use must be clear in what they are asking, and operationalization is all about figuring out the specifics about how to measure what you want to know. For more complicated variables such as constructs, you will need compound measures that use multiple indicators to measure a single variable.
How you plan to collect your data also influences how you will measure your variables. For social work researchers using secondary data like client records as a data source, you are limited by what information is in the data sources you can access. If a partnering organization uses a given measurement for a mental health outcome, that is the one you will use in your study. Similarly, if you plan to study how long a client was housed after an intervention using client visit records, you are limited by how their caseworker recorded their housing status in the chart. One of the benefits of collecting your own data is being able to select the measures you feel best exemplify your understanding of the topic.
Composite measures
Depending on your research design, your measure may be something you put on a survey or pre/post-test that you give to your participants. For a variable like age or income, one well-worded item may suffice. Unfortunately, most variables in the social world are not so simple. Depression and satisfaction are multidimensional concepts. Relying on a indicator that is a single item on a questionnaire like a question that asks “Yes or no, are you depressed?” does not encompass the complexity of constructs.
For more complex variables, researchers use scales and indices (sometimes called indexes) because they use multiple items to develop a composite (or total) score as a measure for a variable. As such, they are called composite measures . Composite measures provide a much greater understanding of concepts than a single item could.
It can be complex to delineate between multidimensional and unidimensional concepts. If satisfaction were a key variable in our study, we would need a theoretical framework and conceptual definition for it. Perhaps we come to view satisfaction has having two dimensions: a mental one and an emotional one. That means we would need to include indicators that measured both mental and emotional satisfaction as separate dimensions of satisfaction. However, if satisfaction is not a key variable in your theoretical framework, it may make sense to operationalize it as a unidimensional concept.
Although we won’t delve too deeply into the process of scale development, we will cover some important topics for you to understand how scales and indices developed by other researchers can be used in your project.
Need to make better sense of the following content:
Measuring abstract concepts in concrete terms remains one of the most difficult tasks in empirical social science research.
A scale , XXXXXXXXXXXX .
The scales we discuss in this section are a different from “rating scales” discussed in the previous section. A rating scale is used to capture the respondents’ reactions to a given item on a questionnaire. For example, an ordinally scaled item captures a value between “strongly disagree” to “strongly agree.” Attaching a rating scale to a statement or instrument is not scaling. Rather, scaling is the formal process of developing scale items, before rating scales can be attached to those items.
If creating your own scale sounds painful, don’t worry! For most constructs, you would likely be duplicating work that has already been done by other researchers. Specifically, this is a branch of science called psychometrics. You do not need to create a scale for depression because scales such as the Patient Health Questionnaire (PHQ-9) [1] , the Center for Epidemiologic Studies Depression Scale (CES-D) [2] , and Beck’s Depression Inventory [3] (BDI) have been developed and refined over dozens of years to measure variables like depression. Similarly, scales such as the Patient Satisfaction Questionnaire (PSQ-18) have been developed to measure satisfaction with medical care. As we will discuss in the next section, these scales have been shown to be reliable and valid. While you could create a new scale to measure depression or satisfaction, a study with rigor would pilot test and refine that new scale over time to make sure it measures the concept accurately and consistently before using it in other research. This high level of rigor is often unachievable in smaller research projects because of the cost and time involved in pilot testing and validating, so using existing scales is recommended.
Unfortunately, there is no good one-stop-shop for psychometric scales. The Mental Measurements Yearbook provides a list of measures for social science variables, though it is incomplete and may not contain the full documentation for instruments in its database. It is available as a searchable database by many university libraries.
Perhaps an even better option could be looking at the methods section of the articles in your literature review. The methods section of each article will detail how the researchers measured their variables, and often the results section is instructive for understanding more about measures. In a quantitative study, researchers may have used a scale to measure key variables and will provide a brief description of that scale, its names, and maybe a few example questions. If you need more information, look at the results section and tables discussing the scale to get a better idea of how the measure works.
Looking beyond the articles in your literature review, searching Google Scholar or other databases using queries like “depression scale” or “satisfaction scale” should also provide some relevant results. For example, searching for documentation for the Rosenberg Self-Esteem Scale, I found this report about useful measures for acceptance and commitment therapy which details measurements for mental health outcomes. If you find the name of the scale somewhere but cannot find the documentation (i.e., all items, response choices, and how to interpret the scale), a general web search with the name of the scale and “.pdf” may bring you to what you need. Or, to get professional help with finding information, ask a librarian!
Unfortunately, these approaches do not guarantee that you will be able to view the scale itself or get information on how it is interpreted. Many scales cost money to use and may require training to properly administer. You may also find scales that are related to your variable but would need to be slightly modified to match your study’s needs. You could adapt a scale to fit your study, however changing even small parts of a scale can influence its accuracy and consistency. Pilot testing is always recommended for adapted scales, and researchers seeking to draw valid conclusions and publish their results should take this additional step.
Types of scales
Likert scales.
Although Likert scale is a term colloquially used to refer to almost any rating scale (e.g., a 0-to-10 life satisfaction scale), it has a much more precise meaning. In the 1930s, researcher Rensis Likert (pronounced LICK-ert) created a new approach for measuring people’s attitudes (Likert, 1932) . [4] It involves presenting people with several statements—including both favorable and unfavorable statements—about some person, group, or idea. Respondents then express their approval or disapproval with each statement on a 5-point rating scale: Strongly Approve , Approve , Undecided , Disapprove, Strongly Disapprove . Numbers are assigned to each response a nd then summed across all items to produce a score representing the attitude toward the person, group, or idea. For items that are phrased in an opposite direction (e.g., negatively worded statements instead of positively worded statements), reverse coding is used so that the numerical scoring of statements also runs in the opposite direction. The scores for the entire set of items are totaled for a score for the attitude of interest. This type of scale came to be called a Likert scale, as indicated in Table 10.3 below. Scales that use similar logic but do not have these exact characteristics are referred to as “Likert-type scales.”
Semantic Differential Scales
Semantic differential scales are composite scales in which respondents are asked to indicate their opinions or feelings toward a single statement using different pairs of adjectives framed as polar opposites. Whereas in a Likert scale, a participant is asked how much they approve or disapprove of a statement, in a semantic differential scale the participant is asked to indicate how they about a specific item using several pairs of opposites. This makes the semantic differential scale an excellent technique for measuring people’s feelings toward objects, events, or behaviors. Table 10.4 provides an example of a semantic differential scale that was created to assess participants’ feelings about this textbook.
Guttman Scales
A specialized scale for measuring unidimensional concepts was designed by Louis Guttman. A Guttman scale (also called cumulative scale ) uses a series of items arranged in increasing order of intensity (least intense to most intense) of the concept. This type of scale allows us to understand the intensity of beliefs or feelings. Each item in the Guttman scale below has a weight (this is not indicated on the tool) which varies with the intensity of that item, and the weighted combination of each response is used as an aggregate measure of an observation.
Table XX presents an example of a Guttman Scale. Notice how the items move from lower intensity to higher intensity. A researcher reviews the yes answers and creates a score for each participant.
Example Guttman Scale Items
- I often felt the material was not engaging Yes/No
- I was often thinking about other things in class Yes/No
- I was often working on other tasks during class Yes/No
- I will work to abolish research from the curriculum Yes/No
An index is a composite score derived from aggregating measures of multiple indicators. At its most basic, an index sums up indicators. A well-known example of an index is the consumer price index (CPI), which is computed every month by the Bureau of Labor Statistics of the U.S. Department of Labor. The CPI is a measure of how much consumers have to pay for goods and services (in general) and is divided into eight major categories (food and beverages, housing, apparel, transportation, healthcare, recreation, education and communication, and “other goods and services”), which are further subdivided into more than 200 smaller items. Each month, government employees call all over the country to get the current prices of more than 80,000 items. Using a complicated weighting scheme that takes into account the location and probability of purchase for each item, analysts then combine these prices into an overall index score using a series of formulas and rules.
Another example of an index is the Duncan Socioeconomic Index (SEI). This index is used to quantify a person’s socioeconomic status (SES) and is a combination of three concepts: income, education, and occupation. Income is measured in dollars, education in years or degrees achieved, and occupation is classified into categories or levels by status. These very different measures are combined to create an overall SES index score. However, SES index measurement has generated a lot of controversy and disagreement among researchers.
The process of creating an index is similar to that of a scale. First, conceptualize the index and its constituent components. Though this appears simple, there may be a lot of disagreement on what components (concepts/constructs) should be included or excluded from an index. For instance, in the SES index, isn’t income correlated with education and occupation? And if so, should we include one component only or all three components? Reviewing the literature, using theories, and/or interviewing experts or key stakeholders may help resolve this issue. Second, operationalize and measure each component. For instance, how will you categorize occupations, particularly since some occupations may have changed with time (e.g., there were no Web developers before the Internet)? As we will see in step three below, researchers must create a rule or formula for calculating the index score. Again, this process may involve a lot of subjectivity, so validating the index score using existing or new data is important.
Differences between scales and indices
Though indices and scales yield a single numerical score or value representing a concept of interest, they are different in many ways. First, indices often comprise components that are very different from each other (e.g., income, education, and occupation in the SES index) and are measured in different ways. Conversely, scales typically involve a set of similar items that use the same rating scale (such as a five-point Likert scale about customer satisfaction).
Second, indices often combine objectively measurable values such as prices or income, while scales are designed to assess subjective or judgmental constructs such as attitude, prejudice, or self-esteem. Some argue that the sophistication of the scaling methodology makes scales different from indexes, while others suggest that indexing methodology can be equally sophisticated. Nevertheless, indexes and scales are both essential tools in social science research.
Scales and indices seem like clean, convenient ways to measure different phenomena in social science, but just like with a lot of research, we have to be mindful of the assumptions and biases underneath. What if the developers of scale or an index were influenced by unconscious biases? Or what if it was validated using only White women as research participants? Is it going to be useful for other groups? It very well might be, but when using a scale or index on a group for whom it hasn’t been tested, it will be very important to evaluate the validity and reliability of the instrument, which we address in the rest of the chapter.
Finally, it’s important to note that while scales and indices are often made up of items measured at the nominal or ordinal level, the scores on the composite measurement are continuous variables.
Looking back to your work from the previous section, are your variables unidimensional or multidimensional?
- Describe the specific measures you will use (actual questions and response options you will use with participants) for each variable in your research question.
- If you are using a measure developed by another researcher but do not have all of the questions, response options, and instructions needed to implement it, put it on your to-do list to get them.
- Describe at least one specific measure you would use (actual questions and response options you would use with participants) for the dependent variable in your research question.
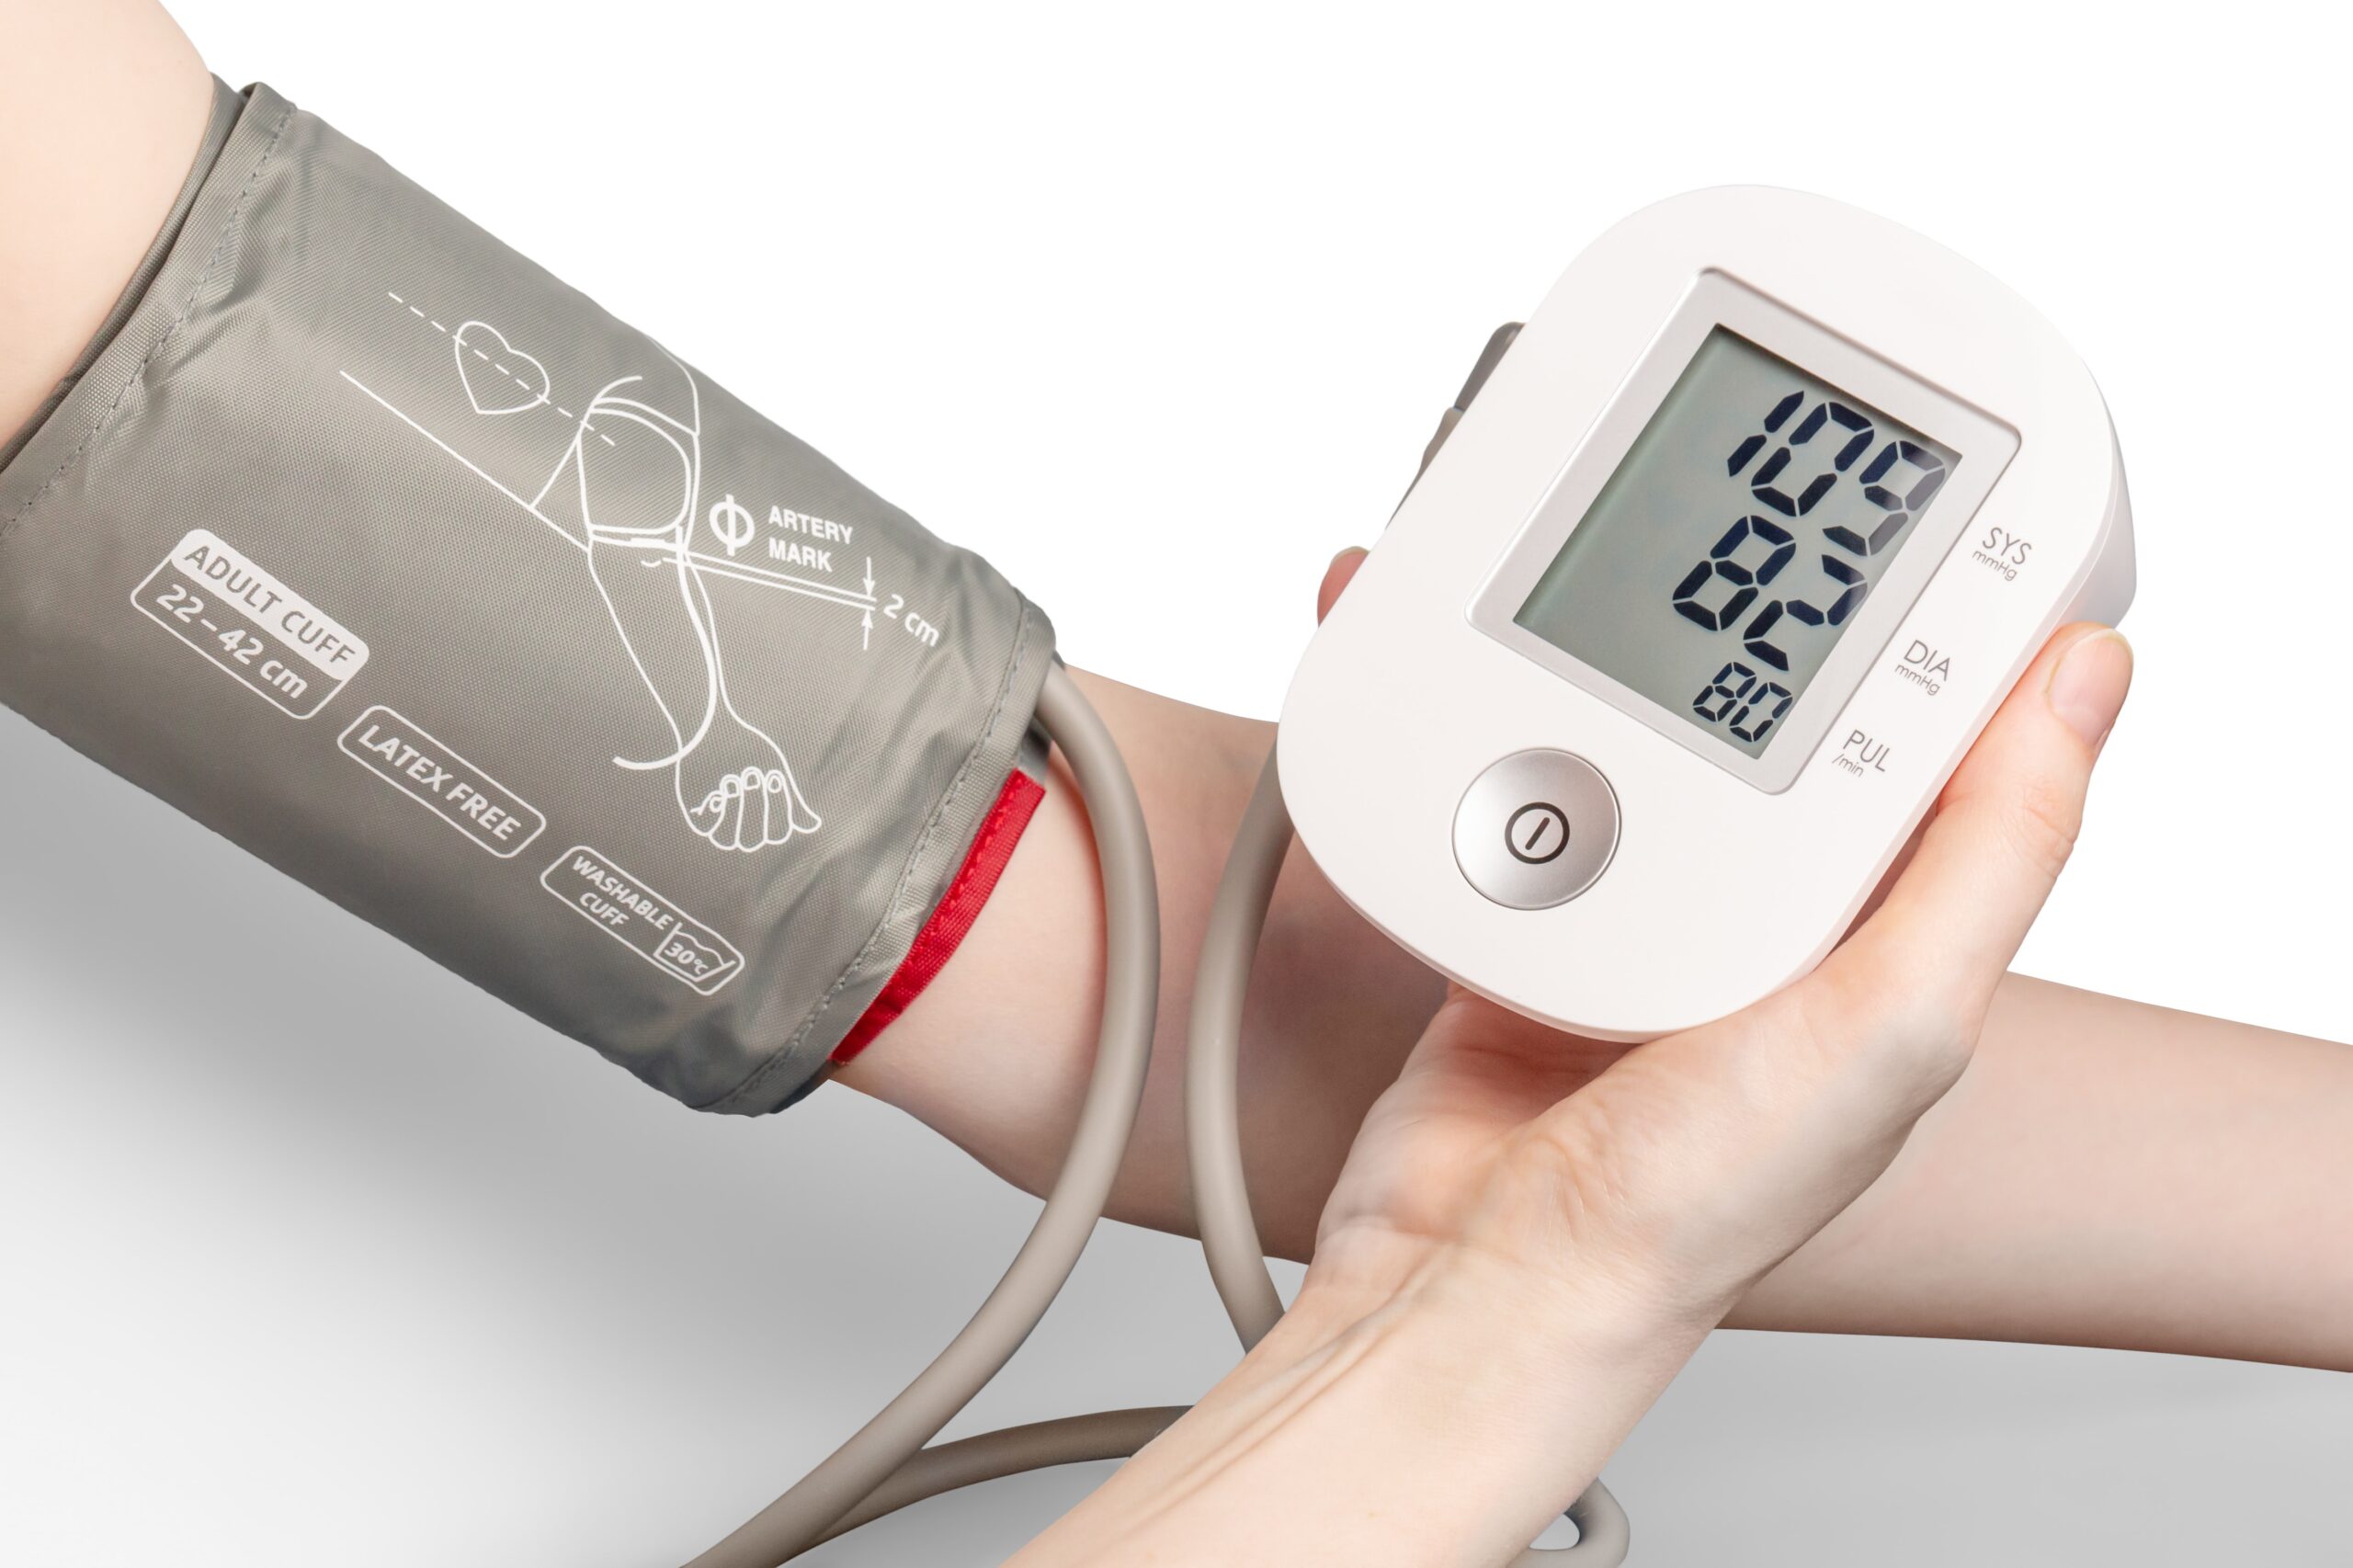
Step 3 in Operationalization: Determine how to interpret measures
The final stage of operationalization involves setting the rules for how the measure works and how the researcher should interpret the results. Sometimes, interpreting a measure can be incredibly easy. If you ask someone their age, you’ll probably interpret the results by noting the raw number (e.g., 22) someone provides and that it is lower or higher than other people’s ages. However, you could also recode that person into age categories (e.g., under 25, 20-29-years-old, generation Z, etc.). Even scales or indices may be simple to interpret. If there is an index of problem behaviors, one might simply add up the number of behaviors checked off–with a range from 1-5 indicating low risk of delinquent behavior, 6-10 indicating the student is moderate risk, etc. How you choose to interpret your measures should be guided by how they were designed, how you conceptualize your variables, the data sources you used, and your plan for analyzing your data statistically. Whatever measure you use, you need a set of rules for how to take any valid answer a respondent provides to your measure and interpret it in terms of the variable being measured.
For more complicated measures like scales, refer to the information provided by the author for how to interpret the scale. If you can’t find enough information from the scale’s creator, look at how the results of that scale are reported in the results section of research articles. For example, Beck’s Depression Inventory (BDI-II) uses 21 statements to measure depression and respondents rate their level of agreement on a scale of 0-3. The results for each question are added up, and the respondent is put into one of three categories: low levels of depression (1-16), moderate levels of depression (17-30), or severe levels of depression (31 and over) ( NEEDS CITATION) .
Operationalization is a tricky component of basic research methods, so don’t get frustrated if it takes a few drafts and a lot of feedback to get to a workable operational definition.
Key Takeaways
- Operationalization involves spelling out precisely how a concept will be measured.
- Operational definitions must include the variable, the measure, and how you plan to interpret the measure.
- There are four different levels of measurement: nominal, ordinal, interval, and ratio (in increasing order of specificity).
- Scales and indices are common ways to collect information and involve using multiple indicators in measurement.
- A key difference between a scale and an index is that a scale contains multiple indicators for one concept, whereas an indicator examines multiple concepts (components).
- Using scales developed and refined by other researchers can improve the rigor of a quantitative study.
Use the research question that you developed in the previous chapters and find a related scale or index that researchers have used. If you have trouble finding the exact phenomenon you want to study, get as close as you can.
- What is the level of measurement for each item on each tool? Take a second and think about why the tool’s creator decided to include these levels of measurement. Identify any levels of measurement you would change and why.
- If these tools don’t exist for what you are interested in studying, why do you think that is?
Using your working research question, find a related scale or index that researchers have used to measure the dependent variable. If you have trouble finding the exact phenomenon you want to study, get as close as you can.
- What is the level of measurement for each item on the tool? Take a second and think about why the tool’s creator decided to include these levels of measurement. Identify any levels of measurement you would change and why.
- Kroenke, K., Spitzer, R. L., & Williams, J. B. (2001). The PHQ-9: validity of a brief depression severity measure. Journal of general internal medicine, 16(9), 606–613. https://doi.org/10.1046/j.1525-1497.2001.016009606.x ↵
- Radloff, L. S. (1977). The CES-D scale: A self report depression scale for research in the general population. Applied Psychological Measurements, 1, 385-401. ↵
- Beck, A. T., Ward, C. H., Mendelson, M., Mock, J., & Erbaugh, J. (1961). An inventory for measuring depression. Archives of general psychiatry, 4, 561–571. https://doi.org/10.1001/archpsyc.1961.01710120031004 ↵
- Likert, R. (1932). A technique for the measurement of attitudes. Archives of Psychology, 140 , 1–55. ↵
process by which researchers spell out precisely how a concept will be measured in their study
Clues that demonstrate the presence, intensity, or other aspects of a concept in the real world
unprocessed data that researchers can analyze using quantitative and qualitative methods (e.g., responses to a survey or interview transcripts)
“a logical grouping of attributes that can be observed and measured and is expected to vary from person to person in a population” (Gillespie & Wagner, 2018, p. 9)
The characteristics that make up a variable
variables whose values are organized into mutually exclusive groups but whose numerical values cannot be used in mathematical operations.
variables whose values are mutually exclusive and can be used in mathematical operations
The lowest level of measurement; categories cannot be mathematically ranked, though they are exhaustive and mutually exclusive
Exhaustive categories are options for closed ended questions that allow for every possible response (no one should feel like they can't find the answer for them).
Mutually exclusive categories are options for closed ended questions that do not overlap, so people only fit into one category or another, not both.
Level of measurement that follows nominal level. Has mutually exclusive categories and a hierarchy (rank order), but we cannot calculate a mathematical distance between attributes.
An ordered set of responses that participants must choose from.
A rating scale where the magnitude of a single trait is being tested
A rating scale in which a respondent selects their alignment of choices between two opposite poles such as disagreement and agreement (e.g., strongly disagree, disagree, agree, strongly agree).
A level of measurement that is continuous, can be rank ordered, is exhaustive and mutually exclusive, and for which the distance between attributes is known to be equal. But for which there is no zero point.
The highest level of measurement. Denoted by mutually exclusive categories, a hierarchy (order), values can be added, subtracted, multiplied, and divided, and the presence of an absolute zero.
measurements of variables based on more than one one indicator
An empirical structure for measuring items or indicators of the multiple dimensions of a concept.
measuring people’s attitude toward something by assessing their level of agreement with several statements about it
Composite (multi-item) scales in which respondents are asked to indicate their opinions or feelings toward a single statement using different pairs of adjectives framed as polar opposites.
A composite scale using a series of items arranged in increasing order of intensity of the construct of interest, from least intense to most intense.
a composite score derived from aggregating measures of multiple concepts (called components) using a set of rules and formulas
Doctoral Research Methods in Social Work Copyright © by Mavs Open Press. All Rights Reserved.
Share This Book
Educational resources and simple solutions for your research journey

What is a Research Hypothesis: How to Write it, Types, and Examples
Any research begins with a research question and a research hypothesis . A research question alone may not suffice to design the experiment(s) needed to answer it. A hypothesis is central to the scientific method. But what is a hypothesis ? A hypothesis is a testable statement that proposes a possible explanation to a phenomenon, and it may include a prediction. Next, you may ask what is a research hypothesis ? Simply put, a research hypothesis is a prediction or educated guess about the relationship between the variables that you want to investigate.
It is important to be thorough when developing your research hypothesis. Shortcomings in the framing of a hypothesis can affect the study design and the results. A better understanding of the research hypothesis definition and characteristics of a good hypothesis will make it easier for you to develop your own hypothesis for your research. Let’s dive in to know more about the types of research hypothesis , how to write a research hypothesis , and some research hypothesis examples .
Table of Contents
What is a hypothesis ?
A hypothesis is based on the existing body of knowledge in a study area. Framed before the data are collected, a hypothesis states the tentative relationship between independent and dependent variables, along with a prediction of the outcome.
What is a research hypothesis ?
Young researchers starting out their journey are usually brimming with questions like “ What is a hypothesis ?” “ What is a research hypothesis ?” “How can I write a good research hypothesis ?”
A research hypothesis is a statement that proposes a possible explanation for an observable phenomenon or pattern. It guides the direction of a study and predicts the outcome of the investigation. A research hypothesis is testable, i.e., it can be supported or disproven through experimentation or observation.

Characteristics of a good hypothesis
Here are the characteristics of a good hypothesis :
- Clearly formulated and free of language errors and ambiguity
- Concise and not unnecessarily verbose
- Has clearly defined variables
- Testable and stated in a way that allows for it to be disproven
- Can be tested using a research design that is feasible, ethical, and practical
- Specific and relevant to the research problem
- Rooted in a thorough literature search
- Can generate new knowledge or understanding.
How to create an effective research hypothesis
A study begins with the formulation of a research question. A researcher then performs background research. This background information forms the basis for building a good research hypothesis . The researcher then performs experiments, collects, and analyzes the data, interprets the findings, and ultimately, determines if the findings support or negate the original hypothesis.
Let’s look at each step for creating an effective, testable, and good research hypothesis :
- Identify a research problem or question: Start by identifying a specific research problem.
- Review the literature: Conduct an in-depth review of the existing literature related to the research problem to grasp the current knowledge and gaps in the field.
- Formulate a clear and testable hypothesis : Based on the research question, use existing knowledge to form a clear and testable hypothesis . The hypothesis should state a predicted relationship between two or more variables that can be measured and manipulated. Improve the original draft till it is clear and meaningful.
- State the null hypothesis: The null hypothesis is a statement that there is no relationship between the variables you are studying.
- Define the population and sample: Clearly define the population you are studying and the sample you will be using for your research.
- Select appropriate methods for testing the hypothesis: Select appropriate research methods, such as experiments, surveys, or observational studies, which will allow you to test your research hypothesis .
Remember that creating a research hypothesis is an iterative process, i.e., you might have to revise it based on the data you collect. You may need to test and reject several hypotheses before answering the research problem.
How to write a research hypothesis
When you start writing a research hypothesis , you use an “if–then” statement format, which states the predicted relationship between two or more variables. Clearly identify the independent variables (the variables being changed) and the dependent variables (the variables being measured), as well as the population you are studying. Review and revise your hypothesis as needed.
An example of a research hypothesis in this format is as follows:
“ If [athletes] follow [cold water showers daily], then their [endurance] increases.”
Population: athletes
Independent variable: daily cold water showers
Dependent variable: endurance
You may have understood the characteristics of a good hypothesis . But note that a research hypothesis is not always confirmed; a researcher should be prepared to accept or reject the hypothesis based on the study findings.

Research hypothesis checklist
Following from above, here is a 10-point checklist for a good research hypothesis :
- Testable: A research hypothesis should be able to be tested via experimentation or observation.
- Specific: A research hypothesis should clearly state the relationship between the variables being studied.
- Based on prior research: A research hypothesis should be based on existing knowledge and previous research in the field.
- Falsifiable: A research hypothesis should be able to be disproven through testing.
- Clear and concise: A research hypothesis should be stated in a clear and concise manner.
- Logical: A research hypothesis should be logical and consistent with current understanding of the subject.
- Relevant: A research hypothesis should be relevant to the research question and objectives.
- Feasible: A research hypothesis should be feasible to test within the scope of the study.
- Reflects the population: A research hypothesis should consider the population or sample being studied.
- Uncomplicated: A good research hypothesis is written in a way that is easy for the target audience to understand.
By following this research hypothesis checklist , you will be able to create a research hypothesis that is strong, well-constructed, and more likely to yield meaningful results.

Types of research hypothesis
Different types of research hypothesis are used in scientific research:
1. Null hypothesis:
A null hypothesis states that there is no change in the dependent variable due to changes to the independent variable. This means that the results are due to chance and are not significant. A null hypothesis is denoted as H0 and is stated as the opposite of what the alternative hypothesis states.
Example: “ The newly identified virus is not zoonotic .”
2. Alternative hypothesis:
This states that there is a significant difference or relationship between the variables being studied. It is denoted as H1 or Ha and is usually accepted or rejected in favor of the null hypothesis.
Example: “ The newly identified virus is zoonotic .”
3. Directional hypothesis :
This specifies the direction of the relationship or difference between variables; therefore, it tends to use terms like increase, decrease, positive, negative, more, or less.
Example: “ The inclusion of intervention X decreases infant mortality compared to the original treatment .”
4. Non-directional hypothesis:
While it does not predict the exact direction or nature of the relationship between the two variables, a non-directional hypothesis states the existence of a relationship or difference between variables but not the direction, nature, or magnitude of the relationship. A non-directional hypothesis may be used when there is no underlying theory or when findings contradict previous research.
Example, “ Cats and dogs differ in the amount of affection they express .”
5. Simple hypothesis :
A simple hypothesis only predicts the relationship between one independent and another independent variable.
Example: “ Applying sunscreen every day slows skin aging .”
6 . Complex hypothesis :
A complex hypothesis states the relationship or difference between two or more independent and dependent variables.
Example: “ Applying sunscreen every day slows skin aging, reduces sun burn, and reduces the chances of skin cancer .” (Here, the three dependent variables are slowing skin aging, reducing sun burn, and reducing the chances of skin cancer.)
7. Associative hypothesis:
An associative hypothesis states that a change in one variable results in the change of the other variable. The associative hypothesis defines interdependency between variables.
Example: “ There is a positive association between physical activity levels and overall health .”
8 . Causal hypothesis:
A causal hypothesis proposes a cause-and-effect interaction between variables.
Example: “ Long-term alcohol use causes liver damage .”
Note that some of the types of research hypothesis mentioned above might overlap. The types of hypothesis chosen will depend on the research question and the objective of the study.

Research hypothesis examples
Here are some good research hypothesis examples :
“The use of a specific type of therapy will lead to a reduction in symptoms of depression in individuals with a history of major depressive disorder.”
“Providing educational interventions on healthy eating habits will result in weight loss in overweight individuals.”
“Plants that are exposed to certain types of music will grow taller than those that are not exposed to music.”
“The use of the plant growth regulator X will lead to an increase in the number of flowers produced by plants.”
Characteristics that make a research hypothesis weak are unclear variables, unoriginality, being too general or too vague, and being untestable. A weak hypothesis leads to weak research and improper methods.
Some bad research hypothesis examples (and the reasons why they are “bad”) are as follows:
“This study will show that treatment X is better than any other treatment . ” (This statement is not testable, too broad, and does not consider other treatments that may be effective.)
“This study will prove that this type of therapy is effective for all mental disorders . ” (This statement is too broad and not testable as mental disorders are complex and different disorders may respond differently to different types of therapy.)
“Plants can communicate with each other through telepathy . ” (This statement is not testable and lacks a scientific basis.)
Importance of testable hypothesis
If a research hypothesis is not testable, the results will not prove or disprove anything meaningful. The conclusions will be vague at best. A testable hypothesis helps a researcher focus on the study outcome and understand the implication of the question and the different variables involved. A testable hypothesis helps a researcher make precise predictions based on prior research.
To be considered testable, there must be a way to prove that the hypothesis is true or false; further, the results of the hypothesis must be reproducible.

Frequently Asked Questions (FAQs) on research hypothesis
1. What is the difference between research question and research hypothesis ?
A research question defines the problem and helps outline the study objective(s). It is an open-ended statement that is exploratory or probing in nature. Therefore, it does not make predictions or assumptions. It helps a researcher identify what information to collect. A research hypothesis , however, is a specific, testable prediction about the relationship between variables. Accordingly, it guides the study design and data analysis approach.
2. When to reject null hypothesis ?
A null hypothesis should be rejected when the evidence from a statistical test shows that it is unlikely to be true. This happens when the test statistic (e.g., p -value) is less than the defined significance level (e.g., 0.05). Rejecting the null hypothesis does not necessarily mean that the alternative hypothesis is true; it simply means that the evidence found is not compatible with the null hypothesis.
3. How can I be sure my hypothesis is testable?
A testable hypothesis should be specific and measurable, and it should state a clear relationship between variables that can be tested with data. To ensure that your hypothesis is testable, consider the following:
- Clearly define the key variables in your hypothesis. You should be able to measure and manipulate these variables in a way that allows you to test the hypothesis.
- The hypothesis should predict a specific outcome or relationship between variables that can be measured or quantified.
- You should be able to collect the necessary data within the constraints of your study.
- It should be possible for other researchers to replicate your study, using the same methods and variables.
- Your hypothesis should be testable by using appropriate statistical analysis techniques, so you can draw conclusions, and make inferences about the population from the sample data.
- The hypothesis should be able to be disproven or rejected through the collection of data.
4. How do I revise my research hypothesis if my data does not support it?
If your data does not support your research hypothesis , you will need to revise it or develop a new one. You should examine your data carefully and identify any patterns or anomalies, re-examine your research question, and/or revisit your theory to look for any alternative explanations for your results. Based on your review of the data, literature, and theories, modify your research hypothesis to better align it with the results you obtained. Use your revised hypothesis to guide your research design and data collection. It is important to remain objective throughout the process.
5. I am performing exploratory research. Do I need to formulate a research hypothesis?
As opposed to “confirmatory” research, where a researcher has some idea about the relationship between the variables under investigation, exploratory research (or hypothesis-generating research) looks into a completely new topic about which limited information is available. Therefore, the researcher will not have any prior hypotheses. In such cases, a researcher will need to develop a post-hoc hypothesis. A post-hoc research hypothesis is generated after these results are known.
6. How is a research hypothesis different from a research question?
A research question is an inquiry about a specific topic or phenomenon, typically expressed as a question. It seeks to explore and understand a particular aspect of the research subject. In contrast, a research hypothesis is a specific statement or prediction that suggests an expected relationship between variables. It is formulated based on existing knowledge or theories and guides the research design and data analysis.
7. Can a research hypothesis change during the research process?
Yes, research hypotheses can change during the research process. As researchers collect and analyze data, new insights and information may emerge that require modification or refinement of the initial hypotheses. This can be due to unexpected findings, limitations in the original hypotheses, or the need to explore additional dimensions of the research topic. Flexibility is crucial in research, allowing for adaptation and adjustment of hypotheses to align with the evolving understanding of the subject matter.
8. How many hypotheses should be included in a research study?
The number of research hypotheses in a research study varies depending on the nature and scope of the research. It is not necessary to have multiple hypotheses in every study. Some studies may have only one primary hypothesis, while others may have several related hypotheses. The number of hypotheses should be determined based on the research objectives, research questions, and the complexity of the research topic. It is important to ensure that the hypotheses are focused, testable, and directly related to the research aims.
9. Can research hypotheses be used in qualitative research?
Yes, research hypotheses can be used in qualitative research, although they are more commonly associated with quantitative research. In qualitative research, hypotheses may be formulated as tentative or exploratory statements that guide the investigation. Instead of testing hypotheses through statistical analysis, qualitative researchers may use the hypotheses to guide data collection and analysis, seeking to uncover patterns, themes, or relationships within the qualitative data. The emphasis in qualitative research is often on generating insights and understanding rather than confirming or rejecting specific research hypotheses through statistical testing.
Researcher.Life is a subscription-based platform that unifies the best AI tools and services designed to speed up, simplify, and streamline every step of a researcher’s journey. The Researcher.Life All Access Pack is a one-of-a-kind subscription that unlocks full access to an AI writing assistant, literature recommender, journal finder, scientific illustration tool, and exclusive discounts on professional publication services from Editage.
Based on 21+ years of experience in academia, Researcher.Life All Access empowers researchers to put their best research forward and move closer to success. Explore our top AI Tools pack, AI Tools + Publication Services pack, or Build Your Own Plan. Find everything a researcher needs to succeed, all in one place – Get All Access now starting at just $17 a month !
Related Posts

Levels of Measurement: Nominal, Ordinal, Interval, and Ratio (with Examples)

How to Write a Research Paper Outline (with Examples)
Theory, hypothesis, and operationalization
Approach, theory, model.
First, you have to determine the general state of knowledge (or state of the art) as regards a certain objective. Are there already relevant attempts of explanation (models, theories, approaches, debates)? Many times there are theories already existing that provide a basis for discussing or looking at a certain problem.
When choosing a certain approach to explain complex circumstances, specific aspects of your problem area will be highlighted more prominently. Deciding on an approach means considering which questions can then be answered best. After choosing an approach it is necessary to use its related methods consequently.
Examples for approaches: «Education is an important prerequisite for a society's economic development» or «Earnings from tourism support national economy.»
Hypotheses and presumptions
Hypotheses are assumptions that could explain reality or - in other words - that could be the answer to your question. Such an assumption is based on the current state of research; it therefore delivers an answer that is theoretically possible («proposed solution») and applies at least to some extent to the question posed. When dealing with complex topics it is sometimes easier to develop a number of subordinate working hypotheses from just a few main hypotheses.
Example for a hypothesis: «Tourism offers children the possibility to earn money instead of going to school» or «The more tourists the fewer the children are going to school.»
Not all research projects are conducted by means of methods to test hypotheses. In social research, for example, there are reconstructive or interpretive methods as well. Here you try to explain and understand people's actions based on their interpretation of certain issues ( Bohnsack 2000: 12–13). However, also with such an approach researchers use hypotheses or presumptions to structure their work. The point is not to finally acknowledge or reject those hypotheses. You rather search for explanations that are plausible and comprehensible.
Example for a presumption: «In developing countries parents are skeptical about their children working for the tourism industry.»
However, most of the time one again acts on theses or presumptions. The point is not to finally acknowledge or reject those assumptions. One rather searches for explanations that are plausible and comprehensible.
Example for an explanation: «Parents don't worry about their children not going to school; they are afraid of losing their status when earning less than their children.»
Operationalization
It is necessary to operationalize the terms used in scientific research (that means particularly the central terms of a hypothesis). In order to guarantee the viability of a research method you have to define first which data will be collected by means of which methods. Research operations have to be specified to comprehend a subject matter in the first place ( Bopp 2000: 21). In order to turn the operationalized term into something manageable you determine its exact meaning during a research process.
Example for an operationalization: «When compared to other areas, tourist destinations are areas where children are less likely to go to school.»
Online Guidelines for Academic Research and Writing : The academic research process : Theory, hypothesis, and operationalization
Update: 28.10.2021 ( eLML ) - Contact - Print (PDF) - © OLwA 2011 (Creative Commons)
Scientific Research and Methodology
2.2 conceptual and operational definitions.
Research studies usually include terms that must be carefully and precisely defined, so that others know exactly what has been done and there are no ambiguities. Two types of definitions can be given: conceptual definitions and operational definitions .
Loosely speaking, a conceptual definition explains what to measure or observe (what a word or a term means for your study), and an operational definitions defines exactly how to measure or observe it.
For example, in a study of stress in students during a university semester. A conceptual definition would describe what is meant by ‘stress.’ An operational definition would describe how the ‘stress’ would be measured.
Sometimes the definitions themselves aren’t important, provided a clear definition is given. Sometimes, commonly-accepted definitions exist, so should be used unless there is a good reason to use a different definition (for example, in criminal law, an ‘adult’ in Australia is someone aged 18 or over ).
Sometimes, a commonly-accepted definition does not exist, so the definition being used should be clearly articulated.
Example 2.2 (Operational and conceptual definitions) Players and fans have become more aware of concussions and head injuries in sport. A Conference on concussion in sport developed this conceptual definition ( McCrory et al. 2013 ) :
Concussion is a brain injury and is defined as a complex pathophysiological process affecting the brain, induced by biomechanical forces. Several common features that incorporate clinical, pathologic and biomechanical injury constructs that may be utilised in defining the nature of a concussive head injury include: Concussion may be caused either by a direct blow to the head, face, neck or elsewhere on the body with an “impulsive” force transmitted to the head. Concussion typically results in the rapid onset of short-lived impairment of neurological function that resolves spontaneously. However, in some cases, symptoms and signs may evolve over a number of minutes to hours. Concussion may result in neuropathological changes, but the acute clinical symptoms largely reflect a functional disturbance rather than a structural injury and, as such, no abnormality is seen on standard structural neuroimaging studies. Concussion results in a graded set of clinical symptoms that may or may not involve loss of consciousness. Resolution of the clinical and cognitive symptoms typically follows a sequential course. However, it is important to note that in some cases symptoms may be prolonged.
While this is all helpful… it does not explain how to identify a player with concussion during a game.
Rugby decided on this operational definition ( Raftery et al. 2016 ) :
… a concussion applies with any of the following: The presence, pitch side, of any Criteria Set 1 signs or symptoms (table 1)… [ Note : This table includes symptoms such as ‘convulsion,’ ‘clearly dazed,’ etc.]; An abnormal post game, same day assessment…; An abnormal 36–48 h assessment…; The presence of clinical suspicion by the treating doctor at any time…
Example 2.3 (Operational and conceptual definitions) Consider a study requiring water temperature to be measured.
An operational definition would explain how the temperature is measured: the thermometer type, how the thermometer was positioned, how long was it left in the water, and so on.

Example 2.4 (Operational definitions) Consider a study measuring stress in first-year university students.
Stress cannot be measured directly, but could be assessed using a survey (like the Perceived Stress Scale (PSS) ( Cohen et al. 1983 ) ).
The operational definition of stress is the score on the ten-question PSS. Other means of measuring stress are also possible (such as heart rate or blood pressure).
Meline ( 2006 ) discusses five studies about stuttering, each using a different operational definition:
- Study 1: As diagnosed by speech-language pathologist.
- Study 2: Within-word disfluences greater than 5 per 150 words.
- Study 3: Unnatural hesitation, interjections, restarted or incomplete phrases, etc.
- Study 4: More than 3 stuttered words per minute.
- Study 5: State guidelines for fluency disorders.
A study of snacking in Australia ( Fayet-Moore et al. 2017 ) used this operational definition of ‘snacking’:
…an eating occasion that occurred between meals based on time of day. — Fayet-Moore et al. ( 2017 ) (p. 3)
A study examined the possible relationship between the ‘pace of life’ and the incidence of heart disease ( Levine 1990 ) in 36 US cities. The researchers used four different operational definitions for ‘pace of life’ (remember the article was published in 1990!):
- The walking speed of randomly chosen pedestrians.
- The speed with which bank clerks gave ‘change for two $20 bills or [gave] two $20 bills for change.’
- The talking speed of postal clerks.
- The proportion of men and women wearing a wristwatch.
None of these perfectly measure ‘pace of life,’ of course. Nonetheless, the researchers found that, compared to people on the West Coast,
… people in the Northeast walk faster, make change faster, talk faster and are more likely to wear a watch… — Levine ( 1990 ) (p. 455)

- school Campus Bookshelves
- menu_book Bookshelves
- perm_media Learning Objects
- login Login
- how_to_reg Request Instructor Account
- hub Instructor Commons
- Download Page (PDF)
- Download Full Book (PDF)
- Periodic Table
- Physics Constants
- Scientific Calculator
- Reference & Cite
- Tools expand_more
- Readability
selected template will load here
This action is not available.
1.5: Conceptualizing and operationalizing (and sometimes hypothesizing)
- Last updated
- Save as PDF
- Page ID 122904
Research questions are an essential starting point, but they tend to be too abstract, especially in the beginning. If we’re ultimately about making observations, we need to know more specifically what to observe. Conceptualization is a step in that direction. In this stage of the research process, we specify what concepts and what relationships among those concepts we need to observe. My research question might be How does government funding affect nonprofit organizations? This is fine, but I need to identify what I want to observe much more specifically. Theory (like the crowding out theory I referred to before) and previous research help me identify a set of concepts that I need to consider: different types of government funding, the amount of funding, effects on fundraising, effects on operations management, managerial capacity, donor attitudes, policies of intermediary funding agencies, and so on. It’s helpful at this stage to write what are called nominal definitions of the concepts that are central to my study. These are definitions like what you’d find in a dictionary, but tailored to your study; a nominal definition of government subsidy would describe what I mean in this study when I use the term.
After identifying and defining concepts, we’re ready to operationalize them. To operationalize a concept is to describe how to measure it. (Some authors refer to this as the operational definition , which I find confuses students since it doesn’t necessarily look like a definition.) Operationalization is where we get quite concrete: To operationalize the concept revenue of a nonprofit organization , we might record the dollar amount entered in line 12 of their most recent Form 990 (an income statement nonprofit organizations must file with the IRS annually). This dollar amount will be my measure of nonprofit revenue.
Sometimes, the way we operationalize a concept is more indirect. Public support for nonprofit organizations, for example, is more of a challenge to operationalize. We might write a nominal definition for public support that describes it as having something to do with the sum of individuals’ active, tangible support of a nonprofit organization’s mission. We might operationalize this concept by recording the amount of direct charitable contributions, indirect charitable contributions, revenue from fundraising events, and the number of volunteer hours entered in the respective Form 990 lines.
Note that when we operationalized nonprofit revenue, the operationalization yielded a single measure. When we operationalized public support, however, the operationalization yielded multiple measures. Public support is probably a broader, more complex concept, and it’s hard to think of just one measure that would convincingly measure it. Also, when we’re using measures that measure the concept more indirectly, like our measures for public support, we’ll sometimes use the word indicator instead of measure . The term indicator can be more accurate; we know that measuring something as abstract as public support would be impossible; it is, after all, a social construct, not something concrete. Our measures, then, indicate the level of public support more than actually measure it.
I just slipped in that term, social construct , so we should go ahead and face an issue we’ve been sidestepping so far: Many concepts we’re interested in aren’t observable in the sense that they can’t be seen, felt, heard, tasted, or smelled. But aren’t we supposed to be building knowledge based on observations? Are unobservable concepts off limits for empirical social researchers? Let’s hope not! Lots of important concepts (maybe all the most important concepts) are social constructs, meaning that these terms don’t have meaning apart from the meaning that we, collectively, assign to them. Consider political literacy, racial prejudice, voter intent, employee motivation, issue saliency, self-esteem, managerial capacity, fundraising effectiveness, introversion, and Constitutional ideology. These terms are a shorthand for sets of characteristics that we all more or less agree “belong” to the concepts they name. Can we observe political ideology? Not directly, but we can pretty much agree on what observations serve as indicators for political ideology. We can observe behaviors, like putting bumper stickers on cars, we can see how people respond to survey items, and we can hear how people respond to interview questions. We know we’re not directly measuring political ideology (which is impossible, after all, since it’s a social construct), but we can persuade each other that our measures of political ideology make sense (which seems fitting, since, again, it’s a social construct).
Each indicator or measure—each observation we repeat over and over again—yields a variable . The term variable is one of these terms that’s easier to learn by example than by definition. The definition, though, is something like “a logical grouping of attributes.” (Not very helpful!) Think of the various attributes that could be used to describe you and your friends: brown hair, green eyes, 6’2” tall, brown eyes, black hair, 19 years old, 5’8” tall, blue eyes, and so on. Obviously, some of these attributes go together, like green eyes, brown eyes, and blue eyes. We can group these attributes together and give them a label: eye color. Eye color, then, is a variable. In this example, the variable eye color takes on the values green, brown, and blue. Our goal in making observations is to assign values to variables for cases. Cases are the things—here, you and your friends—that we’re observing and to which we’re assigning values. In social science research, cases are often individuals (like individual voters or individual respondents to a survey) or groups of people (like families or organizations), but cases can also be court rulings, elections, states, committee meetings, and an infinite number of other things that can be observed. The term unit of analysis is used to describe cases, too, but it’s usually a more general term; if your cases are firefighters, then your unit of analysis is the individual.
Getting this terminology—cases, variables, values—is essential. Here are some examples of cases, variables, and values . . .
- Cases: undergraduate college students; variable: classification; values: Freshmen, Sophomore, Junior, Senior;
- Cases: states; variable: whether or not citizen referenda are permitted; values: yes, no;
- Cases: counties; variable: type of voting equipment; values: manual mark, punch card, optical scan, electronic;
- Cases: clients; variable: length of time it took them to see a counselor; values: any number of minutes;
- Cases: Supreme Court dissenting opinions; variable: number of signatories; values: a number from 1 to 4;
- Cases: criminology majors; variable: GPA; values: any number from 0 to 4.0.
Researchers have a language for describing variables. A variable’s level of measurement describes the structure of the values it can take on, whether nominal, ordinal, interval, or ratio. Nominal and ordinal variables are the categorical variables; their values divide up cases into distinct categories. The values of nominal-level variables have no inherent order. The variable sex can take on the values male and female; eye color—brown, blue, and green eyes; major— political science, sociology, biology, etc. Placing these values in one order—brown, blue, green— makes just as much sense as any other—blue, green, brown. The values of ordinal-level variables, though, have an inherent order. Classification—freshmen, sophomore, junior, senior; love of research methods—low, medium, high; class rank—first, second, . . . , 998th. These values can be placed in an order that makes sense—first to last (or last to first), least to most, best to worst, and so on. A point of confusion to be avoided: When we collect and record data, sometimes we assign numbers to values of categorical variables (like brown hair equals 1), but that’s just for the sake of convenience. Those numbers are just placeholders for the actual values, which remain categorical.
When values take on actual numeric values, the variables they belong to are numeric variables. If a numeric variable takes on the value 28, it means there are actually 28 of something—28 degrees, 28 votes, 28 pounds, 28 percentage points. It makes sense to add and subtract these values. If one state has a 12% unemployment rate, that’s 3 more points than a state with a 9% unemployment rate. Numeric variables can be either interval-level variables or ratio-level variables. When ratio-level variables take on the value zero, zero means zero—it means nothing of whatever we’re measuring. Zero votes means no votes; zero senators means no senators. Most numeric variables we use in social research are ratio-level. (Note that many ratio-level variables, like height, age, states’ number of senators, would never actually take on the value zero, but if they did, zero would mean zero.) Occasionally, zero means something else besides nothing of something, and variables that take on these odd zeroes are interval-level variables. Zero degrees means—well, not “no degrees,” which doesn’t make sense. Year zero doesn’t mean the year that wasn’t. We can add and subtract the values of interval-level variables, but we cannot multiply and divide them. Someone born in 996 is not half the age of someone born in 1992, and 90 degrees is not twice as hot as 45.
We can sometimes choose the level of measurement when constructing a variable. We could measure age with a ratio-level variable (the number of times you’ve gone around the sun) or with an ordinal-level variable (check whether you’re 0-10, 11-20, 21-30, or over 30). We should make this choice intentionally because it will determine what kinds of statistical analysis we can do with our data later. If our data are ratio-level, we can do any statistical analysis we want, but our choices are more limited with interval-level data, still more limited with ordinal-level data, and most limited with nominal-level data.
Variables can also be described as being either continuous or discrete. Just like with the level of measurement, we look at the variable’s values to determine whether it’s a continuous or discrete variable. All categorical variables are discrete, meaning their variables can only take on specific, discrete values. This is in contrast to some (but not all!) numeric variables. Take temperature, for example. For any two values of the variable temperature , we can always imagine a case with a value in between them. If Monday’s high is 62.5 degrees and Tuesday’s high is 63.0 degrees, Wednesday’s high could be 62.75 degrees. Temperature, then, measured in degrees, is a continuous variable. Other numeric variables are discrete variables, though. Any variable that is just a count of things is discrete. For the variable number of siblings , Anna has two siblings and Henry has three siblings. We cannot imagine a person with any number of siblings between two and three—nobody could have 2.5 siblings. Number of siblings , then, is a discrete variable. (Note: Some textbooks and websites incorrectly state that all numeric variables are continuous. Do not be misled.)
If we’re engaging in causal research, we can also describe our variables in terms of their role in causal explanation. The “cause” variable is the independent variable . The “effect” variable is the dependent variable. If you’re interested in determining the effect of level of education on political party identification, level of education is the independent variable, and political party identification is the dependent variable.
I’m being a bit loose in using “cause” and “effect” here. Recall the concept of underlying causal mechanism. We may identify independent and dependent variables that really represent a much more complex underlying causal mechanism. Why, for example, do people make charitable contributions? At least four studies have asked whether people are more likely to make a contribution when the person asking for it is dressed nicely. (See the examples cited in Bekkers and Wiepking’s 2010 “A Literature Review of Empirical Studies of Philanthropy,” Nonprofit and Voluntary Sector Quarterly , volume 40, p. 924, which I also commend for its many examples of how social research explores questions of causality.) Do these researchers believe the quality of stitching affects altruism? Sort of, but not exactly. More likely, they believe potential donors’ perceptions of charitable solicitors will shape their attitudes toward the requests, which will make them more or less likely to respond positively. It’s a bit reductionist to say charitable solicitors’ clothing “causes” people to make charitable donations, but we still use the language of independent variables and dependent variables as labels for the quality of the solicitors’ clothing and the solicitees’ likelihood of making charitable donations, respectively. Think carefully about how this might apply anytime an independent variable—sometimes more helpfully called an explanatory variable —is a demographic characteristic. Women, on average, make lower salaries than men. Does sex “cause” salary? Not exactly, though we would rightly label sex as an independent variable and salary as a dependent variable. Underlying this simple dyad of variables is a set of complex, interacting, causal factors—gender socialization, discrimination, occupational preferences, economic systems’ valuing of different jobs, family leave policies, time in labor market—that more fully explain this causal relationship.
Identifying independent variables (IVs) and dependent variables (DVs) is often challenging for students at first. If you’re unsure which is which, try plugging your variables into the following phrases to see what makes sense:
- IV causes DV
- Change in IV causes change in DV
- IV affects DV
- DV is partially determined by IV
- A change in IV predicts a change in DV
- DV can be partially explained by IV
- DV depends on IV
In the later section on formal research designs, we’ll learn about control variables, another type of variable in causal studies often used in conjunction with independent and dependent variables.
Sometimes, especially if we’re collecting quantitative data and planning to conduct inferential statistical analysis, we’ll specify hypotheses at this point in the research process as well. A hypothesis is a statement of the expected relationship between two or more variables. Like operationalizing a concept, constructing a hypothesis requires getting specific. A good hypothesis will not just predict that two (or more) variables are related, but how. So, not Political science majors’ amount of volunteer experience will be related to their choice of courses, but Political science majors with more volunteer experience will be more likely to enroll in the public policy, public administration, and nonprofit management courses . Note that you may have to infer the actual variables; hypotheses often refer only to specific values of the variables. Here, public policy, public administration, and nonprofit management courses are values of the implied variable, types of courses .

Operational Definition Psychology – Definition, Examples, and How to Write One
Elizabeth Research
Every good psychology study contains an operational definition for the variables in the research. An operational definition allows the researchers to describe in a specific way what they mean when they use a certain term. Generally, operational definitions are concrete and measurable. Defining variables in this way allows other people to see if the research has validity . Validity here refers to if the researchers are actually measuring what they intended to measure.
Definition: An operational definition is the statement of procedures the researcher is going to use in order to measure a specific variable.
We need operational definitions in psychology so that we know exactly what researchers are talking about when they refer to something. There might be different definitions of words depending on the context in which the word is used. Think about how words mean something different to people from different cultures. To avoid any confusion about definitions, in research we explain clearly what we mean when we use a certain term.

Operational Definition Examples
Example one:.
A researcher wants to measure if age is related to addiction. Perhaps their hypothesis is: the incidence of addiction will increase with age. Here we have two variables, age and addiction. In order to make the research as clear as possible, the researcher must define how they will measure these variables. Essentially, how do we measure someone’s age and how to we measure addiction?
Variable One: Age might seem straightforward. You might be wondering why we need to define age if we all know what age is. However, one researcher might decide to measure age in months in order to get someone’s precise age, while another researcher might just choose to measure age in years. In order to understand the results of the study, we will need to know how this researcher operationalized age. For the sake of this example lets say that age is defined as how old someone is in years.
Variable Two: The variable of addiction is slightly more complicated than age. In order to operationalize it the researcher has to decide exactly how they want to measure addiction. They might narrow down their definition and say that addiction is defined as going through withdrawal when the person stops using a substance. Or the researchers might decide that the definition of addiction is: if someone currently meets the DSM-5 diagnostic criteria for any substance use disorder. For the sake of this example, let’s say that the researcher chose the latter.
Final Definition: In this research study age is defined as participant’s age measured in years and the incidence of addiction is defined as whether or not the participant currently meets the DSM-5 diagnostic criteria for any substance use disorder.
Example Two
A researcher wants to measure if there is a correlation between hot weather and violent crime. Perhaps their guiding hypothesis is: as temperature increases so will violent crime. Here we have two variables, weather and violent crime. In order to make this research precise the researcher will have to operationalize the variables.
Variable One: The first variable is weather. The researcher needs to decide how to define weather. Researchers might chose to define weather as outside temperature in degrees Fahrenheit. But we need to get a little more specific because there is not one stable temperature throughout the day. So the researchers might say that weather is defined as the high recorded temperature for the day measured in degrees Fahrenheit.
Variable Two: The second variable is violent crime. Again, the researcher needs to define how violent crime is measured. Let’s say that for this study it they use the FBI’s definition of violent crime . This definition describes violent crime as “murder and nonnegligent manslaughter, forcible rape, robbery, and aggravated assault”.
However, how do we actually know how many violent crimes were committed on a given day? Researchers might include in the definition something like: the number of people arrested that day for violent crimes as recorded by the local police.
Final Definition: For this study temperature was defined as high recorded temperature for the day measured in degrees Fahrenheit. Violent crime was defined as the number of people arrested in a given day for murder, forcible rape, robbery, and aggravated assault as recorded by the local police.

How to Write an Operational Definition
For the last example take the opportunity to see if you can write a clear operational definition for yourself. Imagine that you are creating a research study and you want to see if group therapy is helpful for treating social anxiety.
Variable One: How are you going to define group therapy? here are some things you might want to consider when creating your operational definition:
- What type of group therapy?
- Who is leading the therapy group?
- How long do people participate in the therapy group for?
- How can you “measure” group therapy?
There is no one way to write the operational definition for this variable. You could say something like group therapy was defined as a weekly cognitive behavioral therapy group led by a licensed MFT held over the course of ten weeks. Remember there are many ways to write an operational definition. You know you have written an effective one if another researcher could pick it up and create a very similar variable based on your definition.
Variable Two: The second variable you need to define is “effective treatment social anxiety”. Again, see if you can come up with an operational definition of this variable. This is a little tricky because you will need to be specific about what an effective treatment is as well as what social anxiety is. Here are some things to consider when writing your definition:
- How do you know a treatment is effective?
- How do you measure the effectiveness of treatment?
- Who provides a reliable definition of social anxiety?
- How can you measure social anxiety?
Again, there is no one right way to write this operational definition. If someone else could recreate the study using your definition it is probably an effective one. Here as one example of how you could operationalize the variable: social anxiety was defined as meeting the DSM-5 criteria for social anxiety and the effectiveness of treatment was defined as the reduction of social anxiety symptoms over the 10 week treatment period.
Final Definition: Take your definition for variable one and your definition for variable two and write them in a clear and succinct way. It is alright for your definition to be more than one sentence.
Why We Need Operational Definitions
There are a number of reasons why researchers need to have operational definitions including:
- Replicability
- Generalizability
- Dissemination
The first reason was mentioned earlier in the post when reading research others should be able to assess the validity of the research. That is, did the researchers measure what they intended to measure? If we don’t know how researchers measured something it is very hard to know if the study had validity.
The next reason it is important to have an operational definition is for the sake of replicability . Research should be designed so that if someone else wanted to replicate it they could. By replicating research and getting the same findings we validate the findings. It is impossible to recreate a study if we are unsure about how they defined or measured the variables.
Another reason we need operational definitions is so that we can understand how generalizable the findings are. In research, we want to know that the findings are true not just for a small sample of people. We hope to get findings that generalize to the whole population. If we do not have operational definitions it is hard to generalize the findings because we don’t know who they generalize to.
Finally, operational definitions are important for the dissemination of information. When a study is done it is generally published in a peer-reviewed journal and might be read by other psychologists, students, or journalists. Researchers want people to read their research and apply their findings. If the person reading the article doesn’t know what they are talking about because a variable is not clear it will be hard to them to actually apply this new knowledge.
Receive updates from my blog!
- Bipolar Disorder
- Therapy Center
- When To See a Therapist
- Types of Therapy
- Best Online Therapy
- Best Couples Therapy
- Best Family Therapy
- Managing Stress
- Sleep and Dreaming
- Understanding Emotions
- Self-Improvement
- Healthy Relationships
- Student Resources
- Personality Types
- Guided Meditations
- Verywell Mind Insights
- 2023 Verywell Mind 25
- Mental Health in the Classroom
- Editorial Process
- Meet Our Review Board
- Crisis Support
How to Write a Great Hypothesis
Hypothesis Definition, Format, Examples, and Tips
Kendra Cherry, MS, is a psychosocial rehabilitation specialist, psychology educator, and author of the "Everything Psychology Book."
:max_bytes(150000):strip_icc():format(webp)/IMG_9791-89504ab694d54b66bbd72cb84ffb860e.jpg "operational hypothesis in research example")
Amy Morin, LCSW, is a psychotherapist and international bestselling author. Her books, including "13 Things Mentally Strong People Don't Do," have been translated into more than 40 languages. Her TEDx talk, "The Secret of Becoming Mentally Strong," is one of the most viewed talks of all time.
:max_bytes(150000):strip_icc():format(webp)/VW-MIND-Amy-2b338105f1ee493f94d7e333e410fa76.jpg "operational hypothesis in research example")
Verywell / Alex Dos Diaz
- The Scientific Method
Hypothesis Format
Falsifiability of a hypothesis.
- Operationalization
Hypothesis Types
Hypotheses examples.
- Collecting Data
A hypothesis is a tentative statement about the relationship between two or more variables. It is a specific, testable prediction about what you expect to happen in a study. It is a preliminary answer to your question that helps guide the research process.
Consider a study designed to examine the relationship between sleep deprivation and test performance. The hypothesis might be: "This study is designed to assess the hypothesis that sleep-deprived people will perform worse on a test than individuals who are not sleep-deprived."
At a Glance
A hypothesis is crucial to scientific research because it offers a clear direction for what the researchers are looking to find. This allows them to design experiments to test their predictions and add to our scientific knowledge about the world. This article explores how a hypothesis is used in psychology research, how to write a good hypothesis, and the different types of hypotheses you might use.
The Hypothesis in the Scientific Method
In the scientific method , whether it involves research in psychology, biology, or some other area, a hypothesis represents what the researchers think will happen in an experiment. The scientific method involves the following steps:
- Forming a question
- Performing background research
- Creating a hypothesis
- Designing an experiment
- Collecting data
- Analyzing the results
- Drawing conclusions
- Communicating the results
The hypothesis is a prediction, but it involves more than a guess. Most of the time, the hypothesis begins with a question which is then explored through background research. At this point, researchers then begin to develop a testable hypothesis.
Unless you are creating an exploratory study, your hypothesis should always explain what you expect to happen.
In a study exploring the effects of a particular drug, the hypothesis might be that researchers expect the drug to have some type of effect on the symptoms of a specific illness. In psychology, the hypothesis might focus on how a certain aspect of the environment might influence a particular behavior.
Remember, a hypothesis does not have to be correct. While the hypothesis predicts what the researchers expect to see, the goal of the research is to determine whether this guess is right or wrong. When conducting an experiment, researchers might explore numerous factors to determine which ones might contribute to the ultimate outcome.
In many cases, researchers may find that the results of an experiment do not support the original hypothesis. When writing up these results, the researchers might suggest other options that should be explored in future studies.
In many cases, researchers might draw a hypothesis from a specific theory or build on previous research. For example, prior research has shown that stress can impact the immune system. So a researcher might hypothesize: "People with high-stress levels will be more likely to contract a common cold after being exposed to the virus than people who have low-stress levels."
In other instances, researchers might look at commonly held beliefs or folk wisdom. "Birds of a feather flock together" is one example of folk adage that a psychologist might try to investigate. The researcher might pose a specific hypothesis that "People tend to select romantic partners who are similar to them in interests and educational level."
Elements of a Good Hypothesis
So how do you write a good hypothesis? When trying to come up with a hypothesis for your research or experiments, ask yourself the following questions:
- Is your hypothesis based on your research on a topic?
- Can your hypothesis be tested?
- Does your hypothesis include independent and dependent variables?
Before you come up with a specific hypothesis, spend some time doing background research. Once you have completed a literature review, start thinking about potential questions you still have. Pay attention to the discussion section in the journal articles you read . Many authors will suggest questions that still need to be explored.
How to Formulate a Good Hypothesis
To form a hypothesis, you should take these steps:
- Collect as many observations about a topic or problem as you can.
- Evaluate these observations and look for possible causes of the problem.
- Create a list of possible explanations that you might want to explore.
- After you have developed some possible hypotheses, think of ways that you could confirm or disprove each hypothesis through experimentation. This is known as falsifiability.
In the scientific method , falsifiability is an important part of any valid hypothesis. In order to test a claim scientifically, it must be possible that the claim could be proven false.
Students sometimes confuse the idea of falsifiability with the idea that it means that something is false, which is not the case. What falsifiability means is that if something was false, then it is possible to demonstrate that it is false.
One of the hallmarks of pseudoscience is that it makes claims that cannot be refuted or proven false.
The Importance of Operational Definitions
A variable is a factor or element that can be changed and manipulated in ways that are observable and measurable. However, the researcher must also define how the variable will be manipulated and measured in the study.
Operational definitions are specific definitions for all relevant factors in a study. This process helps make vague or ambiguous concepts detailed and measurable.
For example, a researcher might operationally define the variable " test anxiety " as the results of a self-report measure of anxiety experienced during an exam. A "study habits" variable might be defined by the amount of studying that actually occurs as measured by time.
These precise descriptions are important because many things can be measured in various ways. Clearly defining these variables and how they are measured helps ensure that other researchers can replicate your results.
Replicability
One of the basic principles of any type of scientific research is that the results must be replicable.
Replication means repeating an experiment in the same way to produce the same results. By clearly detailing the specifics of how the variables were measured and manipulated, other researchers can better understand the results and repeat the study if needed.
Some variables are more difficult than others to define. For example, how would you operationally define a variable such as aggression ? For obvious ethical reasons, researchers cannot create a situation in which a person behaves aggressively toward others.
To measure this variable, the researcher must devise a measurement that assesses aggressive behavior without harming others. The researcher might utilize a simulated task to measure aggressiveness in this situation.
Hypothesis Checklist
- Does your hypothesis focus on something that you can actually test?
- Does your hypothesis include both an independent and dependent variable?
- Can you manipulate the variables?
- Can your hypothesis be tested without violating ethical standards?
The hypothesis you use will depend on what you are investigating and hoping to find. Some of the main types of hypotheses that you might use include:
- Simple hypothesis : This type of hypothesis suggests there is a relationship between one independent variable and one dependent variable.
- Complex hypothesis : This type suggests a relationship between three or more variables, such as two independent and dependent variables.
- Null hypothesis : This hypothesis suggests no relationship exists between two or more variables.
- Alternative hypothesis : This hypothesis states the opposite of the null hypothesis.
- Statistical hypothesis : This hypothesis uses statistical analysis to evaluate a representative population sample and then generalizes the findings to the larger group.
- Logical hypothesis : This hypothesis assumes a relationship between variables without collecting data or evidence.
A hypothesis often follows a basic format of "If {this happens} then {this will happen}." One way to structure your hypothesis is to describe what will happen to the dependent variable if you change the independent variable .
The basic format might be: "If {these changes are made to a certain independent variable}, then we will observe {a change in a specific dependent variable}."
A few examples of simple hypotheses:
- "Students who eat breakfast will perform better on a math exam than students who do not eat breakfast."
- "Students who experience test anxiety before an English exam will get lower scores than students who do not experience test anxiety."
- "Motorists who talk on the phone while driving will be more likely to make errors on a driving course than those who do not talk on the phone."
- "Children who receive a new reading intervention will have higher reading scores than students who do not receive the intervention."
Examples of a complex hypothesis include:
- "People with high-sugar diets and sedentary activity levels are more likely to develop depression."
- "Younger people who are regularly exposed to green, outdoor areas have better subjective well-being than older adults who have limited exposure to green spaces."
Examples of a null hypothesis include:
- "There is no difference in anxiety levels between people who take St. John's wort supplements and those who do not."
- "There is no difference in scores on a memory recall task between children and adults."
- "There is no difference in aggression levels between children who play first-person shooter games and those who do not."
Examples of an alternative hypothesis:
- "People who take St. John's wort supplements will have less anxiety than those who do not."
- "Adults will perform better on a memory task than children."
- "Children who play first-person shooter games will show higher levels of aggression than children who do not."
Collecting Data on Your Hypothesis
Once a researcher has formed a testable hypothesis, the next step is to select a research design and start collecting data. The research method depends largely on exactly what they are studying. There are two basic types of research methods: descriptive research and experimental research.
Descriptive Research Methods
Descriptive research such as case studies , naturalistic observations , and surveys are often used when conducting an experiment is difficult or impossible. These methods are best used to describe different aspects of a behavior or psychological phenomenon.
Once a researcher has collected data using descriptive methods, a correlational study can examine how the variables are related. This research method might be used to investigate a hypothesis that is difficult to test experimentally.
Experimental Research Methods
Experimental methods are used to demonstrate causal relationships between variables. In an experiment, the researcher systematically manipulates a variable of interest (known as the independent variable) and measures the effect on another variable (known as the dependent variable).
Unlike correlational studies, which can only be used to determine if there is a relationship between two variables, experimental methods can be used to determine the actual nature of the relationship—whether changes in one variable actually cause another to change.
The hypothesis is a critical part of any scientific exploration. It represents what researchers expect to find in a study or experiment. In situations where the hypothesis is unsupported by the research, the research still has value. Such research helps us better understand how different aspects of the natural world relate to one another. It also helps us develop new hypotheses that can then be tested in the future.
Thompson WH, Skau S. On the scope of scientific hypotheses . R Soc Open Sci . 2023;10(8):230607. doi:10.1098/rsos.230607
Taran S, Adhikari NKJ, Fan E. Falsifiability in medicine: what clinicians can learn from Karl Popper [published correction appears in Intensive Care Med. 2021 Jun 17;:]. Intensive Care Med . 2021;47(9):1054-1056. doi:10.1007/s00134-021-06432-z
Eyler AA. Research Methods for Public Health . 1st ed. Springer Publishing Company; 2020. doi:10.1891/9780826182067.0004
Nosek BA, Errington TM. What is replication ? PLoS Biol . 2020;18(3):e3000691. doi:10.1371/journal.pbio.3000691
Aggarwal R, Ranganathan P. Study designs: Part 2 - Descriptive studies . Perspect Clin Res . 2019;10(1):34-36. doi:10.4103/picr.PICR_154_18
Nevid J. Psychology: Concepts and Applications. Wadworth, 2013.
By Kendra Cherry, MSEd Kendra Cherry, MS, is a psychosocial rehabilitation specialist, psychology educator, and author of the "Everything Psychology Book."

An official website of the United States government
The .gov means it’s official. Federal government websites often end in .gov or .mil. Before sharing sensitive information, make sure you’re on a federal government site.
The site is secure. The https:// ensures that you are connecting to the official website and that any information you provide is encrypted and transmitted securely.
- Publications
- Account settings
Preview improvements coming to the PMC website in October 2024. Learn More or Try it out now .
- Advanced Search
- Journal List
- v.53(4); 2010 Aug
Research questions, hypotheses and objectives
Patricia farrugia.
* Michael G. DeGroote School of Medicine, the
Bradley A. Petrisor
† Division of Orthopaedic Surgery and the
Forough Farrokhyar
‡ Departments of Surgery and
§ Clinical Epidemiology and Biostatistics, McMaster University, Hamilton, Ont
Mohit Bhandari
There is an increasing familiarity with the principles of evidence-based medicine in the surgical community. As surgeons become more aware of the hierarchy of evidence, grades of recommendations and the principles of critical appraisal, they develop an increasing familiarity with research design. Surgeons and clinicians are looking more and more to the literature and clinical trials to guide their practice; as such, it is becoming a responsibility of the clinical research community to attempt to answer questions that are not only well thought out but also clinically relevant. The development of the research question, including a supportive hypothesis and objectives, is a necessary key step in producing clinically relevant results to be used in evidence-based practice. A well-defined and specific research question is more likely to help guide us in making decisions about study design and population and subsequently what data will be collected and analyzed. 1
Objectives of this article
In this article, we discuss important considerations in the development of a research question and hypothesis and in defining objectives for research. By the end of this article, the reader will be able to appreciate the significance of constructing a good research question and developing hypotheses and research objectives for the successful design of a research study. The following article is divided into 3 sections: research question, research hypothesis and research objectives.
Research question
Interest in a particular topic usually begins the research process, but it is the familiarity with the subject that helps define an appropriate research question for a study. 1 Questions then arise out of a perceived knowledge deficit within a subject area or field of study. 2 Indeed, Haynes suggests that it is important to know “where the boundary between current knowledge and ignorance lies.” 1 The challenge in developing an appropriate research question is in determining which clinical uncertainties could or should be studied and also rationalizing the need for their investigation.
Increasing one’s knowledge about the subject of interest can be accomplished in many ways. Appropriate methods include systematically searching the literature, in-depth interviews and focus groups with patients (and proxies) and interviews with experts in the field. In addition, awareness of current trends and technological advances can assist with the development of research questions. 2 It is imperative to understand what has been studied about a topic to date in order to further the knowledge that has been previously gathered on a topic. Indeed, some granting institutions (e.g., Canadian Institute for Health Research) encourage applicants to conduct a systematic review of the available evidence if a recent review does not already exist and preferably a pilot or feasibility study before applying for a grant for a full trial.
In-depth knowledge about a subject may generate a number of questions. It then becomes necessary to ask whether these questions can be answered through one study or if more than one study needed. 1 Additional research questions can be developed, but several basic principles should be taken into consideration. 1 All questions, primary and secondary, should be developed at the beginning and planning stages of a study. Any additional questions should never compromise the primary question because it is the primary research question that forms the basis of the hypothesis and study objectives. It must be kept in mind that within the scope of one study, the presence of a number of research questions will affect and potentially increase the complexity of both the study design and subsequent statistical analyses, not to mention the actual feasibility of answering every question. 1 A sensible strategy is to establish a single primary research question around which to focus the study plan. 3 In a study, the primary research question should be clearly stated at the end of the introduction of the grant proposal, and it usually specifies the population to be studied, the intervention to be implemented and other circumstantial factors. 4
Hulley and colleagues 2 have suggested the use of the FINER criteria in the development of a good research question ( Box 1 ). The FINER criteria highlight useful points that may increase the chances of developing a successful research project. A good research question should specify the population of interest, be of interest to the scientific community and potentially to the public, have clinical relevance and further current knowledge in the field (and of course be compliant with the standards of ethical boards and national research standards).
FINER criteria for a good research question
Adapted with permission from Wolters Kluwer Health. 2
Whereas the FINER criteria outline the important aspects of the question in general, a useful format to use in the development of a specific research question is the PICO format — consider the population (P) of interest, the intervention (I) being studied, the comparison (C) group (or to what is the intervention being compared) and the outcome of interest (O). 3 , 5 , 6 Often timing (T) is added to PICO ( Box 2 ) — that is, “Over what time frame will the study take place?” 1 The PICOT approach helps generate a question that aids in constructing the framework of the study and subsequently in protocol development by alluding to the inclusion and exclusion criteria and identifying the groups of patients to be included. Knowing the specific population of interest, intervention (and comparator) and outcome of interest may also help the researcher identify an appropriate outcome measurement tool. 7 The more defined the population of interest, and thus the more stringent the inclusion and exclusion criteria, the greater the effect on the interpretation and subsequent applicability and generalizability of the research findings. 1 , 2 A restricted study population (and exclusion criteria) may limit bias and increase the internal validity of the study; however, this approach will limit external validity of the study and, thus, the generalizability of the findings to the practical clinical setting. Conversely, a broadly defined study population and inclusion criteria may be representative of practical clinical practice but may increase bias and reduce the internal validity of the study.
PICOT criteria 1
A poorly devised research question may affect the choice of study design, potentially lead to futile situations and, thus, hamper the chance of determining anything of clinical significance, which will then affect the potential for publication. Without devoting appropriate resources to developing the research question, the quality of the study and subsequent results may be compromised. During the initial stages of any research study, it is therefore imperative to formulate a research question that is both clinically relevant and answerable.
Research hypothesis
The primary research question should be driven by the hypothesis rather than the data. 1 , 2 That is, the research question and hypothesis should be developed before the start of the study. This sounds intuitive; however, if we take, for example, a database of information, it is potentially possible to perform multiple statistical comparisons of groups within the database to find a statistically significant association. This could then lead one to work backward from the data and develop the “question.” This is counterintuitive to the process because the question is asked specifically to then find the answer, thus collecting data along the way (i.e., in a prospective manner). Multiple statistical testing of associations from data previously collected could potentially lead to spuriously positive findings of association through chance alone. 2 Therefore, a good hypothesis must be based on a good research question at the start of a trial and, indeed, drive data collection for the study.
The research or clinical hypothesis is developed from the research question and then the main elements of the study — sampling strategy, intervention (if applicable), comparison and outcome variables — are summarized in a form that establishes the basis for testing, statistical and ultimately clinical significance. 3 For example, in a research study comparing computer-assisted acetabular component insertion versus freehand acetabular component placement in patients in need of total hip arthroplasty, the experimental group would be computer-assisted insertion and the control/conventional group would be free-hand placement. The investigative team would first state a research hypothesis. This could be expressed as a single outcome (e.g., computer-assisted acetabular component placement leads to improved functional outcome) or potentially as a complex/composite outcome; that is, more than one outcome (e.g., computer-assisted acetabular component placement leads to both improved radiographic cup placement and improved functional outcome).
However, when formally testing statistical significance, the hypothesis should be stated as a “null” hypothesis. 2 The purpose of hypothesis testing is to make an inference about the population of interest on the basis of a random sample taken from that population. The null hypothesis for the preceding research hypothesis then would be that there is no difference in mean functional outcome between the computer-assisted insertion and free-hand placement techniques. After forming the null hypothesis, the researchers would form an alternate hypothesis stating the nature of the difference, if it should appear. The alternate hypothesis would be that there is a difference in mean functional outcome between these techniques. At the end of the study, the null hypothesis is then tested statistically. If the findings of the study are not statistically significant (i.e., there is no difference in functional outcome between the groups in a statistical sense), we cannot reject the null hypothesis, whereas if the findings were significant, we can reject the null hypothesis and accept the alternate hypothesis (i.e., there is a difference in mean functional outcome between the study groups), errors in testing notwithstanding. In other words, hypothesis testing confirms or refutes the statement that the observed findings did not occur by chance alone but rather occurred because there was a true difference in outcomes between these surgical procedures. The concept of statistical hypothesis testing is complex, and the details are beyond the scope of this article.
Another important concept inherent in hypothesis testing is whether the hypotheses will be 1-sided or 2-sided. A 2-sided hypothesis states that there is a difference between the experimental group and the control group, but it does not specify in advance the expected direction of the difference. For example, we asked whether there is there an improvement in outcomes with computer-assisted surgery or whether the outcomes worse with computer-assisted surgery. We presented a 2-sided test in the above example because we did not specify the direction of the difference. A 1-sided hypothesis states a specific direction (e.g., there is an improvement in outcomes with computer-assisted surgery). A 2-sided hypothesis should be used unless there is a good justification for using a 1-sided hypothesis. As Bland and Atlman 8 stated, “One-sided hypothesis testing should never be used as a device to make a conventionally nonsignificant difference significant.”
The research hypothesis should be stated at the beginning of the study to guide the objectives for research. Whereas the investigators may state the hypothesis as being 1-sided (there is an improvement with treatment), the study and investigators must adhere to the concept of clinical equipoise. According to this principle, a clinical (or surgical) trial is ethical only if the expert community is uncertain about the relative therapeutic merits of the experimental and control groups being evaluated. 9 It means there must exist an honest and professional disagreement among expert clinicians about the preferred treatment. 9
Designing a research hypothesis is supported by a good research question and will influence the type of research design for the study. Acting on the principles of appropriate hypothesis development, the study can then confidently proceed to the development of the research objective.
Research objective
The primary objective should be coupled with the hypothesis of the study. Study objectives define the specific aims of the study and should be clearly stated in the introduction of the research protocol. 7 From our previous example and using the investigative hypothesis that there is a difference in functional outcomes between computer-assisted acetabular component placement and free-hand placement, the primary objective can be stated as follows: this study will compare the functional outcomes of computer-assisted acetabular component insertion versus free-hand placement in patients undergoing total hip arthroplasty. Note that the study objective is an active statement about how the study is going to answer the specific research question. Objectives can (and often do) state exactly which outcome measures are going to be used within their statements. They are important because they not only help guide the development of the protocol and design of study but also play a role in sample size calculations and determining the power of the study. 7 These concepts will be discussed in other articles in this series.
From the surgeon’s point of view, it is important for the study objectives to be focused on outcomes that are important to patients and clinically relevant. For example, the most methodologically sound randomized controlled trial comparing 2 techniques of distal radial fixation would have little or no clinical impact if the primary objective was to determine the effect of treatment A as compared to treatment B on intraoperative fluoroscopy time. However, if the objective was to determine the effect of treatment A as compared to treatment B on patient functional outcome at 1 year, this would have a much more significant impact on clinical decision-making. Second, more meaningful surgeon–patient discussions could ensue, incorporating patient values and preferences with the results from this study. 6 , 7 It is the precise objective and what the investigator is trying to measure that is of clinical relevance in the practical setting.
The following is an example from the literature about the relation between the research question, hypothesis and study objectives:
Study: Warden SJ, Metcalf BR, Kiss ZS, et al. Low-intensity pulsed ultrasound for chronic patellar tendinopathy: a randomized, double-blind, placebo-controlled trial. Rheumatology 2008;47:467–71.
Research question: How does low-intensity pulsed ultrasound (LIPUS) compare with a placebo device in managing the symptoms of skeletally mature patients with patellar tendinopathy?
Research hypothesis: Pain levels are reduced in patients who receive daily active-LIPUS (treatment) for 12 weeks compared with individuals who receive inactive-LIPUS (placebo).
Objective: To investigate the clinical efficacy of LIPUS in the management of patellar tendinopathy symptoms.
The development of the research question is the most important aspect of a research project. A research project can fail if the objectives and hypothesis are poorly focused and underdeveloped. Useful tips for surgical researchers are provided in Box 3 . Designing and developing an appropriate and relevant research question, hypothesis and objectives can be a difficult task. The critical appraisal of the research question used in a study is vital to the application of the findings to clinical practice. Focusing resources, time and dedication to these 3 very important tasks will help to guide a successful research project, influence interpretation of the results and affect future publication efforts.
Tips for developing research questions, hypotheses and objectives for research studies
- Perform a systematic literature review (if one has not been done) to increase knowledge and familiarity with the topic and to assist with research development.
- Learn about current trends and technological advances on the topic.
- Seek careful input from experts, mentors, colleagues and collaborators to refine your research question as this will aid in developing the research question and guide the research study.
- Use the FINER criteria in the development of the research question.
- Ensure that the research question follows PICOT format.
- Develop a research hypothesis from the research question.
- Develop clear and well-defined primary and secondary (if needed) objectives.
- Ensure that the research question and objectives are answerable, feasible and clinically relevant.
FINER = feasible, interesting, novel, ethical, relevant; PICOT = population (patients), intervention (for intervention studies only), comparison group, outcome of interest, time.
Competing interests: No funding was received in preparation of this paper. Dr. Bhandari was funded, in part, by a Canada Research Chair, McMaster University.
Get science-backed answers as you write with Paperpal's Research feature
How to Write a Hypothesis? Types and Examples

All research studies involve the use of the scientific method, which is a mathematical and experimental technique used to conduct experiments by developing and testing a hypothesis or a prediction about an outcome. Simply put, a hypothesis is a suggested solution to a problem. It includes elements that are expressed in terms of relationships with each other to explain a condition or an assumption that hasn’t been verified using facts. 1 The typical steps in a scientific method include developing such a hypothesis, testing it through various methods, and then modifying it based on the outcomes of the experiments.
A research hypothesis can be defined as a specific, testable prediction about the anticipated results of a study. 2 Hypotheses help guide the research process and supplement the aim of the study. After several rounds of testing, hypotheses can help develop scientific theories. 3 Hypotheses are often written as if-then statements.
Here are two hypothesis examples:
Dandelions growing in nitrogen-rich soils for two weeks develop larger leaves than those in nitrogen-poor soils because nitrogen stimulates vegetative growth. 4
If a company offers flexible work hours, then their employees will be happier at work. 5
Table of Contents
- What is a hypothesis?
- Types of hypotheses
- Characteristics of a hypothesis
- Functions of a hypothesis
- How to write a hypothesis
- Hypothesis examples
- Frequently asked questions
What is a hypothesis?

A hypothesis expresses an expected relationship between variables in a study and is developed before conducting any research. Hypotheses are not opinions but rather are expected relationships based on facts and observations. They help support scientific research and expand existing knowledge. An incorrectly formulated hypothesis can affect the entire experiment leading to errors in the results so it’s important to know how to formulate a hypothesis and develop it carefully.
A few sources of a hypothesis include observations from prior studies, current research and experiences, competitors, scientific theories, and general conditions that can influence people. Figure 1 depicts the different steps in a research design and shows where exactly in the process a hypothesis is developed. 4
There are seven different types of hypotheses—simple, complex, directional, nondirectional, associative and causal, null, and alternative.
Types of hypotheses
The seven types of hypotheses are listed below: 5 , 6,7
- Simple : Predicts the relationship between a single dependent variable and a single independent variable.
Example: Exercising in the morning every day will increase your productivity.
- Complex : Predicts the relationship between two or more variables.
Example: Spending three hours or more on social media daily will negatively affect children’s mental health and productivity, more than that of adults.
- Directional : Specifies the expected direction to be followed and uses terms like increase, decrease, positive, negative, more, or less.
Example: The inclusion of intervention X decreases infant mortality compared to the original treatment.
- Non-directional : Does not predict the exact direction, nature, or magnitude of the relationship between two variables but rather states the existence of a relationship. This hypothesis may be used when there is no underlying theory or if findings contradict prior research.
Example: Cats and dogs differ in the amount of affection they express.
- Associative and causal : An associative hypothesis suggests an interdependency between variables, that is, how a change in one variable changes the other.
Example: There is a positive association between physical activity levels and overall health.
A causal hypothesis, on the other hand, expresses a cause-and-effect association between variables.
Example: Long-term alcohol use causes liver damage.
- Null : Claims that the original hypothesis is false by showing that there is no relationship between the variables.
Example: Sleep duration does not have any effect on productivity.
- Alternative : States the opposite of the null hypothesis, that is, a relationship exists between two variables.
Example: Sleep duration affects productivity.

Characteristics of a hypothesis
So, what makes a good hypothesis? Here are some important characteristics of a hypothesis. 8,9
- Testable : You must be able to test the hypothesis using scientific methods to either accept or reject the prediction.
- Falsifiable : It should be possible to collect data that reject rather than support the hypothesis.
- Logical : Hypotheses shouldn’t be a random guess but rather should be based on previous theories, observations, prior research, and logical reasoning.
- Positive : The hypothesis statement about the existence of an association should be positive, that is, it should not suggest that an association does not exist. Therefore, the language used and knowing how to phrase a hypothesis is very important.
- Clear and accurate : The language used should be easily comprehensible and use correct terminology.
- Relevant : The hypothesis should be relevant and specific to the research question.
- Structure : Should include all the elements that make a good hypothesis: variables, relationship, and outcome.
Functions of a hypothesis
The following list mentions some important functions of a hypothesis: 1
- Maintains the direction and progress of the research.
- Expresses the important assumptions underlying the proposition in a single statement.
- Establishes a suitable context for researchers to begin their investigation and for readers who are referring to the final report.
- Provides an explanation for the occurrence of a specific phenomenon.
- Ensures selection of appropriate and accurate facts necessary and relevant to the research subject.
To summarize, a hypothesis provides the conceptual elements that complete the known data, conceptual relationships that systematize unordered elements, and conceptual meanings and interpretations that explain the unknown phenomena. 1

How to write a hypothesis
Listed below are the main steps explaining how to write a hypothesis. 2,4,5
- Make an observation and identify variables : Observe the subject in question and try to recognize a pattern or a relationship between the variables involved. This step provides essential background information to begin your research.
For example, if you notice that an office’s vending machine frequently runs out of a specific snack, you may predict that more people in the office choose that snack over another.
- Identify the main research question : After identifying a subject and recognizing a pattern, the next step is to ask a question that your hypothesis will answer.
For example, after observing employees’ break times at work, you could ask “why do more employees take breaks in the morning rather than in the afternoon?”
- Conduct some preliminary research to ensure originality and novelty : Your initial answer, which is your hypothesis, to the question is based on some pre-existing information about the subject. However, to ensure that your hypothesis has not been asked before or that it has been asked but rejected by other researchers you would need to gather additional information.
For example, based on your observations you might state a hypothesis that employees work more efficiently when the air conditioning in the office is set at a lower temperature. However, during your preliminary research you find that this hypothesis was proven incorrect by a prior study.
- Develop a general statement : After your preliminary research has confirmed the originality of your proposed answer, draft a general statement that includes all variables, subjects, and predicted outcome. The statement could be if/then or declarative.
- Finalize the hypothesis statement : Use the PICOT model, which clarifies how to word a hypothesis effectively, when finalizing the statement. This model lists the important components required to write a hypothesis.
P opulation: The specific group or individual who is the main subject of the research
I nterest: The main concern of the study/research question
C omparison: The main alternative group
O utcome: The expected results
T ime: Duration of the experiment
Once you’ve finalized your hypothesis statement you would need to conduct experiments to test whether the hypothesis is true or false.
Hypothesis examples
The following table provides examples of different types of hypotheses. 10 ,11

Key takeaways
Here’s a summary of all the key points discussed in this article about how to write a hypothesis.
- A hypothesis is an assumption about an association between variables made based on limited evidence, which should be tested.
- A hypothesis has four parts—the research question, independent variable, dependent variable, and the proposed relationship between the variables.
- The statement should be clear, concise, testable, logical, and falsifiable.
- There are seven types of hypotheses—simple, complex, directional, non-directional, associative and causal, null, and alternative.
- A hypothesis provides a focus and direction for the research to progress.
- A hypothesis plays an important role in the scientific method by helping to create an appropriate experimental design.
Frequently asked questions
Hypotheses and research questions have different objectives and structure. The following table lists some major differences between the two. 9
Here are a few examples to differentiate between a research question and hypothesis.
Yes, here’s a simple checklist to help you gauge the effectiveness of your hypothesis. 9 1. When writing a hypothesis statement, check if it: 2. Predicts the relationship between the stated variables and the expected outcome. 3. Uses simple and concise language and is not wordy. 4. Does not assume readers’ knowledge about the subject. 5. Has observable, falsifiable, and testable results.
As mentioned earlier in this article, a hypothesis is an assumption or prediction about an association between variables based on observations and simple evidence. These statements are usually generic. Research objectives, on the other hand, are more specific and dictated by hypotheses. The same hypothesis can be tested using different methods and the research objectives could be different in each case. For example, Louis Pasteur observed that food lasts longer at higher altitudes, reasoned that it could be because the air at higher altitudes is cleaner (with fewer or no germs), and tested the hypothesis by exposing food to air cleaned in the laboratory. 12 Thus, a hypothesis is predictive—if the reasoning is correct, X will lead to Y—and research objectives are developed to test these predictions.
Null hypothesis testing is a method to decide between two assumptions or predictions between variables (null and alternative hypotheses) in a statistical relationship in a sample. The null hypothesis, denoted as H 0 , claims that no relationship exists between variables in a population and any relationship in the sample reflects a sampling error or occurrence by chance. The alternative hypothesis, denoted as H 1 , claims that there is a relationship in the population. In every study, researchers need to decide whether the relationship in a sample occurred by chance or reflects a relationship in the population. This is done by hypothesis testing using the following steps: 13 1. Assume that the null hypothesis is true. 2. Determine how likely the sample relationship would be if the null hypothesis were true. This probability is called the p value. 3. If the sample relationship would be extremely unlikely, reject the null hypothesis and accept the alternative hypothesis. If the relationship would not be unlikely, accept the null hypothesis.

To summarize, researchers should know how to write a good hypothesis to ensure that their research progresses in the required direction. A hypothesis is a testable prediction about any behavior or relationship between variables, usually based on facts and observation, and states an expected outcome.
We hope this article has provided you with essential insight into the different types of hypotheses and their functions so that you can use them appropriately in your next research project.
References
- Dalen, DVV. The function of hypotheses in research. Proquest website. Accessed April 8, 2024. https://www.proquest.com/docview/1437933010?pq-origsite=gscholar&fromopenview=true&sourcetype=Scholarly%20Journals&imgSeq=1
- McLeod S. Research hypothesis in psychology: Types & examples. SimplyPsychology website. Updated December 13, 2023. Accessed April 9, 2024. https://www.simplypsychology.org/what-is-a-hypotheses.html
- Scientific method. Britannica website. Updated March 14, 2024. Accessed April 9, 2024. https://www.britannica.com/science/scientific-method
- The hypothesis in science writing. Accessed April 10, 2024. https://berks.psu.edu/sites/berks/files/campus/HypothesisHandout_Final.pdf
- How to develop a hypothesis (with elements, types, and examples). Indeed.com website. Updated February 3, 2023. Accessed April 10, 2024. https://www.indeed.com/career-advice/career-development/how-to-write-a-hypothesis
- Types of research hypotheses. Excelsior online writing lab. Accessed April 11, 2024. https://owl.excelsior.edu/research/research-hypotheses/types-of-research-hypotheses/
- What is a research hypothesis: how to write it, types, and examples. Researcher.life website. Published February 8, 2023. Accessed April 11, 2024. https://researcher.life/blog/article/how-to-write-a-research-hypothesis-definition-types-examples/
- Developing a hypothesis. Pressbooks website. Accessed April 12, 2024. https://opentext.wsu.edu/carriecuttler/chapter/developing-a-hypothesis/
- What is and how to write a good hypothesis in research. Elsevier author services website. Accessed April 12, 2024. https://scientific-publishing.webshop.elsevier.com/manuscript-preparation/what-how-write-good-hypothesis-research/
- How to write a great hypothesis. Verywellmind website. Updated March 12, 2023. Accessed April 13, 2024. https://www.verywellmind.com/what-is-a-hypothesis-2795239
- 15 Hypothesis examples. Helpfulprofessor.com Published September 8, 2023. Accessed March 14, 2024. https://helpfulprofessor.com/hypothesis-examples/
- Editage insights. What is the interconnectivity between research objectives and hypothesis? Published February 24, 2021. Accessed April 13, 2024. https://www.editage.com/insights/what-is-the-interconnectivity-between-research-objectives-and-hypothesis
- Understanding null hypothesis testing. BCCampus open publishing. Accessed April 16, 2024. https://opentextbc.ca/researchmethods/chapter/understanding-null-hypothesis-testing/#:~:text=In%20null%20hypothesis%20testing%2C%20this,said%20to%20be%20statistically%20significant
Paperpal is a comprehensive AI writing toolkit that helps students and researchers achieve 2x the writing in half the time. It leverages 21+ years of STM experience and insights from millions of research articles to provide in-depth academic writing, language editing, and submission readiness support to help you write better, faster.
Get accurate academic translations, rewriting support, grammar checks, vocabulary suggestions, and generative AI assistance that delivers human precision at machine speed. Try for free or upgrade to Paperpal Prime starting at US$19 a month to access premium features, including consistency, plagiarism, and 30+ submission readiness checks to help you succeed.
Experience the future of academic writing – Sign up to Paperpal and start writing for free!
Related Reads:
- Empirical Research: A Comprehensive Guide for Academics
- How to Write a Scientific Paper in 10 Steps
- What is a Literature Review? How to Write It (with Examples)
- How to Paraphrase Research Papers Effectively
Measuring Academic Success: Definition & Strategies for Excellence
You may also like, what is academic writing: tips for students, why traditional editorial process needs an upgrade, paperpal’s new ai research finder empowers authors to..., what is hedging in academic writing , how to use ai to enhance your college..., ai + human expertise – a paradigm shift..., how to use paperpal to generate emails &..., ai in education: it’s time to change the..., is it ethical to use ai-generated abstracts without....
Philosophia Scientiæ
Travaux d'histoire et de philosophie des sciences
Accueil Numéros 15-2 Varia The operationalization of general...
The operationalization of general hypotheses versus the discovery of empirical laws in Psychology
L’enseignement de la méthodologie scientifique en Psychologie confère un rôle paradigmatique à l’opérationnalisation des « hypothèses générales » : une idée sans rapport précis à l’observation concrète se traduit par la tentative de rejeter une hypothèse statistique nulle au profit d’une hypothèse alternative, dite de recherche, qui opérationnalise l’idée générale. Cette démarche s’avère particulièrement inadaptée à la découverte de lois empiriques. Une loi empirique est définie comme un trou nomothétique émergeant d’un référentiel de la forme Ω x M ( X ) x M ( Y ), où Ω est un ensemble d’événements ou d’objets datés dont certains états dans l’ensemble M ( Y ) sont par hypothèse impossibles étant données certaines conditions initiales décrites dans l’ensemble M ( X ) . Cette approche permet de préciser le regard que l’historien des connaissances peut porter sur les avancées descriptives et nomothétiques de la Psychologie empirique contemporaine.
Psychology students learn to operationalise ’general hypotheses’ as a paradigm of scientific Psychology : relatively vague ideas result in an attempt to reject the null hypothesis in favour of an alternative hypothesis, a so-called research hypothesis, which operationalises the general idea. Such a practice turns out to be particularly at odds with the discovery of empirical laws. An empirical law is defined as a nomothetic gap emerging from a reference system of the form Ω x M ( X ) x M ( Y ), where Ω is a set of events or dated objects for which some states in the set M ( Y ) are hypothetically impossible given some initial conditions depicted in the set M ( X ). This approach allows the knowledge historian to carefully scrutinise descriptive and nomothetic advances in contemporary empirical Psychology.
Texte intégral
I wish to express my thanks to Nadine Matton and Éric Raufaste for their helpful comments on a previous version of this article. This work was funded in part by the ANR-07-JCJC-0065-01 programme.
1 This article is the result of the author’s need to elaborate on the persistent dissatisfaction he feels with the methodology of scientific research in Psychology, and more precisely with his perception of the way in which it is taught. It would indeed be presumptuous to present the following criticism as being a criticism of the methodology of scientific research in Psychology as a whole, since the latter is a notion which is too all-encompassing in its scope to serve as a precise description of the diversity of research practice in this vast field. The source of this dissatisfaction is to be found in what [Reuchlin 1992, 32] calls the ‘distance’ between ‘general theory’ and a ‘specific, falsifiable hypothesis’. A certain form of academism shapes the approach to scientific research in Psychology according to a three-stage process for the formulation of hypotheses e.g., [Charbonneau 1988]. When they write the report of an empirical study, researchers in Psychology must supply the grounds for their research by introducing a so-called general (or theoretical) hypothesis, then show how they have tested this hypothesis by restating it as a so-called operational (or research) hypothesis. In principle, this restatement should involve data analysis, finalised by testing at least one inferential statistical hypothesis, the so-called null hypothesis.
2 As a socially regulated procedure, the sequencing of theoretical, operational and null hypotheses—which we refer to here as operationaliza-tion —may not pose scientific problems to researchers who are mainly concerned with adhering to a socio-technical norm. The sense of dissatisfaction arises when this desire for socio-technical compliance is considered in the light of the hope (albeit an admittedly pretentious or naïve hope) of discovering one or more empirical laws, i.e. demonstrating at least one, corroborated general empirical statement, [Vautier 2011].
3 With respect to the discovery of empirical laws, operationalization may be characterised as a paradigm, based on a ‘sandwich’ system, whose workings prove to be strikingly ineffective. The ‘general hypothesis’ (the uppermost layer of the ‘sandwich’ system) is not the statement of an empirical law, but a pre-referential statement, i.e. a statement whose empirical significance has not (yet) been determined. The null hypothesis test (the lower layer of the ‘sandwich’) binds the research procedure to a narrow, pragmatic decision-making approach amid uncertainty— rejection or acceptance of the null hypothesis—which is not germane to the search for empirical laws if the null hypothesis is not a general statement in the strict sense of the term, i.e. held to be true for all the elements in a given set. Between the external layers of the ’sandwich’ system lies the psychotechnical and statistical core of the operationalization paradigm, i.e. the production of psychological measurements to which the variables required for the formulation of the operational hypothesis are linked. Again, the claim here is not that this characterization of research procedure in Psychology applies absolutely universally ; however, operationalization as outlined above does appear to be sufficiently typical of a certain orthodoxy to warrant a thorough critical analysis.
4 This paradigm governs an approach which is destined to establish a favourable view of ‘general hypotheses’ inasmuch as they have psy-chotechnical and inferential support. However, the ideological interest of these statements does not automatically confer them with nomothetic import. Consequently, one cannot help wondering whether the rule of operationalization does not in fact serve to prevent those who practise it from ever discerning a possible historical failure of orthodox Psychology to discover its own empirical laws, by training the honest researcher not to hope for the impossible. After all, we are unlikely to worry about failing to obtain something which we were not looking for in the first place. We shall see that an empirical law consists precisely of stating an empirical impossibility, i.e. a partially deterministic falsifiable statement. As a result, we have inevitably come to question psychological thought as regards the reasons and consequences of an apodictic approach to probabilistic treatment of the empirical phenomena which it is investigating.
5 This article comprises four major parts. First of all, we shall illustrate operationalization on the basis of an example put forward by [Fernandez & Catteeuw 2001]. Next, we shall identify two logical and empirical difficulties which arise from this paradigm and demonstrate that they render it unsuitable for the discovery of empirical laws, then detail the logical structure of these laws. Lastly, we shall identify some methodological guidelines which are compatible with an inductive search for partial determinisms.
1 An example of operationalization : smoking cessation and anxiety
6 [Fernandez & Catteeuw 2001, 125] put forward the following sequence :
General hypothesis : undergoing smoking cessation tends to increase anxiety in smokers rather than reduce it.
Operational hypothesis : smokers undergoing smoking cessation are more prone to anxiety than non-cessation smokers.
Null hypothesis : there is no difference between anxiety scores for smokers undergoing smoking cessation and non-cessation smokers.
7 This example can be expanded so as to offer more opportunities to engage with the critical exercise. There is no difficulty in taking [Fernandez & Catteeuw 2001] operational hypothesis as a ‘general hypothesis’. Their formulation specifies neither the empirical (nominal) meaning of the notion of smoking cessation, nor the empirical (ordinal or quantitative) significance of the notion of anxiety, even though it makes reference to the ordinal operator more prone to anxiety than ; lastly, the noun smokers signifies only an indefinite number of people who smoke.
8 The researcher may have given themselves a set of criteria which is sufficient to decide whether, at the moment when they examine an individual, the person is a smoker or not, and if they are a smoker, another set of criteria sufficient to decide whether or not they are undergoing smoking cessation. These sets of criteria allow the values for two nominal variables to be defined, the first attributing the value of smoker or non-smoker, and the second, which is conditional on the status of ‘smoker’, attributing the value of undergoing cessation or non-cessation. However, the statistical definition of the ’undergoing cessation’ variable requires a domain, i.e. elements assigned a value according to its codomain, the (descriptive) reference system of the variable : {undergoing cessation, non-cessation}. The researcher may circumscribe the domain to pairs (smoker, examination date) which they already have obtain or will obtain during the course of their study, and thus define a so-called independent nominal variable.
9 They then need to specify the function which assigns an anxiety score for each (smoker, examination date) pair, in order to define the ’anxiety score’ statistical variable, taken as the dependent variable. The usual solution for specifying such a function consists in using the answers to an anxiety questionnaire to determine this score, according to a numerical coding rule for the responses to the items on the questionnaire. Such procedures, in which standardised observation of a verbal behaviour is associated with the numerical coding of responses, constitute one of the fundamental contributions of psychotechnics (or psychological testing) to Psychology ; it enables anxiety means conditional on the values of the independent variable to be calculated, whence the operational hypothesis : smokers undergoing smoking cessation are more anxious than non-cessation smokers.
10 The operational hypothesis constitutes a descriptive proposition whose validity can easily be examined. However, to the extent that they consider their sample of observations to be a means of testing a general hypothesis, the researcher must also demonstrate that the mean difference observed is significant, i.e. rejects the null hypothesis of the equality of the means for the statistical populations composed of the two types of smokers, using a probabilistic procedure selected from the available range of inferential techniques, for instance Student’s t -test for independent samples. Only then can the operational hypothesis, considered in the light of the two statistical populations, acquire the status of an alternative hypothesis with respect to the null hypothesis.
11 Now, let us restate the sequence of hypotheses put forward by [Fernandez & Catteeuw 2001] thus :
General hypothesis : smokers undergoing smoking cessation are more anxious than non-cessation smokers
Operational hypothesis : given a pair of variables (‘undergoing cessation’, ‘anxiety score’), mean anxiety conditional on the undergoing cessation value is greater than mean anxiety conditional on the non-cessation value.
Null hypothesis : the two conditional means are equal.
2 Operationalization criticised
12 The example which we have just developed is typical of operational-ization in Psychology, irrespective of the experimental or correlational nature [Cronbach 1957, 1975] of the study. In this section, we make two assertions by dealing with the operationalization approach in reverse : (i) the empirical relevance of the test of the null hypothesis is indeterminate (ii) the statistical fact of a mean difference has no general empirical import.
2.1 The myth of the statistical population
13 To simplify the discussion, let us suppose that the researcher tests the null hypothesis of the equality of two means using Student’s t procedure. The issue at stake in the test from a socio-technical point of view is that by qualifying the difference observed as a significant difference, the cherished notation “p < .05” or “p < .01” may be included in a research paper. The null hypothesis test has been the subject of purely statistical criticisms e.g., [Krueger 2001], [Nickerson 2000] and it is not within the scope of this paper to draw up an inventory of these criticisms. In the empirical perspective under examination here, the problem is that this type of procedure is nothing more than a rhetorical device, insofar as the populations to which the test procedure is applied remain virtual in nature.
14 In practice, the researcher knows how to define their conditional variables on the basis of pairs : (smoker undergoing cessation, examination date) and (non-cessation smoker, examination date), assembled by them through observation. But what is the significance of the statistical population to which the inferential exercise makes reference ? If we consider the undergoing cessation value, for example, how should the statistical population of the (smoker undergoing cessation, examination date) pairs be defined ? Let us imagine a survey which would enable the anxiety score for all the human beings on the planet with the status of ‘smoker undergoing smoking cessation’ to be known on a certain date each month in the interval of time under consideration. We would then have as many populations as we have monthly surveys ; we could then consider grouping together all of these monthly populations to define the population of observations relating to the ‘cessation’ status. There is not one single population, but rather a number of virtual populations. The null hypothesis is therefore based on a mental construct. As soon as this is defined more precisely, questions arise as to its plausibility and the interest of the test. Indeed, why should a survey supply an anxiety variable whose conditional means, subject to change, are identical ?
15 Ultimately, it appears that the null hypothesis test constitutes a decision-making procedure with respect to the plausibility of a hypothesis devoid of any determined empirical meaning. The statistical inference used in the operationalization system is an odd way of settling the issue of generality : it involves deciding whether the difference between observed means may be generalised, even if the empirical meaning of this generality has not been established.
2.2 The myth of the average smoker
16 The difference between the two anxiety means may be interpreted as the difference between the degree of anxiety of the average smoker undergoing cessation and the degree of anxiety of the average non-cessation smoker, which poses two problems. Firstly, the discrete nature of the anxiety score contains a logical dead-end, i.e. the use of an impossibility to describe something which is possible. Let us assume an anxiety questionnaire comprising five items with answers scored 0, 1, 2 or 3, such that the score attributed to any group of 5 responses will fall within the sequence of natural numbers (0, 1, 15). A mean score of 8.2 may indeed ‘summarise’ a set of scores, but cannot exist as an individual score. Consequently, should we wish to use a mean score to describe a typical smoker, it must be recognised that such a smoker is not possible and therefore not plausible. As a result, the difference between the two means cannot be used to describe the difference in degrees of anxiety of the typical smokers, unless it is admitted that a typical smoker is in fact a myth.
17 Let us now assume that the numerical coding technique enables a continuous variable to be defined by the use of so-called analogue response scales. The score of any smoker is by definition composed of the sum of two quantities, the mean score plus the deviation from the mean, the latter expressing the fact that the typical smoker is replaced in practice by a particular specimen of the statistical population, whose variable nature is assumed to be random—without it appearing necessary to have empirical grounds for the probability space on which this notion is based. In these conditions, the mean score constitutes a parameter, whose specification is an empirical matter inasmuch as the statistical population is actually defined. An empirical parameter is not, however, the same thing as an empirical law.
3 Formalization of an empirical law
- 2 This is a more general and radical restatement of the definition given by [Piaget 1970, 17] of the (...)
18 According to the nomothetic perspective, scientific ambition consists in discovering laws, i.e. general implications 2 A general implication is a statement in the following form :
which reads thus “for any x of A , if p ( x ) then q ( x )”, where x is any component of a given set A , and p (•) and q (•) are singular statements. This formalization applies without any difficulty to any situation in which the researcher has a pair of variables ( X , Y ), from a domain Ω n = { ω i , i = 1, …, n }, whose elements w are pairs (person, observation date). The codomain of the independent variable X is a descriptive reference system of initial conditions M ( X ) = ( x i , i = 1, …, k }, whilst the dependent variable, Y , specifies a value reference system, M ( Y ) = ( y i , i = 1, …, l }, the effective observation of which depends, by hypothesis, on the independent conditions. Thus, the onto-logical substrate of an empirical law is the observation reference system Ω x M ( X ) x M ( Y ), where Ω ⊃ Ω is an extrapolation of Ω n : any element of Ω is, as a matter of principle, assigned a unique value in M ( X ) x M ( Y ) by means of the function ( X , Y ).
19 Two comments arise from this definition. Firstly, as noted by [Popper 1959, 48], “[natural laws] do not assert that something exists or is the case ; they deny it”. In other words, they state a general ontological impossibility in terms of Ω x M ( X ) x M ( Y ) : a law may indeed by formulated by identifying the initial conditions α ( X ) ⊂ M ( X ) for which a non-empty subset β ( Y ) ⊂ M ( Y ) exists such that,
This formulation excludes the possibility of X ( ω ) ∈ α ( Y ) and Y ( ω ) ∈ ∁ β ( Y ) being observed, where ∁ β ( Y ) designates the complementary set β ( Y ) with respect to M ( Y ). Making a statement in the form of (2) amounts to stating a general empirical fact in terms of Ω n , and an empirical law in terms of Ω, by inductive generalisation. This law can be falsified, simply by exhibiting an example of what is said to be impossible in order to falsify it. The general nature of the statement stems from the quantifier ∀ and its empirical limit is found in the extension of Ω. The law may then be corroborated or falsified. If it is corroborated, it is possible to measure its degree of corroboration by the number of observations applying to it, i.e. by the cardinality of the equivalence class formed by the antecedents of α ( X )—the class is noted Cl Ω n/X [ α ( X )].
20 The second comment relates to the notion of partial determinism. The mathematical culture passed on through secondary school teaching familiarises honest researchers with the notion of numerical functions y = f ( x ), which express a deterministic law, i.e. that x being given, y necessarily has a point value. If the informative nature of the law is envisaged in negative terms [Dubois & Prade 2003], the necessity of the point is defined as the impossibility of its complement. In the field of humanities [Granger 1995], seeking total determinisms appears futile, but this does not imply that there is no general impossibility in Ω x M ( X ) x M ( Y ) and therefore no partial determinism. The fact that partial determinism may not have a utility value from the point of view of social or medical decision-making engineering has nothing to do with its fundamental scientific value. The subject of nomothetic research therefore appears in the form of a ‘gap’ in a descriptive reference system, this gap being theoretically interpreted as the effect of a general ontological impossibility. This is why in teaching, a methodology to support the nomothetic goal of training student researchers to ’search for the impossible’ is called for.
4 How to seek the impossible
21 Discovery of a gap in the descriptive reference system involves the discovery of a general empirical fact, from which an empirical law is inferred by extending the set of observations Ω n to an unknown phe-nomenological field Ω ⊃ Ω n (e.g. future events). A general empirical fact makes sense only with reference to the descriptive reference system M ( X ) x M ( Y ). Practically speaking, dependent and independent variables are multivariate. Let X = ( X 1 , X 2 , ..., X p ) be a series of p independent variables and M ( X ) the reference system of X ; M ( X ) is the Cartesian product of the p reference systems M ( X i ), i = 1, …, p . Similarly, let Y = ( Y 1 , ..., Y q ) be a series of q dependent variables and M ( Y ) the reference system of Y . The descriptive reference system of the study is therefore :
Thus the contingency table (the rows of which represent the multivari-ate values of X , and the columns the multivariate values of Y ) can be defined. Observation readings are then carried out so that the cells in the contingency table are gradually filled in... or remain empty.
22 Two cases must be distinguished here. The first corresponds to the situation in which the researcher is completely ignorant of what is happening in their observation reference system, in other words, they do not have any prior observations. They therefore have to carry out some kind of survey in order to learn more. Knowing what is happening in the reference system means knowing the frequency of each possible state. It does not involve calling on the notion of probability (the latter being firmly in the realm of mathematical mythology) since it would involve knowing the limit of the frequency of each cell in the contingency table as the number of observations ( n ) tends towards infinity.
- 3 “But in terms of truth, scientific psychology does not deal with natural objects. It deals with te (...)
23 A nomothetic gap arises when there is at least one empty cell in at least one row of the contingency table, when the margin of the row (or rows) is well above the cardinality of M (Y ). It is possible to identify all the gaps in the reference system only if its cardinality is well below the cardinality of lln, n. This empirical consideration sheds light on a specific epistemological drawback in Psychology : not only are its descriptive reference systems not given naturally, as emphasised by [Danziger 1990, 2], 3 but in addition the depth of constructible reality is such that its cardinality may be gigantic—so much so that discussing what is happening in an observation reference system cannot be achieved in terms of sensible intuition. The fact is that the socio-technical norms which shape the presentation of the observation techniques used in empirical studies do not refer either to the notion of descriptive reference system or the necessity of plotting the cardinality card[ M ( X ) x M ( Y )] against the cardinality of the set of observations, card(Ω n ) = n . If the quotient card[ M ( X ) x M ( Y )]/ n is not much lower than 1, planning to carry out an exhaustive examination of the nomothetic gaps in the descriptive reference system is unfeasible. This does not prevent the researcher from working on certain initial conditions α ( X ), but in such cases it must nonetheless be established that dividing the number of values of M ( Y ) by the cardinality of the class Cl Ω n/ X [ α ( X )] of antecedents of α ( X ) in Ω n gives a result which is far less than 1.
24 Let us now present the second case, for which it is assumed that the researcher has been lucky enough to observe the phenomenon of a gap, whose ’coordinates’ in the descriptive reference system of the study are [ α ( X ), ∁ β ( Y )]. The permanent nature of this gap constitutes a proper general hypothesis. This hypothesis should be tested using a targeted observation strategy. Indeed, accumulating observations in l is of interest from the point of view of the hypothesis if these observations are such that : — X ( ω ) ∈ α ( X ), in which case we seek to verify that Y ( ω ) ∈ β ( Y ), — Y ( ω ) ∈ ∁ β ( Y ), in which case we seek to verify that X ( ω ) ∈ ∁ α ( X ).
This approach to observation is targeted, and indeed makes sense, in that it focuses on a limited number of states : the researcher knows exactly what they are looking for. It is the very opposite of blindly reproducing an experimental plan or survey plan.
25 When a counterexample is discovered, i.e. ω e exists such that X ( ω e ) ∈ α ( X ) and Y ( ω e ) ∈ ∁ β ( Y ), this observation falsifies the general hypothesis. The researcher can then decide either to reject the hypothesis or to defend it. If they decide to defend it, they may restrict the set of conditions α ( X ), or try to find a variable X p +1 which modulates verification of the rule. Formally speaking, this modulating variable is such that there is a strict non-empty subset of M ( X p +1 )—let this be γ ( X p +1 )—such that :
Irrespective of how they revise the original hypothesis, they will have to restrict its domain of validity with respect to the—implicit—set of possible descriptive reference systems. A major consequence of revising the law by expanding the descriptive reference system of initial conditions is resetting the corroboration counter, since the world being explored has been given an additional descriptive dimension : this is the reference system Ω x M ( X 1 ) x M ( Y ), where X 1 = ( X , X p +1 ).
4.1 Example
26 Without it being necessary to develop the procedure presented here in its entirety, we can illustrate it using the example of smokers’ anxiety. The problem consists of restating the ’general hypothesis’ as a statement which is (i) general, properly speaking, as understood in (1) –, and (ii) falsifiable. We may proceed in two stages. Firstly, it is not necessary to talk in terms of reference systems to produce a general statement. Expressing the problem in terms of the difference between two means is not relevant to what is being sought ; however, the idea according to which any smoker undergoing cessation becomes more anxious may be examined, along the lines of the ’general hypothesis’ described by [Fernandez & Catteeuw 2001]. This idea is pre-referential inasmuch as we are unable to define a smoker, a smoker undergoing cessation, or a person who is becoming more anxious.
27 Since we cannot claim to be able to actually settle these issues of definition, we shall use certain definitions for the purposes of convenience. Let U be a population of people and T a population of dates on which they were observed. Let Ω n be a subset of U x T x T such that, for any triplet ω = ( u , t 1 , t 2 ), u is known on dates t 1 and t 2 in terms of their status as : — a non-smoker, a smoker undergoing cessation or a non-cessation smoker — and their state of anxiety, for instance with reference to a set of clinical signs, of which the person is asked to evaluate the intensity on date t , using a standard ‘state-anxiety’ questionnaire.
28 It can be noted that the set Ω n is a finite, non-virtual set, in that a person u whose smoker status is not known on date t 1 or t 2 for example, constitutes a triplet which does not belong to this set. According to our approach to the statistical population, it is not necessary for the observations to be the result of applying a specific random sampling technique. Since Ω n constitutes a set of known observations from the point of view of the descriptive reference system, it is a numbered set, to which new observations can be added over time ; whence the notation Ω nj (read “j-mat”), where n j stands for the cardinality of the most recent update to the set of observations.
- 4 It may be noted that an observation p such that X j ( p ) = ( n f, f 2 ) is not plausible ; this relates t (...)
29 We can then define the following variables X j and Y j , from the subset P j of Ω nj , which includes the triplets ( u , t 1 , t 2 ) such that t 2 – t 1 = d , where d is a transition time (e.g. 2 days). The variable X j matches any component of P j with an image in M ( X j ) = { n f, f 1 , f 2 } x { n f, f 1 , f 2 } where n f, f 1 and f 2 signify ‘non-smoker’, ‘non-cessation smoker’ and ‘smoker undergoing cessation’ respectively. Let us call α ( X j ) the subset of M ( X j ) including all the pairs of values ending in f 2 which do not begin with f 2 and take an element p ∈ P j , : the proposition ‘ X j ( p ) ∈ α ( X j )’ means that in the period during which they were observed, person u had been undergoing smoking cessation for two days whereas they have not been before. 4
30 The dependent variable Y j must now be defined. Let us assume that for any sign of anxiety, we have a description on an ordinal scale (i.e., a Likert scale). Anxiety can then be described as a multivariate state varying within a descriptive reference system A . Consider A x A ; in this set a subset β ( Y j ) can be defined which includes changes in states defined as a worsening of the state of anxiety. The variable Y j can then be defined, which, for each p ∈ P j , corresponds to a state in M ( Y j ). The proposition ‘ Y j ( p ) ∈ β ( Y j )’ signifies that in the period during which they were observed, person u became more anxious. Lastly, the general hypothesis can be formulated in terms which ensure that it may be falsified :
31 We have just illustrated an apparently hypothetical-deductive approach ; but in fact it is an exploratory procedure if the community is not aware of any database enabling a nomothetic gap to be identified. Let us assume that the work of the researcher leads to the provision of a database Ω 236 for the community and that sets α ( X j ) and β ( Y j ) are defined after the fact, such that at least one general fact may be stated. The community with an interest in the general fact revealed by this data may seek new supporting or falsifying observations in order to help update the database.
32 If a researcher finds an individual v , with q = ( v , t v 1 , t v 2 ) and t v 2 – t v 1 = d , such that X j ( q ) ∈ α ( X j ) and Y j ( q ) ∈ ∁ β ( Y j ), this means that there is a smoker who has been undergoing cessation for two days, whose anxiety has not worsened. Let us assume that the researcher investigates whether the person was already ‘very anxious’ ; they may suggest that rule (5) should be revised so as to exclude people whose initial clinical state corresponds to certain values in the reference system A . This procedure usually consists in restricting the scope of validity of the general hypotheses.
5 Discussion
- 5 [Meehl 1967] noted several decades ago that the greater the ‘experimental precision’, i.e. sample (...)
33 Operationalization in Psychology consists in restating a pre-referential proposition in order to enable the researcher to test a statistical null hypothesis, the rejection of which enables the ‘general hypothesis’ to be credited with a certain degree of acceptability. 5 Using an example taken from [Fernandez & Catteeuw 2001], we have shown that the aim of such a procedure is not the discovery of empirical laws, i.e. the discovery of nomothetic gaps in a reference system. We shall discuss two consequences of our radical approach to seeking empirical laws in an observation reference system Ω x M ( X ) x M ( Y ). The first relates to the methodology for updating the state of knowledge in a field of research, the second to the probabilistic interpretation of accumulated observations.
34 The state of knowledge in a given field of research can be apprehended in practical terms by means of a list of m so-called scientific publications. Let us call this set composed of specialist literature Lm and let Zj be an element in this list. The knowledge historian can then ask the following question : does text Zj allow an observation reference system of the type Ω n x M ( X ) x M ( Y ) to be defined ? Such a question can only be answered in the affirmative if it is possible to specify the following :
n > 0 pairs ( u , t ),
p > 0 reference systems enabling the description of the initial conditions affecting the n pairs ( u , t ),
q > 0 reference systems enabling the description of states affecting the n pairs ( u , t ) according to the initial conditions in which they are found.
35 Specifying a descriptive reference system consists in identifying a finite set of mutually exclusive values. Not all the description methods used in Psychology allow such a set to be defined ; for example, a close examination of the so-called Exner scoring system [Exner 1995] for verbatims which may be collected for any [Rorschach 1921] test card did not enable us to determine the Cartesian product of the possible values. And yet, to find a gap in a reference system, this reference system must be constituted, so as to form a stabilised and objective descriptive framework. Faced with such a situation, a knowledge historian would be justified in describing a scientific era in which research is based on such a form of descriptive methodology as being a pre-referential age.
- 6 We cannot simply classify the sources of score-subjectivity as measurement errors in the quantitat (...)
36 With regard to the matter of the objectivity of a descriptive reference system, we shall confine ourselves to introducing the notion of score-objectivity. Let P = ( p i , i = 1, …, z } be a set of Psychologists and ω j ∈ Ω. ( X , Y ) i ( ω j ) is the value of ( ω j ) in M ( X ) x M ( Y ) as determined by the Psychologist p i . We may say that M ( X ) x M ( Y ) is score-objective relative to P if ( X , Y ) i ( ω j ) depends only on j for all values of j . If a descriptive reference system is not score-objective, an event in Ω x M ( X ) x M ( Y ) which occurs in a gap cannot categorically be interpreted as a falsifying observation, since it may depend on a particular feature of the way the reporting Psychologist views it. Unless and until the descriptive definition of an event is regulated in a score-objective manner, the nomothetic aspiration appears to be premature, since it requires the objective world to be singular in nature. 6 Only once a descriptive reference system has been identified may the knowledge historian test its score-objectivity experimentally.
- 7 This type of database, established by merging several databases, has nothing to do with the aggreg (...)
37 The historian might well discover that a field of research is in fact associated with the use of divergent description reference systems. Their task would then be to connect these different fields of reality by attempting to define the problem of the correspondence between the impossibilities identified in the field R a and the impossibilities identified in the field R b —which assumes such identification is possible. Given a certain descriptive reference system of cardinality c, the historian may evaluate its explorability and perhaps note that certain description reference systems are inexplorable. Concerning explorable reference systems, they could perhaps try to retrieve data collected during the course of empirical studies, constitute an updated database, and seek nomothetic gaps in it. 7
38 Let us now move on to the second point of this discussion. If the reference system is explorable and assumed to be score-objective, it may be that each of its possible states has been observed at least once. In this case, the descriptive reference system is sterile from the nomothetic point of view and this constitutes a singular observation fact : everything is possible therein. In other words, given an object in a certain initial state, nothing can be asserted regarding its Y -state. This does not prevent the decision-making engineer from wagering on the object’s Y -state based on the distribution of Y -states, conditioned by the initial conditions in which the object is found. These frequencies may be used to measure ’expectancies’, but they do not form a basis on which to deduce the existence of a probability function for these states. Indeed, defining a random variable Y or Y | X requires the definition of a probability space on the basis of the possible states M ( X ) x M ( Y ). In order to be probabilistic, such a space requires a probability space established on the basis of Ω e.g. [Renyi 1966]. Since Ω is a virtual set, adding objective probabilities to it is wishful thinking : seeing ( X , Y ) as a pair of random variables constitutes an unfalsifiable interpretation. Since such an interpretation is nonetheless of interest for making decisions, the existence of a related law of probability being postulated, the probability of a given state may be estimated on the basis of its frequency. The higher the total number of observations, the more accurate this estimation will be, which is why a database established by bringing together the existing databases is of interest. With the advent of the internet, recourse to probabilistic mythology no longer requires the inferential machinery of null-hypotheses testers to be deployed ; it rather requires the empirical stabilization of the parameters of the mythical law.
39 We conclude this critical analysis with a reminder that scientific research in Psychology is also aimed at the discovery of empirical laws. This requires two types of objectives to be distinguished with care : practical objectives, which focus on decision amid uncertainty, and nomoth-etic objectives, which focus on the detection of empirical impossibilities. Has so-called scientific Psychology been able to discover any empirical laws, and if so, what are they ? From our contemporary standpoint, this question is easy to answer in principle—if not in practice.
Bibliographie
charbonneau, c. — 1988, Problématique et hypothèses d’une recherche, in Fondements et étapes de la recherche scientifique en psychologie, edited by Robert, m., Edisem, 3rd ed., 59-77.
Cronbach, l. j. — 1957, The two disciplines of scientific psychology, American Psychologist, 12, 671-684. — 1975, Beyond the two disciplines of scientific psychology, American Psychologist, 30, 116-127.
Danziger, k. — 1990, Constructing the subject : Historical origins of psychological research , New York : Cambridge University Press.
Dubois, D. & Prade, H. — 2003, Informations bipolaires : une introduction, Information Interaction Intelligence , 3, 89-106.
Exner, J. E. Jr — 1995, Le Rorschach : un système intégré, Paris : Éditions Frison-Roche (A. Andronikof, traduction).
Fernandez, L. & Catteeuw, M. — 2001, La recherche en psychologie clinique , Paris : Nathan Université.
Granger, G.-G. — 1995, La science et les sciences, Paris : Presses Universitaires de France, 2nd ed.
Krueger, J. — 2001, Null hypothesis significance testing, American Psychologist, 56, 16-26.
Meehl, P. H. — 1967, Theory-testing in psychology and physics : A methodological paradox, Philosophy of Science, 34, 103-115.
Nickerson, R. S. — 2000, Null hypothesis significance testing : A review of an old and continuing controversy, Psychological Methods, 5, 241-301.
Piaget, J. — 1970, Epistémologie des sciences de l’homme, Paris : Gallimard.
Popper, K. R. — 1959, The logic of scientific discovery, Oxford England : Basic Books.
Renyi, A. — 1966, Calcul des probabilités, Paris : Dunod (C. Bloch, trad.).
Reuchlin, M. — 1992, Introduction à la recherche en psychologie, Paris : Nathan Université.
Rorschach, H. — 1921, Psychodiagnostik, Bern : Bircher (Hans Huber Verlag, 1942).
Rosenthal, R. & DiMatteo, M. R. — 2001, Meta-analysis : Recent developments in quantitative methods for literature reviews, Annual Review of Psychology, 52, 59-82.
Stigler, S. M. — 1986, The history of statistics : The measurement of uncertainty before 1900 , Cambridge, MA : The Belknap Press of Harvard University Press.
Vautier, S. — 2011, How to state general qualitative facts in psychology ?, Quality & Quantity, 1-8. URL http ://dx.doi.org/10.1007/s11135-011-9502-5 .
2 This is a more general and radical restatement of the definition given by [Piaget 1970, 17] of the notion of laws. For him laws designate “relatively constant quantitative relations which may be expressed in the form of mathematical functions”, “general fact” or “ordinal relationships, [...] structural analyses, etc. which are expressed in ordinary language or in more or less formalized language (logic, etc.)”.
3 “But in terms of truth, scientific psychology does not deal with natural objects. It deals with test scores, evaluation scales, response distributions, series lists, and countless other items which the researcher does not discover but rather constructs with great care. Conjectures about the world, whatever they may be, cannot escape from this universe of artefacts.”
4 It may be noted that an observation p such that X j ( p ) = ( n f, f 2 ) is not plausible ; this relates to the question of the definition of the state of cessation and does not affect the structure of the logic.
5 [Meehl 1967] noted several decades ago that the greater the ‘experimental precision’, i.e. sample size, the easier it is to corroborate the alternative hypothesis.
6 We cannot simply classify the sources of score-subjectivity as measurement errors in the quantitative domain [Stigler 1986], since most descriptive reference systems in Psychology are qualitative ; diverging viewpoints for the same event described in a certain descriptive reference system represent an error, not of measurement, but of definition.
7 This type of database, established by merging several databases, has nothing to do with the aggregation methodology of ‘meta-analyses’ based on the use of statistical summaries e.g., [Rosenthal & DiMatteo 2001].
Pour citer cet article
Référence papier.
Stéphane Vautier , « The operationalization of general hypotheses versus the discovery of empirical laws in Psychology » , Philosophia Scientiæ , 15-2 | 2011, 105-122.
Référence électronique
Stéphane Vautier , « The operationalization of general hypotheses versus the discovery of empirical laws in Psychology » , Philosophia Scientiæ [En ligne], 15-2 | 2011, mis en ligne le 01 septembre 2014 , consulté le 29 avril 2024 . URL : http://journals.openedition.org/philosophiascientiae/656 ; DOI : https://doi.org/10.4000/philosophiascientiae.656
Stéphane Vautier
OCTOGONE-CERPP, Université de Toulouse (France)
Droits d’auteur
Le texte et les autres éléments (illustrations, fichiers annexes importés), sont « Tous droits réservés », sauf mention contraire.
Numéros en texte intégral
- 28-1 | 2024 Richesse et variété du néokantisme : Helmholtz, Cassirer, Vaihinger
- 27-3 | 2023 Études poincaréiennes (II)
- 27-2 | 2023 Études poincaréiennes (I)
- 27-1 | 2023 La « parenthèse Vichy » ?
- 26-3 | 2022 Gestalts praxéologiques. Quand la philosophie, les sciences cognitives et la sociologie rencontrent la psychologie de la forme
- 26-2 | 2022 Patrimonialisation des mathématiques (XVIIIe-XXe siècles)
- 26-1 | 2022 La désuétude conceptuelle : abandon ou transformation ?
- 25-3 | 2021 L’analyse dans les mathématiques grecques
- 25-2 | 2021 Mathématique et philosophie leibniziennes à la lumière des manuscrits inédits
- 25-1 | 2021 The Peano School: Logic, Epistemology and Didactics
- 24-3 | 2020 Lectures et postérités de La Philosophie de l’algèbre de Jules Vuillemin
- 24-2 | 2020 Philosophies de la ressemblance
- 24-1 | 2020 Les mathématiques dans les écoles militaires (XVIIIe-XIXe siècles)
- 23-3 | 2019 Les circulations scientifiques internationales depuis le début du XX e siècle
- 23-2 | 2019 Expérimentation dans les sciences de la nature Expérimentation dans les sciences humaines et sociales
- 23-1 | 2019 Y a-t-il encore de la place en bas ?
- 22-3 | 2018 Sur la philosophie scientifique et l’unité de la science
- 22-2 | 2018 Études de cas en épistémologie sociale
- 22-1 | 2018 Science(s) et édition(s) des années 1780 à l'entre-deux-guerres
- 21-3 | 2017 N'allez pas croire !
- 21-2 | 2017 Raymond Ruyer
- 21-1 | 2017 Homage to Galileo Galilei 1564-2014
- 20-3 | 2016 Le scepticisme selon Jules Vuillemin
- 20-2 | 2016 Circulations et échanges dans l'espace euro-méditerranéen (XVIIIe-XXIe siècles)
- 20-1 | 2016 Le kantisme hors des écoles kantiennes
- 19-3 | 2015 The Bounds of Naturalism
- 19-2 | 2015 Circulations et échanges mathématiques
- 19-1 | 2015 Logic and Philosophy of Science in Nancy (II)
- 18-3 | 2014 Logic and Philosophy of Science in Nancy (I)
- 18-2 | 2014 Hugo Dingler et l’épistémologie pragmatiste en Allemagne
- 18-1 | 2014 Standards of Rigor in Mathematical Practice
- 17-3 | 2013 Tacit and Explicit Knowledge: Harry Collins’s Framework
- 17-2 | 2013 The Mind–Brain Problem in Cognitive Neuroscience
- 17-1 | 2013 The Epistemological Thought of Otto Hölder
- 16-3 | 2012 Alan Turing
- 16-2 | 2012 Modal Matters
- 16-1 | 2012 From Practice to Results in Logic and Mathematics
- 15-3 | 2011 L'espace et le temps
- 15-2 | 2011 La syllogistique de Łukasiewicz
- 15-1 | 2011 Hugh MacColl after One Hundred Years
- 14-2 | 2010 Louis Rougier, De Torricelli à Pascal
- 14-1 | 2010
- 13-2 | 2009
- 13-1 | 2009
- 12-2 | 2008 Normes et santé
- 12-1 | 2008 (Anti-)Realisms: The Metaphysical Issue
- 11-2 | 2007
- 11-1 | 2007 Karl Popper : un philosophe dans le siècle
- 10-2 | 2006 Louis Rougier : vie et œuvre d'un philosophe engagé
- 10-1 | 2006 Jerzy Kalinowski : logique et normativité
- 9-2 | 2005 Aperçus philosophiques en logique et en mathématiques
- 9-1 | 2005
- 8-2 | 2004 Logique & théorie des jeux
- 8-1 | 2004 Le problème de l’incommensurabilité, un demi-siècle après
Cahiers spéciaux
- CS 7 | 2007 Louis Rougier : vie et œuvre d'un philosophe engagé
- CS 6 | 2006 Constructivism: Mathematics, Logic, Philosophy and Linguistics
- CS 5 | 2005 Fonder autrement les mathématiques
Tous les numéros
Collection numérisée, présentation.
- Les comités
- Instructions aux auteurs
- Indications techniques
Informations
- Mentions légales et crédits
- Politiques de publication
Appels à contributions
- Appels en cours
- Appels clos
Suivez-nous
Lettres d’information
- La Lettre d’OpenEdition
Affiliations/partenaires
- Revue soutenue par l’Institut des sciences humaines et sociales (InSHS) du CNRS, 2023-2024
ISSN électronique 1775-4283
Voir la notice dans le catalogue OpenEdition
Plan du site – Mentions légales et crédits – Flux de syndication
Politique de confidentialité – Gestion des cookies – Signaler un problème
Nous adhérons à OpenEdition – Édité avec Lodel – Accès réservé
Vous allez être redirigé vers OpenEdition Search
IMAGES
VIDEO
COMMENTS
Concept Examples of operationalization; Overconfidence: The difference between how well people think they did on a test and how well they actually did (overestimation).; The difference between where people rank themselves compared to others and where they actually rank (overplacement).; Creativity: The number of uses for an object (e.g., a paperclip) that participants can come up with in 3 ...
The operational hypothesis is a fundamental component of scientific inquiry, guiding the research design and providing a clear framework for testing assumptions. By understanding how to construct and evaluate an operational hypothesis, we can ensure our research is both rigorous and meaningful. Examples of Operational Hypothesis:
To decide on which variables to use, review previous studies to identify the most relevant or underused variables. This will highlight any gaps in the existing literature that your research study can fill. Example: Hypothesis Based on your literature review, you choose to measure the variables quality of sleep and night-time social media use.
This property is absolutely critical in scientific research. ... AN OPERATIONAL HYPOTHESIS links at least two operational variables. Again, some type of cause and effect is usually present in the hypothesis. EXAMPLE: Children with an encyclopedia in their home will achieve higher scores on the Stanford-Binet intelligence Test.
5. Phrase your hypothesis in three ways. To identify the variables, you can write a simple prediction in if…then form. The first part of the sentence states the independent variable and the second part states the dependent variable. If a first-year student starts attending more lectures, then their exam scores will improve.
In any body of research, the subject of study requires to be described and understood. For example, if we wish to study predictors of response to antidepressant drugs (ADs) in patients with major depressive disorder (MDD), we might select patient age, sex, age at onset of MDD, number of previous episodes of depression, duration of current depressive episode, presence of psychotic symptoms ...
3. Simple hypothesis. A simple hypothesis is a statement made to reflect the relation between exactly two variables. One independent and one dependent. Consider the example, "Smoking is a prominent cause of lung cancer." The dependent variable, lung cancer, is dependent on the independent variable, smoking. 4.
Operational hypothesis. Narrowed version of an overarching hypothesis, accounting for a specific study design. Operational hypotheses explicate which method (e.g., which study system or research approach) is used to study the overarching hypothesis. ... and revealing gaps in research. The examples on the hare-lynx cycles and the escalation ...
A hypothesis (from the Greek, foundation) is a logical construct, interposed between a problem and its solution, which represents a proposed answer to a research question. It gives direction to the investigator's thinking about the problem and, therefore, facilitates a solution. Unlike facts and assumptions (presumed true and, therefore, not ...
Nonetheless, when the use of operational definitions tified, a guiding sense of how they are best formulated and. offer significant benefits in terms of rationale and rigor. Thus, it is believe, to formulate a best-practices approach to operationalization, the practice is presented in research methods texts.
"A hypothesis is a conjectural statement of the relation between two or more variables". (Kerlinger, 1956) "Hypothesis is a formal statement that presents the expected relationship between an independent and dependent variable."(Creswell, 1994) "A research question is essentially a hypothesis asked in the form of a question."
Operationalization involves spelling out precisely how a concept will be measured. Operational definitions must include the variable, the measure, and how you plan to interpret the measure. There are four different levels of measurement: nominal, ordinal, interval, and ratio (in increasing order of specificity).
Here are some good research hypothesis examples: "The use of a specific type of therapy will lead to a reduction in symptoms of depression in individuals with a history of major depressive disorder.". "Providing educational interventions on healthy eating habits will result in weight loss in overweight individuals.".
It is necessary to operationalize the terms used in scientific research (that means particularly the central terms of a hypothesis). In order to guarantee the viability of a research method you have to define first which data will be collected by means of which methods. Research operations have to be specified to comprehend a subject matter in ...
Examples. A research hypothesis, in its plural form "hypotheses," is a specific, testable prediction about the anticipated results of a study, established at its outset. It is a key component of the scientific method. Hypotheses connect theory to data and guide the research process towards expanding scientific understanding.
Example 2.2 (Operational and conceptual definitions) Players and fans have become more aware of concussions and head injuries in sport. A Conference on concussion in sport developed this conceptual definition (McCrory et al. 2013):. Concussion is a brain injury and is defined as a complex pathophysiological process affecting the brain, induced by biomechanical forces.
Here, public policy, public administration, and nonprofit management courses are values of the implied variable, types of courses. 1.5: Conceptualizing and operationalizing (and sometimes hypothesizing) is shared under a not declared license and was authored, remixed, and/or curated by LibreTexts.
Generally, operational definitions are concrete and measurable. Defining variables in this way allows other people to see if the research has validity. Validity here refers to if the researchers are actually measuring what they intended to measure. Definition: An operational definition is the statement of procedures the researcher is going to ...
A hypothesis is a tentative statement about the relationship between two or more variables. It is a specific, testable prediction about what you expect to happen in a study. It is a preliminary answer to your question that helps guide the research process. Consider a study designed to examine the relationship between sleep deprivation and test ...
An operational hypothesis in a research experiment clearly defines what the variables of interest are and how the different variables are related to each other. The operational hypothesis should also define the relationship that is being measured and state how the measurement is occurring. ... A general hypothesis for an example experiment ...
Research hypothesis. The primary research question should be driven by the hypothesis rather than the data. 1, 2 That is, the research question and hypothesis should be developed before the start of the study. This sounds intuitive; however, if we take, for example, a database of information, it is potentially possible to perform multiple ...
A research hypothesis can be defined as a specific, testable prediction about the anticipated results of a study. 2 Hypotheses help guide the research process and supplement the aim of the study. After several rounds of testing, hypotheses can help develop scientific theories. 3 Hypotheses are often written as if-then statements.
Null hypothesis : there is no difference between anxiety scores for smokers undergoing smoking cessation and non-cessation smokers. 7 This example can be expanded so as to offer more opportunities to engage with the critical exercise. There is no difficulty in taking [Fernandez & Catteeuw 2001] operational hypothesis as a 'general hypothesis'.
A research hypothesis is your proposed answer to your research question. The research hypothesis usually includes an explanation ("x affects y because …"). A statistical hypothesis, on the other hand, is a mathematical statement about a population parameter. Statistical hypotheses always come in pairs: the null and alternative hypotheses.