For enquiries call:
+1-469-442-0620

- Business intelligence and Visualization

Why Text Is Added to Data Visualization Presentation
Home Blog Business intelligence and Visualization Why Text Is Added to Data Visualization Presentation

Data visualization of data through graphs like charts, infographics, plots, animations, etc. The process helps translate information into a visual context to make it easier for the human brain to understand. Data visualization aims to help you identify patterns, trends, and data sets. It is one of the most significant steps of the data science projects after the data gets collected, processed, and modeled for multiple purposes.
Data visualization works on visual information display that helps communicate complex data relationships and insights for the human mind to understand them. Organizations leverage data visualization to convey organizational hierarchy and structure. Moreover, data scientists and analysts use the process to identify and explain patterns and trends. You can understand it by undertaking a Business Intelligence and Visualization for Beginners course at KnowledgeHut.
Data visualization presentations are common in organizational processes, and include texts in the form of labels, captions, and annotations. Now, the question is – why is text added to a data visualization presentation ?
We will discuss why text holds utmost significance in the presentations and explain data visualization uses in detail below.
In the sections that follow, we'll go through why language is so important in presentations and how data visualization is used.
Why Is Text Added to Data Visualization Presentation?
Text in data visualization helps the audience understand data and gain valuable insights. Moreover, you can provide additional information on the raw data shown in the presentation. It can also help highlight the significant features or points of data that require attention.
Text helps explain data, write equations, integrate captions, and label significant bits of information. If you are skeptical about text and its role in a data visualization presentation, the following points will help you understand the context.
1. Introduction
You require text to help set the readers on a clear understanding path related to your data visualization presentation. The introduction will give the readers a preview of what the graphical representation aims to show in the presentation charts. Not everyone has a technical background, and a person with zero knowledge of technology will find it tough to understand a presentation in the first go. So, adding an introductory text will help the person understand the crux of the information before giving it a read.
2. Explanation
You can also use text data visualization to clarify things with a message at places where they get highlighted through graphic representations. You can also add information that may be too specific for inclusion in the introductory part of the presentation. Visual representations require explanations, and the best way to detail their significance is by adding text to data visualization presentations.
3. Labeling
For readers to understand information in your presentation better, you might label it with a variety of terms and numbers. The best ways to provide crucial information are through labels because they aid readers in understanding representations. So, it explains why text analytics visualization is vital in presentations.
4. Reinforcement
A few bits of information are significant to data visualization presentations that make you repeat them multiple times. So, how do you repeat the information bits without using the same graphical elements? The answer to this is text addition that will also help increase the likelihood of the graphic getting understood by the readers.
5. Highlight
You must highlight vital data to make the readers understand its role in the presentation. You can use text to highlight the required information and call the readers’ attention to them. Moreover, text highlights make the presentation charts look attractive and readable for everyone.
6. Sequence
How do you show the readers a way to examine your visualization content? The process is tricky, and the best way to make it successful is by visualization of text data . Text can instruct the reader section to navigate the presentation graphics.
7. Recommendation
Recommendations are best explained through texts and help inform the readers about the future score of the presentations and the organizational processes with them.
You can recommend what should be done or avoided via text on the data visualization presentation.
Role of Text in Data Visualization
Now that we know why text is added to data visualization presentations , let us look at its role in graphical representations.
The ideal method for displaying data visually using graphs, charts, or word clouds is to visualize text data . Additionally, it summaries the material, identifies patterns and trends among documents, and offers insight into the most pertinent terms.
Here is a breakdown of the roles text plays in data visualization.
1. It Helps Summarize Contexts
Texts allow you to highlight key terms and categorize them by topic, sentiments, etc. and save hours of reading time. You cannot read multiple online contents in a short time. But you can seek help from the word cloud feature on the data visualization dashboard and understand the text data in a few minutes. So, text added to a data visualization presentation is the best way to summarize contexts.
2. It Makes the Data Easy to Understand
Visual data holds the utmost significance in data presentations because humans can process images faster than text. However, you may find it tough to understand complex datasets. So, text visualization helps simplify data and communicate ideas and concepts to the readers. It is the best way to offer information in the shortest possible manner.
3. It Helps Find Insights into Qualitative Data
Text visualization enables you to get an overview of products, features, and topics that hold significance for your clients, customers, or stakeholders. It helps you learn the pain points and the areas of improvement to understand what you are doing right and where you have gone wrong in a specific project.
4. It Discovers Hidden Patterns and Trends
The text helps you identify, analyze, and visualize insights in presentations to detect fluctuations and errors and find the root cause to eliminate them. So, text analytics data visualization is the best way to track all hidden trends and patterns in data sets and other raw information.
How To Add Text Effectively in A Data Visualization Presentation?
You might be aware of the purpose of the text in a data visualization presentation . However, if you want the audience to comprehend your presentation right away, you must also be able to integrate multiple texts into it successfully.

Here is a breakdown of steps to follow to add text to a data visualization presentation effectively.
1. Summarize Steps with The Chart's Caption
Chart Captions are the best way to introduce the content because they help summarize the key ideas in a presentation. Avoid unnecessary adjectives and articles, and write short and crisp chart captions to grab the readers’ attention.
2. Reduce Lengthy Data Labels
You can use data labels to describe values related to charts in a presentation. Try to avoid rotated, lengthy, or broken data labels and use the slanted ones to enhance the readability feature.
3. Place The Data Legends in the Correct Spots
You must also ensure that the legend order syncs with the data plot of your presentation. Legends are the best resort to understanding data charts and must get placed in the presentation without cluttering spaces. So, you must arrange them according to the data plots.
4. Use Tooltip for Additional Information
You can use a tooltip if you want to add more information to a specific data plot. Tooltips help reveal additional information by appearing above specific data plots and keep the presentation chart clutter-free.
Pros And Cons of Text in A Data Visualization Presentation
Text is one of the most significant elements in data visualization presentation. However, the process has some pros and cons, as discussed below.
1. The text in data visualization makes the presentation understandable for the readers.
2. It helps provide information on the given data.
3. It helps to highlight significant points in the presentation.
1. Overdone texts can make the presentation look messy and cluttered.
2. Excess use of texts may sound overwhelming to the readers.
3. If you solely use texts, you might not be able to communicate your ideas.
Unlock new career opportunities with our ecba training course . Gain the essential skills and knowledge to excel in the business analysis field. Enroll today!
Text is a significant part of data visualization presentation because it provides valuable insights into the information for the readers. You can undertake Knowledge H ut’s Business Intelligence and Visualization for Beginners ’ course to understand more about the process. Text and data visualization go hand in hand that help explain organizational structure and processes in the best possible manner. So, learn how to utilize text analytics data visualization and make your presentation stand out among the crowd.
Frequently Asked Questions (FAQs)
Text in data visualization makes it easy for readers to understand the presentation. Moreover, you can also use text to provide additional information related to charts, graphs, and other topics.
Data visualization gives a clear understanding of what the information means. The process gives a visual context to the presentation content that makes it easier for the readers to understand it and summarize their findings.
Data visualization helps to visually represent data in the form of visual elements like graphs, charts, map data, etc. It is used to provide better insights to the readers about significant content.

Mansoor Mohammed
Mansoor Mohammed is a dynamic and energetic Enterprise Agile Coach, P3M & PMO Consultant, Trainer, Mentor, and Practitioner with over 20 years of experience in Strategy Execution and Business Agility. With a background in Avionics, Financial Services, Banking, Telecommunications, Retail, and Digital, Mansoor has led global infrastructure and software development teams, launched innovative products, and enabled Organizational Change Management. As a results-driven leader, he excels in collaborating, adapting, and driving partnerships with stakeholders at all levels. With expertise in Change Management, Transformation, Lean, Agile, and Organizational Design, Mansoor is passionate about aligning strategic goals and delivering creative solutions for successful business outcomes. Connect with him to explore change, Agile Governance, implementation delivery, and the future of work.
Avail your free 1:1 mentorship session.
Something went wrong
Upcoming BI & Visualization Batches & Dates
- Presentation
Why is text added to a data visualization presentation?

- February 11, 2023

Data visualization, with its colorful charts, intricate graphs, and captivating infographics, has transformed the way we understand and interpret data. Its utility is manifold — ranging from business intelligence to scientific analysis. However, amid the vibrant visuals and striking imagery, there’s a subtle yet essential element that often goes unnoticed but plays a pivotal role – text.
In this article, we will delve into the significance of why is text added to a data visualization presentation and how it enhances the understanding, impact, and storytelling capabilities of data in Presentation design services . Data visualization presentations are common in organizational processes and contain text in the form of captions, labels, and annotations.
Table of Contents
What’s data visualization?
Data visualization refers to the art of translating data into visual contexts, such as maps or graphs, in order to make it easier for the brain to comprehend and extract insights. Data visualization’s main purpose is to help you identify patterns, trends, and outliers within large data sets. This term is frequently used interchangeably with other terms, such as information graphics, statistical graphics and information visualization.
Data visualization is a step in the data science process. It involves the collection, processing, and modeling of data. The data must then be visualized to allow for the making of conclusions. Data visualization is an integral part of the larger data presentation architecture discipline (DPA). This discipline aims to locate, manipulate, format, and deliver data in the most efficient manner possible.
Data visualization is essential for nearly every profession. It can be used to present student test results by teachers, computer scientists to explore advances in artificial intelligence (AI), and executives to share information with stakeholders. It is also important in big data projects. Businesses accumulated large amounts of data in the early years of big data. They needed a quick and easy way to view their data. Visualization tools are a natural fit.
Text add to a data visualization presentation
Text in data visualization can help the audience understand data better and gain valuable insights. You can also provide additional information about the data in the presentation. This can help you highlight important features and points of data that need attention.
Text is used to explain data, create equations, insert captions and label important bits of information. The following points can help you to understand text’s role in data visualization presentations if you are skeptical.
Introduction
Text is required to provide a clear understanding of your data visualization presentation to the reader. The introduction will provide a preview of the presentation’s graphical representation. A presentation can be difficult to comprehend for someone who has no technical knowledge. A brief introduction text can help people understand the essence of the information before they start to read it.
Explanation
Text data visualization can be used to clarify information. Information that is too detailed to be included in the introduction can also be added.
You might use a variety of numbers and terms to label your information so that they are easier to understand. Labels are the best way to communicate important information because they help readers understand representations.
Reinforcement
Data visualization presentations require that you only repeat a few pieces of information.
To make sure that the reader understands the role of the data in your presentation, you must highlight it. Text highlights the information you need and draws attention to it. Text highlights make presentation charts more attractive and readable for all.
How can you make it easy for readers to view your visualization content? This is a complex process, so visualization of text data is the best option. The text can be used to guide the reader through the presentation graphics.
Recommendation
Texts are the best way to explain recommendations. They inform readers about the future score and organizational processes associated with the presentations. Text can be used to suggest what should or shouldn’t be done for the data visualization presentation.
Why is data visualization important?
Data visualization is a fast and efficient way to communicate information using visual information. Data visualization has the following benefits:
- The ability to quickly absorb information, make better decisions and improve your understanding.
- a better understanding of the next steps to improve the organization
- An improved ability to keep the audience’s attention with information they understand.
- Easy distribution of information increases the chance to share insights with all parties;
- Data scientists are no longer needed as data is easier to access and more easily understood.
- An increased ability to quickly act on information and achieve success faster.
The Visual Advantage
Before we delve into the world of text, let’s acknowledge the primary strength of data visualization: and this has always been the power of text: its ability to communicate dense information quickly and effectively. Data visualizations (bar chart, line graph, heat maps) help us understand trends, outliers and patterns quickly with our eye. Especially when working with data at scale where data needs to be abstracted in order to be workable.
The Limitations of Visuals
While data visualizations excel at simplifying data, they also have their limitations. Here are some key reasons why text is essential in data visualization presentations:
Providing Context
Data visualizations, no matter how visually appealing, are often meaningless without context. They can be compared to pieces of a puzzle without the picture on the box – you may see the individual elements, but you won’t understand the full picture. Text provides the context necessary to make sense of the data. It explains what the data represents, the time frame it covers, and the variables involved.
Highlighting Key Insights
Within a complex data visualization, there are often critical data points or trends that require special attention. Text can be used to highlight and explain these key insights. Whether it’s an unexpected spike in sales, a significant drop in website traffic, or a noteworthy shift in market trends, text can draw the audience’s focus to what truly matters.
Explaining Methodology
In some cases, data visualization presentations involve complex statistical or analytical methods. While the visuals can show the results, they rarely explain how those results were obtained. Use text to explain the analytic techniques, statistics employed and data sources for the analysis. Especially for presentations where there might be less technically adept folks in the room.
Telling a Story
Data visualization presentations are not just about presenting numbers; they are about telling a story with data. Text serves as the narrator of this story. It introduces the problem or question being addressed, describes the data collection process, and provides insights or recommendations based on the findings. This narrative structure makes the data more relatable and memorable.
Adding Detail and Precision
Visualizations are excellent for conveying general trends, but they may lack the precision required for certain applications. Text can add specific details, such as exact figures, percentages, or statistical significance. These details can be critical in decision-making processes or scientific research.
Addressing Uncertainty
Not all data is certain, and it’s essential to communicate the degree of uncertainty associated with the presented information. Text can be used to acknowledge potential limitations, margin of error, or data sources’ reliability. This transparency builds trust with the audience and prevents misinterpretation of the data.
Role for Text in Data Visualization
We now know why text is used in data visualization presentations. Let’s look at its role within graphical representations.
Visualizing text data is the best way to visually display data using charts, graphs, or word clouds. It summarizes the material, identifies trends and patterns among documents, and provides insight into the most relevant terms.
Below is a breakdown of the role text plays in data visualization.
It Summarizes Contexts
Texts let you highlight key terms and group them by topic, sentiments, or other criteria. You can save hours of reading time.
Makes Data Simple to Understand
Because humans are able to process images more quickly than text, visual data is of paramount importance in data presentations. Complex datasets can be difficult to comprehend.
Provides Insights into Qualitative Information
Text visualization allows you to see a summary of the features and products that are important for your customers, clients, or other stakeholders. This helps you identify the strengths and areas for improvement and allows you to see where you are succeeding and where you need to improve.
Finds Hidden Patterns and Trends
You can use the text to identify, analyze and visualize insights in presentations. This will help you to spot fluctuations and errors, and determine their root causes. Text analytics data visualization is the best method to find hidden patterns and trends in data sets.
Pros And Cons Of Adding Text To A Data Visualization Presentation
There are pros and cons to including text in a data visualization presentation. These are the main factors to consider:
- This presentation will be easier to understand for the audience.
- You can get more information about the data being displayed.
- It can be used to highlight key points or features in the data.
- Overdoing it can lead to a messy presentation.
- Too much text can overwhelm the audience.
- Textual overload can make it difficult to convey your ideas as clearly.
To avoid adding too much text to your data visualization presentation, consider the pros and cons of each option. You should add text to your data visualization presentation in a clear and concise manner.
How to Balance Text and Visuals?
And so, as text plays such an important role in data visualizations, how do they go about achieving the just-right balance of text with images? Here are some best practices to keep in mind:
Clarity and Conciseness
The text should make things clearer — not more mysterious. Text should be brief and direct. Express yourself in simple & understandable language so that people get the gist of what are you trying to convey!
Visual Hierarchy
Use text to establish a visual hierarchy within your presentation. Headings, subheadings, and labels should guide the viewer’s eye to the most critical information. This hierarchy ensures that viewers focus on what matters most.
Alignment with Visuals
Text should complement the visuals, not compete with them. Ensure that the text supports and enhances the message conveyed by the visuals. Avoid redundancy between text and visuals, as this can lead to confusion.
Interactivity
In digital presentations — add interactivity so when someone hovers over or clicks on certain parts of the visualization they get more detail beneath it in text etc. It keeps the audience involved (and lets them browse the information at their own convenience).
Accessibility
Make your data visualization presentations accessible to all by providing alternative text (alt text) for images and visual elements. This ensures that individuals with visual impairments can also benefit from the information.
Testing and Feedback
Before finalizing your data visualization presentation, seek feedback from colleagues or target audience members. They can help identify areas where text is insufficient or overwhelming.
In the world of data visualization, text is not a mere afterthought but a fundamental component that enhances the understanding, impact, and narrative power of data presentations. It provides context, highlights key insights, explains methodology, tells a compelling story, adds precision, and addresses uncertainty.
While data visualization captivates the eye, it is the marriage of visuals and text that truly unlocks the potential of data to inform, persuade, and inspire action. Therefore, when creating your next data visualization presentation, remember that the right words can turn a collection of data points into a meaningful and persuasive story.
What does it mean to visualize a text?
Text visualization is the technique of using graphs, charts, or word clouds to showcase written data in a visual manner. This provides quick insight into the most relevant keywords in a text, summarizes content, and reveals trends and patterns across documents.
How did text and annotations help in good visualization?
Good annotations are especially important if your analysis is shared across teams as it makes it much easier to read without prior knowledge of the visualized data set. Sufficient explanation helps to avoid questions such as “What does this color mean”, which makes work easier for everyone.

- Graphic Design , UI-UX
How to Become a Motion Graphic Designer?

A Brief Overview of Lean UX

UX Strategy and Its Components
you'r more than welcome
7 days a week, 9:30 AM – 5:30 PM
contact info
[email protected] +351910923549
- LB07129, Jebel Ali Freezone, Dubai, UAE
Got a Project?
We’re a team of creatives who are excited about unique ideas and help companies to create amazing identity by offering wide range of digital services
© 2021 All rights reserved.
Be the first one who knows about updates!
enter your email address 📩
Welcome to the club 🎉.
From now on, Temis will inform you of its most valuable content and offers. You can also subscribe to this list at the moment. We will also protect your privacy
Datawrapper lets you show your data as beautiful charts, maps or tables with a few clicks. Find out more about all the available visualization types.
20 chart types to show your data
Symbol, choropleth, and locator maps
Including heatmaps, searching, and more
Feature highlights
Our mission is to help everyone communicate with data - from newsrooms to global enterprises, non-profits or public service.
Media leaders turn to Datawrapper to tell data-driven stories
Replace static reports with interactive visualizations using Datawrapper
Modern public service uses Datawrapper to help inform citizens
Case Studies
Learn how others use Datawrapper through in-depth case studies
We want to enable everyone to create beautiful charts, maps, and tables. New to data visualization? Or do you have specific questions about us? You'll find all the answers here.
Data vis best practices, news, and examples
100+ articles that explain how to use Datawrapper
Answers to common questions
An exchange place for Datawrapper visualizations
Attend and watch how to use Datawrapper best
Learn about available positions on our team
Our latest small and big improvements
API Documentation
Build your integration with Datawrapper's API
Get support
Get in touch with us – we're happy to help
Latest Improvements
Terms of service.
This article is brought to you by Datawrapper , a data visualization tool for creating charts , maps , and tables . Learn more .
What to consider when using text in data visualizations

Text is maybe the most underrated element in any data visualization. There’s a lot of text in any chart or map — titles, descriptions, notes, sources, bylines, logos, annotations, labels, color keys, tooltips, axis labels — but often, it’s an afterthought in the design process. This article explains how to use text to make your visualizations easier to read and nicer to look at. Show information where readers need it 01 Label directly 02 Repeat the units your data is measured in 03 Remind people what they’re looking at in tooltips 04 Move the axis ticks where they’re needed 05 Emphasize and explain with annotations Design for readability 06 Use a font that’s easy to read 07 Lead the eye with font sizes, styles, and colors 08 Limit the number of font sizes in your visualization 09 Don’t center-align your text 10 Don’t make your readers turn their heads 11 Use a text outline Phrase for readability 12 Use straightforward phrasings 13 Be conversational first and precise later 14 Choose a suitable number format
Let’s start:
Show information where readers need it
Label directly.

Show information where readers need it. Place the words that explain your chart elements as close to those elements as possible.
Why? Imagine if every object in a museum were labeled only right next to the door. You would need to walk back and forth between the label and the exhibit over and over. And by the time you walked back to the exhibit, you would probably have forgotten most of the explanation.
The readers of your data visualization won’t need to move their feet, but they’ll need to move their eyes back and forth between your description and your axis labels, or between your color key and your lines. Don’t make your readers eye-travel that much. Always try to make it as convenient as possible for your readers to understand your visualization.
One big part of doing so is to remove the color key and directly label your categories. In Datawrapper, that happens by default for line charts, pie charts, and donut charts on desktop devices. On mobile devices, the space is tighter, so the color key will be shown at the top. You can also use annotations to add direct labels by hand.
Repeat the units your data is measured in

The goal of placing explanations as close to the data elements as possible also applies in smaller details. Make it obvious which units your data uses. Don’t just put units in the description, but also in axis labels, tooltips, and annotations.
Also, there’s no need to use multipliers (“in millions,” “in thousands”) in the description. While this is better than placing a long 20,000,000 next to the axis, it’s not necessary to let readers do the math. Instead, consider using number formats like 20b, 20m, or 20k . I’ll talk about them more below.
Remind people what they’re looking at in tooltips

Not just axis labels should repeat what your visualization shows — tooltips should, too.
Tooltips that show up when readers hover over an element are great to inform them about the exact underlying value(s) of each data point in your visualization. But consider not just stating the numbers in tooltips, but also the category (like “3.4% unemployed” instead of “3.4%,” or “+16% revenue” instead of “+16%”). This way, you can teach and remind people of what your chart or map actually shows. To learn how to edit tooltips in Datawrapper, visit this article .
Move the axis ticks where they’re needed

Another small trick for showing the information where it’s needed is to move your axis labels to the other side of the chart (from the left to the right or even from the bottom to the top). If those regions of the chart are filled with more or more important data elements, this makes it easier to roughly calculate their height or width.
For example, in the right-hand chart above, it’s a bit quicker to see that the last orange bar is a bit over 40 units tall.
Emphasize and explain with annotations

Ok, enough with the small tricks. Here’s a big one: Use annotations. Annotations are an extremely powerful tool in your visualizations. If you’re creating an explanatory chart or map, it will likely be better with annotations in it.
- Is there any design element in your visualization that needs explaining , like a highlight range or a connecting line you drew? Annotate it.
- Is there a data point or series that you want readers to see , like an outlier? Annotate it. For example, “Texas has the lowest income…”
- Is there anything that readers should know to better understand why certain data points look the way they do ? Annotate it. For example, “The latest recession happened here, that’s why the values are so high…”
Thanks to these pointers and explanations, readers will get more out of your chart. But I’ve also found that annotations make charts and maps more visually appealing. As a reader, I get intrigued by little notes that promise something interesting. Your readers might too.
Design for readability
Use a font that’s easy to read.

Use font families, font styles, font sizes, and text colors that make it as easy as possible to read your most important text. To figure out what’s easiest to read, ask yourself: What are readers used to? On the web (e.g., in this very article), that’s sans-serif, regular, sentence case, neither overly narrow nor wide, >12px, (almost) black text. This is the text that people feel most comfortable reading.
You can learn more about how to achieve this in our article “ Which fonts to use for your charts and tables .”
Sometimes you might feel the need to use very narrow text or to reduce the size of (some of) your text because otherwise it “won’t fit” — but there is almost always another solution. For example, you can just not show the small text and use tooltips instead:

This New York Times graphic does exactly that. Compare it with this bubble chart . Which one looks more appealing to read?
Other tricks are to increase the size of your whole visualization when possible or to shorten sentences (see below). On mobile screens you can also hide the least important annotations, or move them below the visualization. Both are possible in Datawrapper .
Lead the eye with font sizes, styles, and colors

Design is all about deciding what readers should see first, second, third, and last. The biggest and boldest text with the highest contrast against the background should be reserved for the most important information. That text will be read first. Often, that’s the title of your visualization. Small, thin, and gray text should be reserved for less important information, like the description or source.
It can help to first make all the text in your visualization small, thin, and gray. Then ask yourself: “What is really important? What text should readers not miss under any circumstances?” Emphasize this text with bigger text sizes, wider strokes ( bold instead of regular or thin ), and/or higher-contrast colors, and keep the rest de-emphasized.
Limit the number of font sizes in your visualization

While leading the reader’s eye with font sizes, widths, and colors might feel like a new superpower, don’t overdo it. Lots of different font sizes in particular can quickly look messy. For annotations and labels, try to use only two levels of hierarchy that are clearly different from each other — like a 12px gray and a 14px black. Then emphasize within the annotations using boldness.
Don’t center-align your text

Left- or right-aligned text looks tidier than center-aligned text. That’s because all lines start (or end) at the same x-position. This allows the text box to have a clear edge that can run parallel to other chart elements.
In the center-aligned version above, there are little messy gaps left of the words “Fewer” and “park.” In the left-aligned version, the title aligns neatly with the chart.

Both center- and right-aligned annotations are also harder to read, so don’t use them for lengthy text (everything above roughly 10 words). Readers will need a split second longer to find the beginning of the next line than when reading left-aligned text.
Don’t make your readers turn their heads

Instead of rotating axis labels, find another place inside your chart for them. In Datawrapper charts, axis labels are never rotated except in column charts with many columns and long category names.
Often, axis labels can be concisely rephrased — your data set might use more official-sounding labels than needed. Don’t use too-crazy insider acronyms, though. Make sure your chart is still readable for its entire target audience.

If your labels are still too long, consider using another chart type (like a bar chart instead of a column chart).
Use a text outline

If your text sits on other elements — even just a subtle gridline — consider using a text outline. That’s a stroke around your letters, most often in the background color of your chart. Your text will be easier to read and nicer to look at. In Datawrapper, you can set outlines for text annotations, map labels, and locator map markers.
Phrase for readability
Use straightforward phrasings.

Every time you phrase something, be it a title, description, or annotation, ask yourself: What’s the easiest way to say this? Don’t just copy and paste the official description of the data set you’re visualizing. You can probably do better.
A trick to get to a good description is to imagine describing your visualization to a friend. You probably wouldn’t say “It shows a variable that denotes the central estimate of the average extent to which citizens of selected countries support a democratic political system.” Instead, you’d explain: “The darker a country is on this map, the more its citizens support democratic political systems.” ( You can see the map here .)
Maybe you’d continue: “Look, that’s interesting: U.S. citizens support democratic systems less than Chinese citizens do.” If that’s what you want your friend (and your whole audience) to see, consider using it for your title or at least for an annotation.
Good phrasing takes time, but it’s time well spent. Take the 20 minutes to come up with easier-to-understand wording and you’ll help hundreds of people be less confused.
Be conversational first and precise later

For the text that people will read first, use colloquial wording . “Is higher than ever” can be a stronger choice in a title than “peaks.” “More x than y” might be better than “x surpassed y.” And if you’re visualizing for a mainstream audience, don’t use words like “median” or “standard deviation” in your title.
You can still state precisely what you’re showing — just move that precision to a less prominent text element, like the description or notes. The example above is taken from the 2022 Washington Post story “Rents are rising everywhere.” Instead of explaining all the details upfront, it places the information “Change in rent from Q1 2020 to Q1 2022” in the description. And only in small, gray text below the map do readers find out that “Price estimates are for multi-family rentals in counties with at least 1,000 units.”
Why does the Washington Post do that? Because precise wording can distract from the actual message. In their story, the main statement is that “rent prices are up.” More people will be able to remember that statement than that “price estimates for multi-family rentals in counties with at least 1,000 units increased between Q1 2020 and Q1 2022.” So be like the Washington Post: Give the main statement first and the precise data explanation later.
Choose a suitable number format

What’s true for your title and description is also true for numbers: Don’t add unnecessary precision when showing numbers. Very few readers will remember a number with lots of decimal places (22.42%) or thousands places (12,831) anyway. Quite the opposite: They might make your visualization overly complicated at first sight and hence unattractive to get into.
Besides formats that abbreviate your high numbers from 12,831 to 12.8k (or 12,831,283 to 12.8m), Datawrapper also offers number formats that remove a trailing zero. If you choose the format 0.[0]% in Datawrapper, it will turn 27.0 into a nicely readable 27%, while keeping the decimal place of 22.4%. You can learn more in our article “Number formats you can display in Datawrapper.”
If you think that readers might be interested in more specific numbers, you can still place them in tooltips , let readers download the data with a link, or mention the exact values in the surrounding article or annotations.
Examples of good use of text in data visualizations
New York Times, 2018: The Myth of the Criminal Immigrant . Simple phrasing (“More/Less crime”) gets prioritized over exact phrasing (“+500 violent crimes per 100,000 people”) using bigger, bolder, higher-contrast text:

New York Times, 2022: U.S. Job Growth Unexpectedly Soared in July . Good example of direct labeling (“Jan. ’22,” “Sept.”) and repeating what people see (“152.5 million jobs in February 2020” instead of “152.5 million,” and “+32,000 jobs since Feb. 2020” instead of “+32,000”):

New York Times, 2015: Arctic Ice Reaches a Low Winter Maximum . Note the use of annotations to add extra information (“Size of Canada,” “Arctic ice cover usually reaches…”), explain chart elements (“The dotted line represents…”), and point to outliers (“Feb. 25: 2015 maximum”):

Want to know more?
- Remove the legend to become one by Eugene Wei. Long, autobiographical read that talks about direct labeling after the first image.
- Which fonts to use for your charts and tables on our Datawrapper blog.
- Three Ways to Annotate Your Graphs by Jon Schwabish. Shows how to annotate a chart with labels, headlines, and added details.
- Respect your readers’ time on our Datawrapper blog. Explains in detail what makes the 2015 NYT graphic above so great — e.g., how it points readers to what they’re supposed to see.
- What Questions to Ask When Creating Charts on our Datawrapper blog. Talks about why and how to write the text elements of data visualizations (titles, descriptions, annotations, sources).
Related Articles

What to consider when creating small multiple line charts

Remind readers of the colors in your data visualization

How to design a useful (and fun!) color key for your data visualization
All blog topics.
Why Text Plays a Crucial Role in Data Visualization
Create beautiful charts & infographics get started, 18.01.2017 by anete ezera.
When used properly graphs, tables, and text form an unstoppable team. Each brings something special to the table . In this post, we will focus on text and how it can become a powerful communication tool when combined with tables and graphs.
Data visualization expert Edward Tufte explains the importance of words in his book, The Visual Display of Quantitative Information, Second Edition . He writes, “Words and pictures belong together. Viewers need the help that words can provide.”
Tufte understands that text can be useful when explaining the data, labeling outliers or interesting bits of information, writing equations, and integrating captions and legends into the design so viewers don’t have to work extra hard to understand the graphic.
Types of Text
There are multiple types of text you can use to give your infographic or chart context that enhances readability and comprehension:
- Data labels
- Facts & Figures
Each of these types of text play a crucial role when designing an effective visualization. Let’s go over the different ways text can be used to tell better data-driven stories.
Role of Text in Data Visualization
Data visualization author Stephen Few outlines the various ways text can complement or enhance tables and graphs in his book, Show Me the Numbers: Designing Tables and Graphs to Enlighten :
Label – Text (words and numbers) is often used to label information. Labels offer critical information to help readers interpret visualizations.
Introduce – Text is often required to set the reader on a clear path to understanding. An introduction should give readers a preview of what the graphic will show.
Explain – Text can be used to clarify something about the message, right where it is needed in the graphic. This is for information too specific to be included in the introduction.
Reinforce – Some information is so important you need to say it more than once. Text can help increase the likelihood your graphic will be fully understood.
Highlight – Text can be used to visually highlight important data. This is different from reinforcement because you aren’t repeating yourself, you’re simply calling the reader’s attention to it.
Sequence – Showing the order in which your reader should examine the contents of your visualizations can be tricky. Text can help instruct your readers to navigate your graphic in a specific way.
Recommend – Recommendations for action are best communicated in words. Sometimes you aren’t simply informing the reader – you may be recommending what could or should be done.
Inquire – The visual display of quantitative information frequently invites questions. Don’t be afraid to ask them. Sometimes one well-timed question is more useful than a series of answers.
Text in Action
The classic visualization below from Charles Joseph Minard is a great example of effective text use. Minard’s combination of data map and time-series, drawn in 1869, shows a sequence of losses suffered in Napoleon’s Russian campaign of 1812.
A total of six variables are plotted to form this brilliant visualization. Without the title, subtitle, body paragraph, data points, and legend – his comprehensive story would have been much harder to tell. Click here to view the graphic in more detail.

Side Note: Remember that too much of anything can distract from your visualization and ruin your intent. Less is more! If the text doesn’t add to your message, leave it out. You want to be concise and pointed when choosing text to include on your chart or infographic.
We hope you found this post useful. If you’d like more helpful tips visit our Tutorials and Resources section. Here you’ll find ‘how to’ articles, fun examples, and techniques.
Get data visualization tips every week:
New features, special offers, and exciting news about the world of data visualization.
Join more than 200,000 readers and receive the latest data visualization news, tips and trends every week.
the best data visualization tools, good and bad data visualization examples, the best data visualization examples of 2023.
Data visualization and storytelling
A beginner’s guide to using text in data visualization, discover the most effective techniques for using text to create clear and understandable data visualizations.
You come across a chart with no title, labels, or visual cues to guide you. How much can you really understand from it?
Chances are, not much – but that’s because text is undeniably one of the most vital components of data visualization .
While exploring the world of text in data visualization is quite an undertaking, we’ve put together some essential starting points to help you seamlessly integrate text into your charts. Whether it’s through headings or labels, these recommendations are designed to support you in effectively conveying your message.
1. The chart’s title is your elevator pitch
When it comes to data visualization, headers are the first point of reference for most readers. And similarly to an elevator pitch, a well-crafted chart title should quickly show the key takeaway of your data and why it matters – without delving into too much detail.
To create an effective title, take a moment to identify the chart’s primary insights and add that as a header. Concentrate on the trends and patterns in your data, but allow room for the reader to also draw their own conclusion. Any other information can go as notes in the footer.
More on writing compelling titles

- Visual hierarchy: The most important information should always be given the highest priority and should be presented in the boldest and biggest text. For anything else, use smaller typefaces or reduced contrast – but ensure that your design still follows best accessibility practices .
- Use of color: Using color in your headers is an effective way to declutter your visualizations and grab the viewer’s attention. The best part? You can easily do this in Flourish – check our help doc to learn how.
2. Choose direct labels over legends
We’ve said it before and we’ll say it again – there are several more effective alternatives to using a standard color legend. While a few color swatches may work just fine, things can get very confusing when dealing with numerous series in your dataset.
It gets even trickier if your palette consists of closely resembling colors (hint: this should be avoided). So, what can you do to make your chart easier to understand? Label points directly.

This makes it easier for our brains to understand the graph because we don’t have to keep looking back and forth between the legend and the data.
In Flourish, there are multiple ways to add direct labels. For line and area charts , you can opt for the Show labels on lines setting. Alternatively, consider our previous suggestion of adding legend colors to the header . This way, you provide a visual clue about your color coding without cluttering up the chart with extra elements.
Incorporate annotations
Annotations can be a real asset when you want to draw attention to particular data points or series, such as outliers.
Whether you prefer to include a detailed note alongside your visualization or just highlight crucial labels is entirely your choice. Our Scatter template even offers selective point labeling , allowing you to handpick which specific data points should showcase labels. Read more in our help doc .
3. Turn people’s heads, but for the right reasons
If your charts leave people in awe of your data skills, that’s wonderful! However, if readers have to physically turn their heads to read important text elements, that’s less than ideal.
As a rule of thumb, text in data visualization should be horizontal whenever possible, although the Y axis title is often an exception.
For any other text elements like axis ticks and highlights, try sticking to horizontal alignment. In Flourish, you can utilize the label angle setting , which lets you adjust the degree of label orientation to your preference.
If your axis represents time data, use the number formatting settings to shorten the axis format or choose to display less ticks in general.
However, if your categorical series are too long to wrap properly, consider switching to a different chart type. In Flourish, you can easily switch between column, bar, and other charts with just one click .
4. Remember to format your numbers
Especially when it comes to large figures, formatting the display of your numbers is incredibly useful. Is it really necessary to write 7 billion as 7,000,000,000 or even 7000000000? That’s a whole lot of zeros to deal with!
Last but not least, make sure to include relevant prefixes and suffixes . You can add them using the number formatting settings, or if necessary, even mention them in the subtitle of your chart. The key idea is to keep explanations close to the data, ensuring that the metric is always in sight.
To summarize…
- Use your title to reveal the most important information in your chart.
- Keep it clear and to the point – data visualization experts recommend titles between 6 to 12 words for optimal clarity.
- The most crucial information should be in the largest, boldest text . Color is also a helpful tool for creating visual contrast.
- Position labels as closely to the graph as possible, so eye movement between the legend and the data is minimized .
- Annotations are your best friends! They make your chart more digestible and interesting.
- Text should be horizontal when possible; switching chart types is a better alternative than rotating labels.
- Consider the readability of large figures and format numbers effectively.
[email protected]
Flourish is a registered trademark of
Canva UK Operations Ltd, UK company 08825531
33 Hoxton Square
London N1 6NN
Unlimited Access to PowerPoint Templates & more! Starting at only $49 Unlock Full Access

From Data to Insights: Data Visualization in PowerPoint

In the age of information, data is abundant. Whether you’re a business professional, a researcher, or a student, you often need to convey complex data in a clear and understandable manner. This is where the art of data visualization comes into play. Data visualization in PowerPoint can transform raw numbers into meaningful insights that resonate with your audience. In this blog post, we’ll explore the importance of data visualization and how to effectively use it in your PowerPoint presentations.
Why Data Visualization Matters
Data visualization is the practice of representing data through charts, graphs, and other visual elements. It’s an essential tool for turning data into insights for several reasons:
- Clarity : Visualizing data makes it easier to understand and interpret. A well-designed chart or graph can convey complex information more effectively than a table of numbers.
- Engagement : Visuals capture and hold your audience’s attention. They make your presentation more engaging and memorable.
- Storytelling : Data visualization helps you tell a story with your data. You can highlight trends, correlations, and outliers, providing a compelling narrative.
Choosing the Right Visualization
The first step in data visualization is selecting the right type of chart or graph for your data. PowerPoint provides various options, including:
- Bar charts : Great for comparing data across categories.
- Line charts : Ideal for showing trends over time.
- Pie charts : Useful for illustrating parts of a whole.
- Scatter plots : Good for showing relationships between two variables.
- Heat maps : Effective for displaying patterns and variations.
Choose the visualization method that best conveys your data’s message. Remember, not every data point needs a visualization; only use visuals for the most crucial information.
Design Principles for Effective Data Visualization
Creating impactful data visualizations in PowerPoint requires adherence to some design principles:
- Simplicity : Keep your visuals clean and uncluttered. Remove unnecessary elements that don’t contribute to the message.
- Consistency : Maintain a consistent color scheme and style throughout your presentation. This creates a cohesive look and reinforces your brand.
- Labeling : Always label your axes, data points, and any significant features. Clarity is essential to understanding the data.
- Color : Use color purposefully. Avoid using too many colors, as it can confuse the audience. Ensure your color choices are accessible for all viewers, including those with color vision deficiencies.
- Legibility : Ensure your text is readable, even when projected. Use a legible font size and style, and contrast your text with the background.
Telling a Data-Driven Story
Data visualization should be an integral part of your presentation’s narrative. Here’s how you can incorporate it effectively:
- Start with a Hook : Begin your presentation with an engaging data visualization that teases your main findings or insights.
- Contextualize : Provide context for your data. Explain what the numbers represent and why they matter.
- Use Data as Evidence : Use data to support your arguments and claims. Visuals make your case more compelling.
- Highlight Key Points : Emphasize the most critical data points using visual cues like color, size, or annotations.
- Summarize and Conclude : End your presentation with a summary visualization that highlights your main insights and conclusions.
Data visualization in PowerPoint is a powerful tool for turning raw data into actionable insights. By choosing the right visualization methods and following design principles, you can create engaging, informative, and persuasive presentations. Remember that the goal is not just to present data but to provide your audience with the tools they need to understand, interpret, and act on that data. So, from your next PowerPoint presentation onward, make data your ally in delivering impactful insights to your audience.

Get Unlimited Access to EVERYTHING

- 11 min read
What Is Data Visualization? Process, Tools, Best Practices

What is Data Visualization?
Why is data visualization important, how is data visualization used, how to visualize data, why is text added to a data visualization presentation, which type of visualization tool is helpful for location data, what are data visualization tools, types of data visualization tools, top 10 data visualization tools and software, 1. google sheets, 4. microsoft power bi, 5. qlikview, 6. sap lumira, 7. ibm cognos, 8. tibco spotfire, 9. oracle business intelligence, 10. microstrategy, data visualization best practices, data visualization tips and tricks, examples of effective data visualization, data visualization in google sheets.
Data visualization is a crucial aspect of data analysis and communication, allowing us to understand and present complex data sets in an easily digestible format. This guide provides a comprehensive overview of data visualization, including what it is, why it's important, how it's used, and how to create effective visualizations.
In this guide, we'll explore the basics of data visualization, including what it is, why it's essential, and how it's used. We'll also delve into the process of creating compelling visualizations and the tools available for doing so.
Data visualization is the process of converting complex data into visual representations that are easy to understand and interpret. There are several types of data visualization, including bar charts, line graphs, scatter plots, heat maps, and more.
The purpose of data visualization is to help people understand and make sense of large data sets by highlighting patterns, trends, and relationships. It can also be used to communicate data effectively, engage stakeholders, and make data-driven decisions.
Data visualization is important for several reasons, including:
- Understanding large data sets: Visualizing data can make understanding and analyzing large data sets easier.
- Identifying trends and patterns: Visualizing data can help identify trends and patterns that might not be immediately apparent in raw data.
- Improved communication of data: Data visualization can help communicate data effectively, engaging stakeholders and making data-driven decisions.
- Increased engagement and understanding: Data visualization can help increase engagement and performance by presenting data in an easy-to-understand format.
Data visualization is used in several industries and fields, including:
- Business Intelligence: Data visualization can help businesses make data-driven decisions by presenting data in an easy-to-understand format.
- Marketing and Sales: Data visualization can help marketers and sales teams understand customer behavior and preferences, leading to more effective marketing and sales strategies.
- Data Science and Analytics: Data visualization is an essential tool for data scientists and analysts, allowing them to analyze and present complex data sets.
- Research and Academic Settings: Data visualization is also used in research and academic settings, allowing researchers to present and analyze data effectively.
The process of data visualization can be broken down into several steps, including:
- Preparation and Planning: Before creating a visualization, it's essential to plan and prepare the data to ensure it's ready to be visualized.
- Choosing the Right Visualization: Choose the correct type of visualization that best represents the data you want to visualize.
- Creating the Visualization: Use a data visualization tool to create the visualization.
- Customizing the Visualization: Customize the visualization to best represent the data and tell the desired story.
- Interpreting the Visualization: Interpret the visualization and extract insights from the data.
- Communicating the Visualization: Share the visualization with stakeholders and communicate the insights extracted from the data.
Text is added to a data visualization presentation for several reasons, including:
- Adding context and clarity: Text can add context and clarity to a visualization, helping to explain the data being represented.
- Highlighting key points: Text can be used to highlight key points and insights in the data. Text can be used to label data points, making it easier to understand the data being represented.
When a data set contains location data, a map visualization can be very helpful. Map visualizations help visualize data distribution across geographical areas and highlight patterns and trends in the data.

Google Sheets offers plenty of Data Analysis features that we can use to make sense of large data sets. Here’s how to do Data Analysis in Google Sheets.
Data visualization tools are software programs that allow users to create visual representations of data. There are several types of data visualization tools.
Data visualization tools can be broadly classified into several categories based on their functionality, ease of use, and target audience. Understanding these categories can help you choose the right tool for your needs.
- Desktop Tools: These tools are designed for professional data analysts and require installation on a local computer. Examples include Tableau and Microsoft Power BI.
- Web-based Tools: These tools can be accessed from any device with an internet connection and do not require installation. Google Sheets and D3.js fall under this category.
- Enterprise Tools: These tools are designed for large organizations and come with advanced features such as data integration, collaboration, and security. Examples include SAP Lumira and IBM Cognos Analytics.
- Open-source Tools: These tools are free and open to the public, allowing users to customize and extend the software according to their needs. Examples include D3.js and ggplot.
- Specialized Tools: These tools are designed for specific use cases, such as geospatial data visualization, financial data visualization, and more. TIBCO Spotfire and QlikView are examples of specialized data visualization tools.
By understanding the different types of data visualization tools available, you can make an informed decision about the best tool for your needs.
Data visualization tools make it easier to represent complex data sets in an easy-to-understand manner. There is a multitude of tools available in the market, each offering different features and capabilities.
Let's look at the top 10 data visualization tools, highlighting their key features and advantages.
Google Sheets is a data visualization tool that is part of the Google suite of products. It provides a range of visualization options, including bar charts, line graphs, and maps, and it integrates seamlessly with other Google tools.
Google Sheets also offers a user-friendly interface that makes it easy to create visualizations and share them with others.
Sheetgo is an all-in-one data management platform that includes advanced features for data preparation and visualization. Instantly connect your files and create custom workflows to automate data transfers, manipulate data by filtering, merging, or splitting it, and collaborate securely with your team. You can easily visualize your data and share insights by creating custom dashboards with your chosen visualizations.
Tableau is a powerful data visualization tool used by businesses and organizations of all sizes. It provides a drag-and-drop interface that makes it easy to create a wide range of visualizations, from bar charts and line graphs to interactive dashboards and maps.
Tableau also offers a range of advanced features for data analysis and exploration, including the ability to connect to multiple data sources, perform calculations, and create complex data models.
Microsoft Power BI is a data visualization tool designed to work with the Microsoft suite of products, including Excel and SharePoint. Power BI provides a range of visualization options, including bar charts, line graphs, and maps, and it integrates seamlessly with other Microsoft tools.
Additionally, Power BI provides robust collaboration features that make it easy to share data and insights with others.
QlikView is a data visualization tool that provides a range of features for data analysis and exploration. It offers a user-friendly interface that makes it easy to create visualizations and provides a range of advanced data manipulation and analysis features.
QlikView also offers robust collaboration features, including the ability to share visualizations and insights with others.
SAP Lumira is a data visualization tool designed for businesses and organizations that need to analyze large amounts of data. It provides a range of visualization options, including bar charts, line graphs, and maps, and it integrates seamlessly with other SAP products.
SAP Lumira also offers robust collaboration features, including the ability to share visualizations and insights with others.
IBM Cognos Analytics is a data visualization tool that provides a range of features for data analysis and exploration. It offers a user-friendly interface that makes it easy to create visualizations and provides advanced data manipulation and analysis features.
IBM Cognos Analytics also integrates seamlessly with other IBM products, including Watson and SPSS, making it a powerful tool for businesses and organizations that need to analyze large amounts of data.
TIBCO Spotfire is a data visualization tool that provides a range of features for data analysis and exploration. It offers a user-friendly interface that makes it easy to create visualizations and provides advanced data manipulation and analysis features.
TIBCO Spotfire also offers robust collaboration features, including the ability to share visualizations and insights with others.
Oracle Business Intelligence is a data visualization tool that provides a range of features for data analysis and exploration. It offers a user-friendly interface that makes it easy to create visualizations, and it provides advanced features for data manipulation and analysis.
Oracle Business Intelligence also integrates seamlessly with other Oracle products, making it a powerful tool for businesses and organizations that need to analyze large amounts of data.
MicroStrategy is a data visualization tool that provides a range of features for data analysis and exploration. It offers a user-friendly interface that makes it easy to create visualizations, and it provides advanced features for data manipulation and analysis.
MicroStrategy also offers robust collaboration features, including the ability to share visualizations and insights with others.
To create effective visualizations, it's essential to follow best practices, including:
- Choose the right type of visualization: Choose the correct type of visualization that best represents the data you want to visualize.
- Keep it simple: Keep visualizations simple and easy to understand.
- Use color effectively: Use color effectively to highlight patterns and trends in the data.
- Label data points: Label data points to make understanding the data being represented easier.
- Remove unnecessary information: Remove any unnecessary information from the visualization to avoid clutter and confusion.

When sharing a Google Sheets spreadsheet Google usually tries to share the entire document. Here’s how to share only one tab instead.
When creating data visualizations, there are several tips and tricks that can be helpful, including:
- Use a clear and consistent format: Use a clear and consistent format when creating visualizations to ensure that they are easy to understand.
- Use interactive features: Use interactive features, such as hover-over text or drill-down capabilities, to make the visualization more engaging and interactive.
- Animate the data: Animate the data to show changes over time and highlight patterns and trends in the data.
Some examples of effective data visualization include:
- Line graph showing the trend of a stock's performance over time.
- Bar chart showing the distribution of customer ratings for a product.
- Scatter plot showing the relationship between two variables.
- Heat map showing the distribution of data across a geographical area.
- Pie chart showing the distribution of expenses in a household budget.
- Stacked bar chart showing the distribution of sales across different regions.
- Area chart showing the growth of a company's revenue over time.
- Donut chart comparing the market share of different smartphone brands.
- Bubble chart comparing the number of features, price, and popularity of different laptops.
- Choropleth map showing the literacy rate of different countries.
Google Sheets is a popular data visualization tool that allows users to create visualizations using data stored in a spreadsheet. To create a visualization in Google Sheets, users can follow these steps:
- 1. Open a Google Sheet and select the data you want to visualize.
- 2. Click on the "Insert" menu and select the type of visualization you want to create, such as a bar chart or line graph.
- 3. Customize the visualization as desired, including adding labels, changing the colors, and adjusting the axis scales.
- 4. Save the visualization and share it with others, if desired.
Google Sheets offers a range of visualization options, including bar charts, line graphs, pie charts, scatter plots, and more. The tool also allows users to customize their visualizations and add text, labels, and annotations to help explain the represented data. Additionally, Google Sheets makes it easy to share visualizations with others, either by sharing the entire Google Sheet or copying and pasting the visualization into another document.
Data visualization is a powerful tool for understanding and communicating data. By using data visualization tools and following best practices, users can create compelling visualizations that help to highlight patterns and trends in data and communicate insights to others. Whether you're using desktop software, an online tool, or Google Sheets, there are several options available for creating and sharing data visualizations.
Hady has a passion for tech, marketing, and spreadsheets. Besides his Computer Science degree, he has vast experience in developing, launching, and scaling content marketing processes at SaaS startups.
Layer is now Sheetgo
Automate your procesess on top of spreadsheets.
- Design & deliver
Data visualization: A detailed guide to visualizing data in your presentation
- Last Updated : October 20, 2023
- 15 Min Read

"The greatest value of a picture is when it forces us to notice what we never expected to see." - John W. Tukey, mathematician and statistician
Visualization helps decipher or break down information that is challenging to understand in text or numeric form. It's mostly used for data storytelling, as it is a great way to simplify information and present it in a format that is understandable, insightful, and actionable.
Whether you're a data analyst, a graphic designer, a content strategist or a social media manager, expertise in data visualization can help you solve a wide range of business challenges and tell impactful stories. In this blog post, we will look at a step-by-step approach to using data visualizations in your presentation.
What is data visualization?
Data visualization is the process of presenting data in a visual format, such as a chart, graph, or map. It helps users identify patterns and trends in a data set, making it easier to understand complex information. Visualizations can be used to analyze data, make predictions, and even communicate ideas more effectively.
Some examples of data visualizations include dashboards to track analytics, infographics for storytelling, or even word clouds to highlight the crux of your article or script.
Why do we have to visualize data?
In today's information-rich world, audiences are often bombarded with vast amounts of data and complex information. This is where data visualization comes into play—it transforms raw data into visually appealing and comprehensible formats, allowing audiences to grasp key insights and trends at a glance.
Consider the picture below:
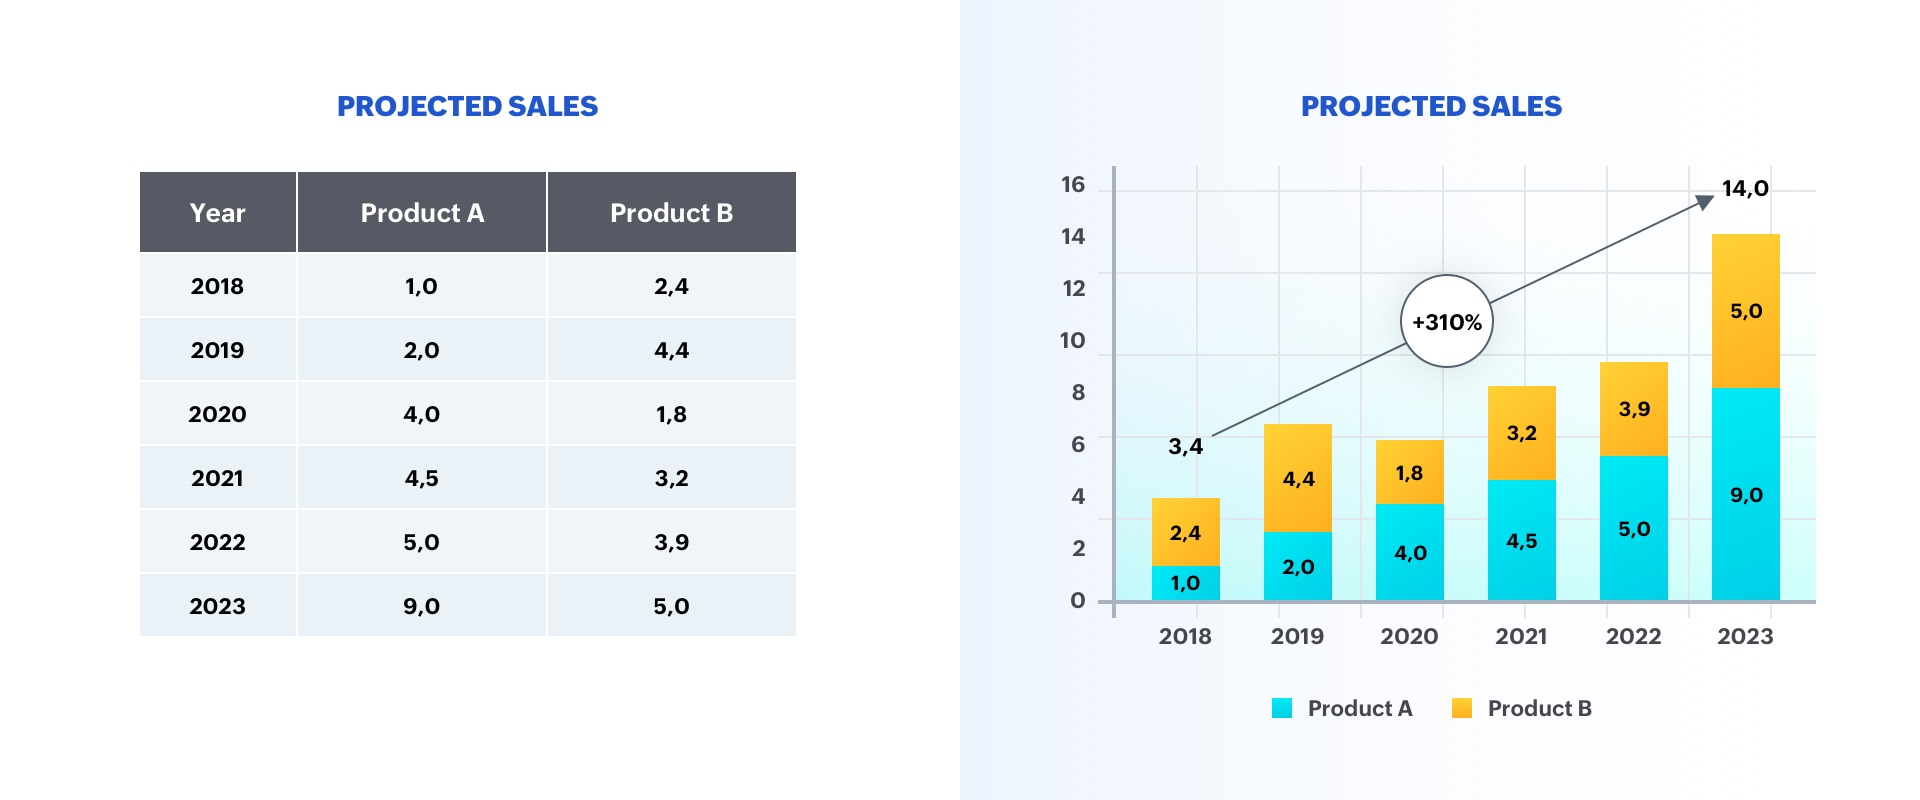
The option on the left is a table displaying two categories of data, whereas the option on the right is a graph representing sales growth. As you can see, the chart is more insightful, and makes it easier to identify trends in the numbers.
A good visualization typically represents some form of collected data as a picture, and can help with:
- Faster decision-making
- Identification of patterns and trends
- Presentation of an argument or story
Why is data visualization important in presentations?
Whether it's a business pitch, a campaign report, or a research presentation, data visualizations help you engage viewers on both rational and emotional levels.
They can be used to evoke empathy, urgency, or excitement, making the content more relatable and compelling. This is particularly crucial in decision-making contexts, where data-driven insights can sway opinions, drive actions, and guide strategic choices.
Ultimately, by incorporating data visualizations into presentations, you can benefit in the following ways:
- Elevate communication and convey impactful, data-centric narratives.
- Tell your story using visuals in a clear and meaningful way.
- Foster a deeper understanding of your data to make a stronger impact on the audience.
- Support idea generation and help derive business insights.
- Simplify data and business processes.
Step-by-step approach to data visualizations in presentations:
There are several factors to consider before adding a data visualization to your presentation. Here's a detailed guide:
Step 1: Define your purpose
The first step to visualizing data in your presentation is to determine your key message and decide on the type of story you are going to tell. Whether you plan to reveal trends, compare data, or explain a concept, a well-defined purpose will guide your data selection and visualization design, ensuring your visuals play a meaningful role in conveying your message.
Step 2: Understand your audience
Identify who your visualization is meant for and then make sure it fits their needs. Tailor your approach to suit your audience's familiarity with the topic and preferred level of detail. Knowing their expectations will help you fine-tune the complexity and depth of your visualizations, ensuring your presentation truly resonates with your audience.
Step 3: Choose your visualization type
Different data types and relationships call for different visualization formats. Selecting the appropriate chart, graph, or diagram is essential for accurately conveying your information. Here are some visualization types commonly used in presentations:
Tables: These consist of rows and columns and are used to compare variables in a structured way. Tables display data as categorical objects and make comparative data analysis easier. Example use: Pricing vs. feature comparison table.
Bar charts: Also known as column charts, these chart types use vertical or horizontal bars to compare categorical data. They are mainly used for analyzing value trends. Example use: Measure employee growth within a year.
Pie charts: These graphs are divided into sections that represent parts of a whole. They are used to compare the size of each component and are usually used to determine a percentage of the whole. Example use: Display website visitors by country.
Area charts: These are similar to bar and line graphs and show the progress of values over a period. These are mostly used to showcase data with a time-series relationship, and can be used to gauge the degree of a change in values. Example use: Show sales of different products in a financial year.
Histograms: Similar to bar charts (but with no space in between), histograms distribute numerical data. They are mainly used to plot the distribution of numbers and analyze the largest frequencies within a particular range. Example use: Measure app users by age.
Scatter charts: Also know as scatter plots, these graphs present the relationship between two variables. They are used to visualize large data sets, and show trends, clusters, patterns, and outliers. Example use: Track performance of different products in a suite.
Heat maps: These are a graphical way to visualize data in the form of hot and cold spots to identify user behavior. Example use: Present visitor behavior on your webpage.
Venn diagrams: These are best for showcasing similarities and differences between two or more categories. They are incredibly versatile and great for making comparisons, unions and intersections of different categories.
Timelines: These are best used for presenting chronological data. This is the most effective and efficient way to showcase events or time passage.
Flowcharts: These types of charts are ideal for showcasing a process or a workflow.
Infographics: These are a visual representation of content or data in a graphic format to make it more understandable at a glance.
Bonus: In addition to the above mentioned visualization types, you can use Gantt charts, word clouds, and tree maps. Gantt charts are used in project management presentations to demonstrate the work completed in a given period. Word clouds are a graphical representation of word frequency that gives greater prominence to the words that appear most within content. Tree maps display hierarchical data as a set of nested shapes, typically in the shape of rectangles.
Step 4: Use an appropriate chart
Once you're familiar with the different chart types available, the next step is to select the one that best conveys your key message. Knowing when and how to use each chart type empowers you to represent your data accurately and enhances the persuasiveness of your presentation. The best chart type for your needs depends more on the kind of analysis you are targeting than the type of data you've collected. Let's take a look at some of the most-used data visualization approaches in presentations.
Display changes over time: One of the most common applications of data visualizations is to show changes that have occurred over time. Bar or line charts are helpful in these instances.
Illustrate a part-to-whole composition: There might be times when you need to analyze the different components of a whole composition. Use pie, doughnut, and stacked bar charts for these part-to-whole compositions.
Visualize data distribution: Another important use of data visualization is to show how data has been distributed. Scatter plots, bar charts, and histograms help identify the outliers and demonstrate the range of information in the values.
Explore variable relationships: When you want to understand the relationship between two variables, use scatter plots or bubble charts. These can help you depict relationships between two variables, and observe trends and patterns between them.
Compare values between groups: Another common application of data visualization is in comparing values between two distinct groups. Using a grouped bar or line chart makes it easy to understand and compare trends.
There are several types of charts available in Zoho Show, each offering their own advantages. Learn how you can add and edit these charts in Show .
Step 5: Pick the right visualization tool
Utilize visualization software or tools that align with your proficiency and presentation needs. Factors such as ease of use, customization options, and compatibility with your data source should influence your choice of tool, enabling you to create impactful visualizations efficiently.
Zoho Show's charts are customizable, easy to use and come with wide range of options to make your data visualization easier. Some of the other prominent data visualization tools include Zoho Analytics , Tableau , Power Bi , and Infogram . These tools support a variety of visual styles and are capable of handling a large volume of data.
Step 6: Follow design best practices
Applying design principles will help you make sure your visualization is both aesthetically pleasing and easy to understand. You may apply these principles by choosing appropriate font colors and styles, or by effectively labeling and annotating your charts. By adhering to design best practices, you can create polished visuals and amplify the impact of your data-driven narrative.
Keep it simple: Data overload can quickly lead to confusion, so it’s important to include only the important information and simplify complex data. As a rule of thumb, don't crowd your slides with too much data, and avoid distracting elements.
Choose colors wisely: Use colors to differentiate and highlight information. The best practice is to use contrasting colors. You can also use patterns or texture to convey different types of information—but remember not to distort the data by applying 3D or gradient effects.
Add titles, labels, and annotations: Be sure to add a title, label, and description to your chart so your audience knows what they are looking at. Remember to keep it clear and concise.
Use proper fonts and text sizes: Use proper font styles and sizes to label and describe your charts. Your font choices may be playful, sophisticated, attention-grabbing, or elegant. Just be sure to choose a font that is easy to read and appropriate for your key message.
Closing thoughts
Human brains are naturally attuned to processing visual patterns and imageryUsing visuals not only helps you simplify complex information, but also makes your information more memorable. By leveraging charts and graphs, presenters can convey information to their audiences in a highly comprehensible manner. This helps them offer key insights and contribute to the decision-making process.
Ultimately, by incorporating data visualizations into presentations, presenters can elevate their communication from mere data sharing to impactful storytelling, fostering a deeper understanding of information among their audiences.
Related Topics
Leave a Reply
Your email address will not be published. Required fields are marked
You may also like

Mastering nonverbal communication in public speaking: A detailed guide

5 tips for creating memorable branding for your presentations

Accelerate your presentation creation process with Show's advanced capabilities
- Search Menu
- Browse content in Arts and Humanities
- Browse content in Art
- History of Art
- Theory of Art
- Browse content in History
- Environmental History
- History by Period
- Intellectual History
- Political History
- Regional and National History
- Social and Cultural History
- Theory, Methods, and Historiography
- Browse content in Linguistics
- Psycholinguistics
- Browse content in Literature
- Literary Studies - World
- Literary Studies (20th Century onwards)
- Literary Studies (African American Literature)
- Literary Studies (Poetry and Poets)
- Literary Theory and Cultural Studies
- Browse content in Media Studies
- Browse content in Philosophy
- Aesthetics and Philosophy of Art
- Feminist Philosophy
- History of Western Philosophy
- Metaphysics
- Moral Philosophy
- Philosophy of Religion
- Philosophy of Science
- Social and Political Philosophy
- Browse content in Religion
- Christianity
- East Asian Religions
- Judaism and Jewish Studies
- Religious Studies
- Browse content in Society and Culture
- Cultural Studies
- Ethical Issues and Debates
- Browse content in Law
- Criminal Law
- Medical and Healthcare Law
- Browse content in Medicine and Health
- Browse content in Clinical Medicine
- Palliative Medicine
- Browse content in Public Health and Epidemiology
- Public Health
- Browse content in Science and Mathematics
- Browse content in Biological Sciences
- Ecology and Conservation
- Evolutionary Biology
- Genetics and Genomics
- Browse content in Earth Sciences and Geography
- Palaeontology
- Environmental Science
- History of Science and Technology
- Browse content in Neuroscience
- Cognition and Behavioural Neuroscience
- Sensory and Motor Systems
- Browse content in Physics
- History of Physics
- Browse content in Psychology
- Clinical Psychology
- Cognitive Psychology
- Cognitive Neuroscience
- Criminal and Forensic Psychology
- Developmental Psychology
- Evolutionary Psychology
- Health Psychology
- Social Psychology
- Browse content in Social Sciences
- Browse content in Anthropology
- Regional Anthropology
- Theory and Practice of Anthropology
- Browse content in Business and Management
- Business Ethics
- Business History
- Business Strategy
- Corporate Governance
- Corporate Social Responsibility
- Information and Communication Technologies
- Browse content in Economics
- Behavioural Economics and Neuroeconomics
- Econometrics and Mathematical Economics
- Economic History
- Economic Development and Growth
- Financial Markets
- Financial Institutions and Services
- History of Economic Thought
- International Economics
- Macroeconomics and Monetary Economics
- Public Economics
- Browse content in Environment
- Climate Change
- Social Impact of Environmental Issues (Social Science)
- Interdisciplinary Studies
- Browse content in Politics
- Asian Politics
- Comparative Politics
- Conflict Politics
- Environmental Politics
- International Relations
- Middle Eastern Politics
- Political Economy
- Political Theory
- Public Policy
- Security Studies
- US Politics
- Browse content in Social Work
- Child and Adolescent Social Work
- Social Policy and Advocacy
- Social Work and Crime and Justice
- Social Work Macro Practice
- Social Work Research and Evidence-based Practice
- Browse content in Sociology
- Comparative and Historical Sociology
- Gender and Sexuality
- Gerontology and Ageing
- Health, Illness, and Medicine
- Marriage and the Family
- Race and Ethnicity
- Social Movements and Social Change
- Sport and Leisure
- Reviews and Awards
- Journals on Oxford Academic
- Books on Oxford Academic

- < Previous chapter
- Next chapter >

5 The Data Visualization Slide
- Published: November 2016
- Cite Icon Cite
- Permissions Icon Permissions
One of the primary visual elements researchers will use in their presentations is graphs, charts, and other visualizations to show estimates and findings. Because we are more likely to remember and recall information when it is presented visually, your graphs can have a profound effect on your audience, especially when they are created keeping the audience’s needs in mind. You can create more effective visualizations by using certain elements such as color, lines, shapes, and markings to highlight and show your data. But when you do so, be sure to link your text and your graphs and minimize or eliminate non-data elements like gridlines, tick marks, and data labels.
Signed in as
Institutional accounts.
- GoogleCrawler [DO NOT DELETE]
- Google Scholar Indexing
Personal account
- Sign in with email/username & password
- Get email alerts
- Save searches
- Purchase content
- Activate your purchase/trial code
Institutional access
- Sign in with a library card Sign in with username/password Recommend to your librarian
- Institutional account management
- Get help with access
Access to content on Oxford Academic is often provided through institutional subscriptions and purchases. If you are a member of an institution with an active account, you may be able to access content in one of the following ways:
IP based access
Typically, access is provided across an institutional network to a range of IP addresses. This authentication occurs automatically, and it is not possible to sign out of an IP authenticated account.
Sign in through your institution
Choose this option to get remote access when outside your institution. Shibboleth/Open Athens technology is used to provide single sign-on between your institution’s website and Oxford Academic.
- Click Sign in through your institution.
- Select your institution from the list provided, which will take you to your institution's website to sign in.
- When on the institution site, please use the credentials provided by your institution. Do not use an Oxford Academic personal account.
- Following successful sign in, you will be returned to Oxford Academic.
If your institution is not listed or you cannot sign in to your institution’s website, please contact your librarian or administrator.
Sign in with a library card
Enter your library card number to sign in. If you cannot sign in, please contact your librarian.
Society Members
Society member access to a journal is achieved in one of the following ways:
Sign in through society site
Many societies offer single sign-on between the society website and Oxford Academic. If you see ‘Sign in through society site’ in the sign in pane within a journal:
- Click Sign in through society site.
- When on the society site, please use the credentials provided by that society. Do not use an Oxford Academic personal account.
If you do not have a society account or have forgotten your username or password, please contact your society.
Sign in using a personal account
Some societies use Oxford Academic personal accounts to provide access to their members. See below.
A personal account can be used to get email alerts, save searches, purchase content, and activate subscriptions.
Some societies use Oxford Academic personal accounts to provide access to their members.
Viewing your signed in accounts
Click the account icon in the top right to:
- View your signed in personal account and access account management features.
- View the institutional accounts that are providing access.
Signed in but can't access content
Oxford Academic is home to a wide variety of products. The institutional subscription may not cover the content that you are trying to access. If you believe you should have access to that content, please contact your librarian.
For librarians and administrators, your personal account also provides access to institutional account management. Here you will find options to view and activate subscriptions, manage institutional settings and access options, access usage statistics, and more.
Our books are available by subscription or purchase to libraries and institutions.
- About Oxford Academic
- Publish journals with us
- University press partners
- What we publish
- New features
- Open access
- Rights and permissions
- Accessibility
- Advertising
- Media enquiries
- Oxford University Press
- Oxford Languages
- University of Oxford
Oxford University Press is a department of the University of Oxford. It furthers the University's objective of excellence in research, scholarship, and education by publishing worldwide
- Copyright © 2024 Oxford University Press
- Cookie settings
- Cookie policy
- Privacy policy
- Legal notice
This Feature Is Available To Subscribers Only
Sign In or Create an Account
This PDF is available to Subscribers Only
For full access to this pdf, sign in to an existing account, or purchase an annual subscription.
We use cookies
This website uses cookies to provide better user experience and user's session management. By continuing visiting this website you consent the use of these cookies.
ChartExpo Survey

Top 4 Text Visualization Examples
Extracting reliable and actionable insights into qualitative data, such as keywords, is complex and challenging, especially if you’re starting out.

You can easily get overwhelmed.
You need a tool that can pore through the qualitative data for low-hanging insights. Going manual is not an option.
This is where text visualization charts come in.
The charts use simple text analysis to help you visualize and summarize qualitative data, such as customer feedback and search terms. Below are some of the text visualization charts we recommend you try these:
- Slope Chart
- Sankey Chart
So, how can you access the charts highlighted above?
Google Sheets lack Word and Tag Clouds, Slope, and Sankey Charts.
You don’t have to do away with Google Sheets for other expensive tools. You can supercharge it by installing third-party add-ons to access easy-to-use text visualization charts.
In this blog, you’ll learn the following:
Table of Content:
What is text visualization, why do we need text visualization, text data visualization examples, how do you visualize text data, video tutorial: how to create word cloud in excel, what is the importance of visualization.
Before diving into the main theme, we’ll address the following question: what is text visualization?
Definition : The text visualization chart is the graphical representation of qualitative data frequency, such as keywords or customer feedback.
The graph gives greater prominence to words that appear more frequently in a source text. The larger the word, the higher its frequency.
You can use the chart to perform exploratory textual analysis by identifying words that frequently appear in a set of interviews, documents, or other text. Also, you can use it to communicate the most salient points or themes in the reporting stage.
Check out the uses of text visualization charts below:
Summarize Large Amounts of Text
Automatically highlight key terms in a series of texts, and categorize text by topic, sentiment, and more, saving hours of reading time.
With a text visualization or data visualization dashboard, you can understand text data at a glance.
Make Text Data Easy to Understand
Our brains process visual data 60,000 times faster than texts and numbers. Text visualization examples effectively simplify complex data and communicate ideas and concepts to team managers.
Find Insights in Qualitative Data
Customer feedback holds a trove of insights. Through text visualization examples, you can get an overview of the features, products, and topics that are most important to your customers.
Discover Hidden Trends and Patterns
You can easily analyze and visualize insights over time to detect fluctuations, and quickly find the root cause.
Extracting reliable insights from qualitative data sets, such as keywords, should never be an Achilles Heel for you. Keep reading because we’ll address the following question: why do we need text visualization?
Text Visualization can help reveal your audience’s thoughts
You can use the chart to understand your audience’s feelings about a topic/situation. Besides, you can leverage the chart to summarize data-driven views. The chart can help you summarize the market feedback using first-hand data.
Quick and informative
You can easily get live feedback from your audience in real-time
Exciting and emotional
The chart can help audiences feel part of your data story.
The Word cloud is incredibly engaging and visually appealing to many audiences. The chart can be an icebreaker or an entry point for a topic of discussion.
Word Clouds are visual
Our brains process visual content 60,000 times faster than texts and numbers. This provides a logical rationale for using the Word Cloud generator to analyze your textual data for actionable insights.
Creating a text visualization is straightforward
Generating text visualization examples is easy to follow. Yes, you read that right. Besides, the chart can provide you with insights into large data sets.
In the coming section, we’ll cover the following: text data visualization examples.
Word Clouds are charts that display insights into qualitative data frequency.

The visualization design gives greater prominence to words that appear more frequently in a source text. The larger the word, the higher its frequency. You can use the chart (one of the text visualization examples) to perform exploratory textual analysis by identifying words that frequently appear in a set of interviews, documents, or other text.
Also, you can use it to communicate the most salient points or themes in your data stories.
Tag clouds or text clouds are ideal if your goal is to pull out the most pertinent parts of textual data, from blog posts to databases.
You can use the tag cloud as a text visualization tool to compare and contrast two different pieces of text for similarities and differences.
Slope Charts show transitions, changes over time, absolute values, and even rankings. Besides, they’re also called Slope Graphs.

You can use this chart to show the before and after story of key variables.
Slope Graphs (one of the text visualization examples) can be useful when you have two time periods or points of comparison and want to show relative increases and decreases quickly across various categories between two data points.
The best way to explain the value of and use case for slope graphs is through a specific example.
This chart pack in a lot of information. In addition to the absolute values (the points), the lines that connect them give you the visual increase or decrease in the rate of change (via the slope or direction).
Note: Slope Charts require immense patience to create because you can’t find ready-made templates in most visualization tools.
Whether a slope chart will work in your data story or not depends on the nature of your data. For instance, if many lines overlap, your chart will lose effectiveness. And this is due to clutter.
However, you can overcome the above challenge to some degree by highlighting a single line category that has either increased or decreased over time.
A Sankey Diagram visualizes “a flow” from one set of values to the next. The two items being connected are referred to as “nodes.” The connections are labeled as “links”.

Besides, it’s named after an Irishman, Capt. Matthew Sankey first used them in a publication on the energy efficiency of a steam engine in 1898. Sankey diagrams were initially used to visualize and analyze energy flows, but they’re a great tool to depict the flow of money, time, and resources. Flows in the chart can display energy, materials, fluids, revenue, or costs.
You can use the visualization design to visually show complex processes, focusing on a single aspect or resource that you want to highlight. Besides, the chart offers the added benefit of supporting multiple viewing levels.
Audiences can get a high-level view, see specific details, or generate interactive views.
These visualization charts make dominant contributors or consumers stand out. Keep reading because we’ll address the following in the coming section: how do you visualize text data?
Google Sheets has default charts you can use to extract answers from your data.
However, you’ll never find ready-to-use text visualization examples, such as Word Cloud Charts, for your analysis. The most viable option available for you is installing a particular third-party add-on (we’ll talk about later) to access ready-made text-based charts.
You don’t need to do away with the Google Sheets.
We recommend you try the ChartExpo add-on for Google Sheets because of the reasons listed below.
ChartExpo does not require coding or programming skills, unlike other data visualization-based add-ons. It has a super-friendly user interface (UI) for everyone to use.
This tool comes pre-loaded with many ready-made charts to offset the missing ones in Google Sheets. Use ChartExpo to produce text visualization examples that are incredibly easy to read and understand.
How to make text visualization examples, such as Slope Charts, should never be time-consuming. Use ChartExpo to overcome this. You’ll learn more about this cutting-edge tool in the next section.
So, what is ChartExpo?
ChartExpo comes as an add-on for Google Sheets.
Essentially, it turns your Google Sheets into a usable data visualization tool capable of delivering hidden insights into your data, irrespective of the size or complexity.
The premium Text Visualization Maker comes with a 7-day free trial period.
The key benefit of ChartExpo is the fact that it produces charts in Excel and Google Sheets that are easy to read and interpret . More so, it allows you to save charts in the world’s most recognized formats, namely PNG, PDF, and JPG.
This section will use a Word Cloud Chart to display insights into the table below.
To Get Started with the text visualization examples, such as Word Cloud Chart, install the ChartExpo add-on for Google Sheets from the link and then follow the simple and easy steps below.
- Click the Extensions button >ChartExpo >Open .

- Click the Add New Chart button to access your fully stocked library of charts.

- Look for “Word Cloud Chart ” in the list.

- Select the sheet holding your data and select the Metrics option. Fill in the numerical numbers (in our scenario, we’ll fill in: the number of sales ).
- Select the Dimensions button and fill in the dimensional data (in our example, we’ll cities ).

- Finish the simple process by clicking the Create Chart button.
- Check out the final chart below.

The most prominent keywords are:
- San Francisco
- Nashville-Davison
- Virginia Beach
In the coming section, we will show you how to create a Word Cloud in Excel.
In the following video, you will learn how to Create a Word Cloud in Excel.
In the coming section, we’ll address the following: what is the importance of visualization?
Rejuvenate Productivity
The different types of charts for representing data we’ll talk about can improve productivity and efficiency in the workplace. In other words, you can leverage data to predict risks, such as declining productivity.
Charts and graphs can help you track productivity metrics in real-time. With a solid business analytics strategy, you can easily point out gaps and improvement areas in your workplace or business.
Personalize Your Offers
Today’s market craves products and services that can meet their individual needs.
One of the benefits of text visualization charts is that they can help you keep track of your target market’s tastes, preferences, and needs. You can leverage data from various attributions, such as social media and websites, to create a reliable persona for the market.
Decision-making Framework
Most companies are still betting on intuition rather than facts and data.
One of the key reasons for this could be a lack of access to quality data to back decision-making processes. Text visualization examples can help you distill signals from noise in your raw data. And this can save massive amounts of time.
Imagine the competitive advantage you would enjoy by relying on data to make strategic decisions.
What is text analysis used for?
We use graphs, such as Word Cloud Text, to display qualitative data frequency, such as customer feedback during text analysis. The charts give greater prominence to words that appear more frequently in a source text.
You can use the chart to perform exploratory textual analysis by identifying words that frequently appear in texts.
Why is text added to a data visualization presentation?
Texts are added to charts and graphs to guide the audience and provide context. Headlines, legends, and other labels provide extra information about the graph.
Headlines provide context under which the audience can use to interpret data. X and y-axes offer extra information, such as measurements used.
Extracting reliable and actionable insights into qualitative data, such as keywords, is easier said than done.
You can easily get overwhelmed, especially if the data is complex and bulky. You need a tool than can pore through the qualitative data for low-hanging insights.
This is where text visualization examples, such as Word Cloud, come in.
The charts use simple text analysis to help you visualize and summarize qualitative data, such as customer feedback and search terms. Some of the text visualization charts we recommend you try these:
So how can you access the charts highlighted above?
Google Sheets lack text visualization examples, such as Word and Tag Clouds. You don’t have to do away with Google Sheets for other expensive tools.
So, what’s the solution?
Download and install third-party apps, such as ChartExpo, to access ready-to-go text visualization examples, such as the Word Cloud Chart.
ChartExpo is an easy-to-use application you can easily download and install in your Google Sheets app. Besides, this tool comes loaded with insightful and ready-made text visualization designs. You don’t need programming or coding skills to visualize your data using ChartExpo.
Sign up for a 7-day free trial today to access easy-to-interpret and visually text visualization charts.
How much did you enjoy this article?

Related articles
Cost Performance Index Examples for Unraveling Efficiency
Navigate landscape of project management with real Cost Performance Index examples. Understand CPI formula & discover its role in early problem detection.
Income vs. Profit vs. Revenue: Mastering the Financial Trio
Explore intricate dance of income vs profit vs revenue in comprehensive guide. Unravel differences, analyze relationships, & gain insights for decision-making.
Project Status Reports Template: Elevate Reporting Game
Elevate project management game with comprehensive guide on project status reports templates. Uncover roadmap to success through streamlined reporting.
How to Create a Chart in Google Sheets in Few Steps?
Transform data into captivating charts effortlessly. Follow our guide on How to Create a Chart in Google Sheets & discover the key to insightful visuals.
Financial Insight: Profit and Loss Statement for a Small Business
Empower your strategy with our detailed profit and loss statement for a small business. Drive growth and enhance financial decision-making.
- Online Degree Explore Bachelor’s & Master’s degrees
- MasterTrack™ Earn credit towards a Master’s degree
- University Certificates Advance your career with graduate-level learning
- Top Courses
- Join for Free
Data Visualization: Definition, Benefits, and Examples
Data visualization helps data professionals tell a story with data. Here’s a definitive guide to data visualization.
![[Featured Image]: Data visualization analysts presenting and information with the team.](https://d3njjcbhbojbot.cloudfront.net/api/utilities/v1/imageproxy/https://images.ctfassets.net/wp1lcwdav1p1/2BXkg2yAyHZhrIiCh7kU2/f6056016866d29372996fb07fca41b20/GettyImages-1308902754.jpg?w=1500&h=680&q=60&fit=fill&f=faces&fm=jpg&fl=progressive&auto=format%2Ccompress&dpr=1&w=1000 "why text added to a data visualization presentation")
Data visualization is a powerful way for people, especially data professionals, to display data so that it can be interpreted easily. It helps tell a story with data, by turning spreadsheets of numbers into stunning graphs and charts.
In this article, you’ll learn all about data visualization, including its definition, benefits, examples, types, and tools. If you decide you want to learn the skills to incorporate it into your job, we'll point you toward online courses you can do from anywhere.
What is data visualization?
Data visualization is the representation of information and data using charts, graphs, maps, and other visual tools. These visualizations allow us to easily understand any patterns, trends, or outliers in a data set.
Data visualization also presents data to the general public or specific audiences without technical knowledge in an accessible manner. For example, the health agency in a government might provide a map of vaccinated regions.
The purpose of data visualization is to help drive informed decision-making and to add colorful meaning to an otherwise bland database.
Benefits of data visualization
Data visualization can be used in many contexts in nearly every field, like public policy, finance, marketing, retail, education, sports, history, and more. Here are the benefits of data visualization:
Storytelling: People are drawn to colors and patterns in clothing, arts and culture, architecture, and more. Data is no different—colors and patterns allow us to visualize the story within the data.
Accessibility: Information is shared in an accessible, easy-to-understand manner for a variety of audiences.
Visualize relationships: It’s easier to spot the relationships and patterns within a data set when the information is presented in a graph or chart.
Exploration: More accessible data means more opportunities to explore, collaborate, and inform actionable decisions.
Data visualization and big data
Companies collect “ big data ” and synthesize it into information. Data visualization helps portray significant insights—like a heat map to illustrate regions where individuals search for mental health assistance. To synthesize all that data, visualization software can be used in conjunction with data collecting software.
Tools for visualizing data
There are plenty of data visualization tools out there to suit your needs. Before committing to one, consider researching whether you need an open-source site or could simply create a graph using Excel or Google Charts. The following are common data visualization tools that could suit your needs.
Google Charts
ChartBlocks
FusionCharts
Get started with a free tool
No matter the field, using visual representations to illustrate data can be immensely powerful. Tableau has a free public tool that anyone can use to create stunning visualizations for a school project, non-profit, or small business.
Types of data visualization
Visualizing data can be as simple as a bar graph or scatter plot but becomes powerful when analyzing, for example, the median age of the United States Congress vis-a-vis the median age of Americans . Here are some common types of data visualizations:
Table: A table is data displayed in rows and columns, which can be easily created in a Word document or Excel spreadsheet.
Chart or graph: Information is presented in tabular form with data displayed along an x and y axis, usually with bars, points, or lines, to represent data in comparison. An infographic is a special type of chart that combines visuals and words to illustrate the data.
Gantt chart: A Gantt chart is a bar chart that portrays a timeline and tasks specifically used in project management.
Pie chart: A pie chart divides data into percentages featured in “slices” of a pie, all adding up to 100%.
Geospatial visualization: Data is depicted in map form with shapes and colors that illustrate the relationship between specific locations, such as a choropleth or heat map.
Dashboard: Data and visualizations are displayed, usually for business purposes, to help analysts understand and present data.
Data visualization examples
Using data visualization tools, different types of charts and graphs can be created to illustrate important data. These are a few examples of data visualization in the real world:
Data science: Data scientists and researchers have access to libraries using programming languages or tools such as Python or R, which they use to understand and identify patterns in data sets. Tools help these data professionals work more efficiently by coding research with colors, plots, lines, and shapes.
Marketing: Tracking data such as web traffic and social media analytics can help marketers analyze how customers find their products and whether they are early adopters or more of a laggard buyer. Charts and graphs can synthesize data for marketers and stakeholders to better understand these trends.
Finance: Investors and advisors focused on buying and selling stocks, bonds, dividends, and other commodities will analyze the movement of prices over time to determine which are worth purchasing for short- or long-term periods. Line graphs help financial analysts visualize this data, toggling between months, years, and even decades.
Health policy: Policymakers can use choropleth maps, which are divided by geographical area (nations, states, continents) by colors. They can, for example, use these maps to demonstrate the mortality rates of cancer or ebola in different parts of the world.
Tackle big business decisions by backing them up with data analytics. Google's Data Analytics Professional Certificate can boost your skills:
Jobs that use data visualization
From marketing to data analytics, data visualization is a skill that can be beneficial to many industries. Building your skills in data visualization can help in the following jobs:
Data visualization analyst: As a data visualization analyst (or specialist), you’d be responsible for creating and editing visual content such as maps, charts, and infographics from large data sets.
Data visualization engineer: Data visualization engineers and developers are experts in both maneuvering data with SQL, as well as assisting product teams in creating user-friendly dashboards that enable storytelling.
Data analyst: A data analyst collects, cleans, and interprets data sets to answer questions or solve business problems.
Data is everywhere. In creative roles such as graphic designer , content strategist, or social media specialist, data visualization expertise can help you solve challenging problems. You could create dashboards to track analytics as an email marketer or make infographics as a communications designer.
On the flip side, data professionals can benefit from data visualization skills to tell more impactful stories through data.
Read more: 5 Data Visualization Jobs (+ Ways to Build Your Skills Now)
Dive into data visualization
Learn the basics of data visualization with the University of California Davis’ Data Visualization with Tableau Specialization . You’ll leverage Tableau’s library of resources to learn best practices for data visualization and storytelling, learning from real-world and journalistic examples. Tableau is one of the most respected and accessible data visualization tools.
To learn more about data visualization using Excel and Cognos Analytics, take a look at IBM’s Data Analysis and Visualization Foundations Specialization .
Keep reading
Coursera staff.
Editorial Team
Coursera’s editorial team is comprised of highly experienced professional editors, writers, and fact...
This content has been made available for informational purposes only. Learners are advised to conduct additional research to ensure that courses and other credentials pursued meet their personal, professional, and financial goals.
- UC Berkeley
- Sign Up to Volunteer
- I School Slack
- Alumni News
- Alumni Events
- Alumni Accounts
- Career Support
- Academic Mission
- Diversity & Inclusion Resources
- DEIBJ Leadership
- Featured Faculty
- Featured Alumni
- Work at the I School
- Subscribe to Email Announcements
- Logos & Style Guide
- Directions & Parking
The School of Information is UC Berkeley’s newest professional school. Located in the center of campus, the I School is a graduate research and education community committed to expanding access to information and to improving its usability, reliability, and credibility while preserving security and privacy.
- Career Outcomes
- Degree Requirements
- Paths Through the MIMS Degree
- Final Project
- Funding Your Education
- Admissions Events
- Request Information
- Capstone Project
- Jack Larson Data for Good Fellowship
- Tuition & Fees
- Women in MIDS
- MIDS Curriculum News
- MICS Student News
- Dissertations
- Applied Data Science Certificate
- ICTD Certificate
- Citizen Clinic
The School of Information offers four degrees:
The Master of Information Management and Systems (MIMS) program educates information professionals to provide leadership for an information-driven world.
The Master of Information and Data Science (MIDS) is an online degree preparing data science professionals to solve real-world problems. The 5th Year MIDS program is a streamlined path to a MIDS degree for Cal undergraduates.
The Master of Information and Cybersecurity (MICS) is an online degree preparing cybersecurity leaders for complex cybersecurity challenges.
Our Ph.D. in Information Science is a research program for next-generation scholars of the information age.
- Spring 2024 Course Schedule
- Summer 2024 Course Schedule
- Fall 2024 Course Schedule
The School of Information's courses bridge the disciplines of information and computer science, design, social sciences, management, law, and policy. We welcome interest in our graduate-level Information classes from current UC Berkeley graduate and undergraduate students and community members. More information about signing up for classes.
- Ladder & Adjunct Faculty
- MIMS Students
- MIDS Students
- 5th Year MIDS Students
- MICS Students
- Ph.D. Students

- Publications
- Centers & Labs
- Computer-mediated Communication
- Data Science
- Entrepreneurship
- Human-computer Interaction (HCI)
- Information Economics
- Information Organization
- Information Policy
- Information Retrieval & Search
- Information Visualization
- Social & Cultural Studies
- Technology for Developing Regions
- User Experience Research
Research by faculty members and doctoral students keeps the I School on the vanguard of contemporary information needs and solutions.
The I School is also home to several active centers and labs, including the Center for Long-Term Cybersecurity (CLTC) , the Center for Technology, Society & Policy , and the BioSENSE Lab .
- Why Hire I School?
- Request a Resume Book
- Leadership Development Program
- Mailing List
- For Nonprofit and Government Employers
- Jobscan & Applicant Tracking Systems
- Resume & LinkedIn Review
- Resume Book
I School graduate students and alumni have expertise in data science, user experience design & research, product management, engineering, information policy, cybersecurity, and more — learn more about hiring I School students and alumni .
- Press Coverage
- I School Voices
- New Data Visualization Research Points to the Importance of Text in Information Visualization

The Goldman School of Public Policy, the CITRIS Policy Lab, and the School of Information hosted the inaugural UC...
")
Dr. Diag Davenport has been appointed as an assistant professor at UC Berkeley as part of a joint search in...
")
At the Women in Data Science conference held at UC Berkeley this past week, four educators affiliated with the...

At the UC Berkeley School of Information, two educators have taken the initiative to begin incorporating data...
- Distinguished Lecture Series
- I School Lectures
- Information Access Seminars
- CLTC Events
- Women in MIDS Events

The field of information visualization has historically focused on how visual representations can express relationships from abstract data. While visuals cannot exist solely without context in research, the placement and composition of text has often been overlooked and understudied.
For many years, Interim Dean and Professor Marti Hearst has taught two courses in alternating semesters; in the fall, natural language processing, and in the spring, information visualization. This juxtaposition led her to frequently consider the similarities and differences between how these two modalities can be used to communicate information.
Over the last two years, aided by Ph.D. student Chase Stokes, Hearst has begun explicitly studying the relationship between language — especially written text — and information visualization. She put various ideas together for an invited keynote talk at the IEEE Vis conference in October 2022, and in a corresponding paper in the Communications of the ACM this October of 2023.
The key insights of her newly published paper are first, that the interplay between language and visualizations for communication is not well understood. Second, that the field of data visualization should treat textual content as a primary design element. And finally, that recent advances in automatically generating visual content using language commands are likely to transform how visualizations are created.
“One thing we call for is for people to consider a text-only option when studying visualization solutions, since we consolidated evidence that a significant minority of viewers prefer text only,” explained Hearst. She added that while “the visualization field has theories of visual literacy, it should incorporate theories of reading literacy as well.”
In fact, the concept of visual literacy, defined as “the ability to critically interpret and construct visualizations,” has been shown to affect reading literacy. The integration of hyperlinks and emoji icons embedded into the text can slow down reading and therefore have deleterious effects on fluent reading. These considerations are important to note as researchers continue to study information visualization.
In her October 2022 keynote, Hearst pointed out that the future of the creation and programming of visualizations was going to be highly influenced by generative AI. This was proven true as ChatGPT arrived the following month, and Hearst has since noted that it is “profoundly disrupting the field of visualization and human-computer interaction.
For future work, Hearst forecasts that key questions will include “issues of how people interpret visualizations, the role of bias and misleading representations, and visualization for people who are sight impaired, [which] are all active research questions that automated tools do not answer.”
In the near future, Hearst hopes to see more researchers look into how visuals and text can support or impede each other, and how people cognitively perceive images and text together. “The field is ripe for innovation and increased understanding.”
Would you prefer a chart or text when being presented with information? Ph.D. student Chase Stokes has dedicated his studies to answering this question.
On July 1, 2023, long-time professor Marti Hearst, formerly head of school, became the I School’s dean for the upcoming academic year.
")
Last updated:
- Application
- Documentation
- Customer support
- Suggest a feature
What is Text Data Visualization and When to Use It
- February 6, 2023
- Data visualization

Drawing out relevant and essential information from a large body of text tends to be a tricky task, especially with big data playing such a significant role in the current data analysis scene. Whether it’s social media posts or customer feedback, a large amount of complex data can sometimes swamp the specific information we want to focus on.
That would require a tool to scan qualitative data for any low-hanging fruit. Doing this manually is out of the question and this is where text data visualization steps in.
Discover how text visualization will identify and highlight key information buried in your data. And understand how machine learning tools can amplify your text data visualization.
Text Visualization 101
Text visualization is a visual way of presenting information—word clouds, graphs, maps, timelines, networks and more, can all be used to visualize text data. Doing so provides a brief understanding of the most important keywords, and sums up and communicates trends and frameworks within a specific text.
By means of such text visualization tools, we can make sense of the main points.
Text Visualization is Useful for:
Condensing a lot of content . Cut down on time spent reading by emphasizing central phrases across multiple texts, grouping content by topic, sentiment and more. Could you imagine having to get through hundreds of client reviews? With a word cloud or bar chart, you can visualize data and instantly make sense of things.
Simplifying text data . Our brains are wired to enjoy and make sense of visual data and it’s proven that we sort through images quicker than we do with the written word. If you’re looking to simplify complex data and transmit those concepts to team managers, then text visualization is the way to go.
Determining insights in qualitative data . Customer feedback is jam-packed with practical insights. You’ll get an effective outline of the products, features and subjects that matter most to your clientele and the opportunity to figure out not only their pain points but where you’re succeeding with them.
Discover hidden trends . Use text analysis and gradually visualize insights in order to spot easily any inconsistencies and figure out the leading causes.
Text Mining
The fast growth spurt of social media platforms and availability of the internet means that year after year, a massive quantity of unstructured text data is produced. And that’s what text analysis is all about—acquiring insights or assembling this raw data with a view to propelling research, projects, business and other such activities.
A fresh area of research has emerged in the use of machinery to investigate texts—text mining. This is in contrast to the process of data mining used in computer science.
Text mining aims to uncover statistical patterns as it uses machines to analyze data points in a body of content with a large volume of text. Through this procedure, various patterns within a big data system begin to emerge.
Text mining benefits from text visualization tools as it’s so easy to read for both machine and human alike. The most vital bits of information are communicated through easy-to-read visual representations such as a bar chart, word cloud, graph, map, timeline or network.
Why Text Visualizations are Necessary
Makes text data easy to grasp.
Did you know that your brain sorts through visual data 60 000 times faster than words or numbers? Text visualizations make complex data clearer and powerfully transmit ideas to team managers.
Communicates What’s on Your Audience’s Mind
A chart can help you figure out how your audience feels about a certain subject or issue. This chart can also be leveraged to condense data-driven views. First-hand data can be used to summarize any market feedback.
Condenses Big Volumes of Text
Reduce the time you’d spend reading big volumes of text. Instantly emphasize the main terms in a string of texts, categorize content by subject, sentiment or other themes.
A quick scan of a text data visualization or dashboard will update you on all the vital info you want and need to know.
It Captivates
If you take a look at a word cloud, you’ll see that it is both eye-catching and informative. A well-designed chart can be used to start a conversation on an array of interesting topics.
It is Simple and Direct
Creating and reading text visualizations are actually pretty straightforward. Whether it’s a bar chart or a graph, you’ll gain some actionable insights into sizable data sets.
Let’s take a look at some effective examples of text data visualizations in the following part.
Text Data Visualization Examples
No doubt, data is best read and understood when it takes a visual form. Transforming dense tables into a refined and informative visualization requires artistry, especially as it not only gets the sense of the analysis itself but conveys the impact the core idea can make.
There are various text visualization designs, apart from the conventional frequency or distribution charts, which you should consider.

A word cloud is a grouping of keywords or tags using a particular color and font size to create a representation of a shape or figure you can easily recognize.
It’s considered to be one of the more visually appealing, creative and effective text visualization tools. Word frequency can be highlighted by using an eye-catching font size and color to showcase those specific phrases. It’s no wonder that word cloud plays an important role not only in text analysis but in digital humanities studies as well.
With just one quick look, readers can pinpoint the essential themes and subjects. Blogs and other sites make use of word clouds to communicate ideas more easily with visitors. And this innovative resource is used in data journalism to supplement textual information in news articles.
There is a great example in The New York Times article about American inflation. (Badger, E., Bhatia A., and Bui Q. “Bacon, Gas and Essentials: Where 2,200 Americans Have Noticed Inflation.” The New York Times , March 9, 2022 ) Word clouds were designed using the most recurring words or phrases from the research participant’s open-ended feedback.
The article shows that many participants noted the inflation in most products, but that it was gas and food that concerned them most. Orange is used in the word cloud to represent food categories and shines a light on the importance of the subject.
The shape and color of the word cloud play second to the font size which focuses on word frequency. Counting can be complex, so this text data visualization uses variation in size based on total word frequency rather than the novelty of the words.

A network showcases the relationship between different units that compose an entire network. This text data visualization is often used in literature to generate a network from the various aspects of the literary work and to find a connection between those aspects and the structure of the work.
In this image, a tree structure network is used to understand text data from part one of Kerouac’s On the Road . The reader grasps the main concept by looking over the visualization. By tracing the tree-like structure, the reader starts to identify how one part relates to the next without having to read the content.

With Word Art, you can create your own word clouds from a variety of image templates. This is a great resource if you’re looking to be original and creative when designing a word cloud. You can choose your font, size, style and layout and add words straight into the generator.
Collocate Clouds

Collocate clouds are another sort of tag clouds. They are a text data visualization for certain words that often occur alongside each other (collocations). These visualizations are mostly found in the general class of N-gram problems, with bigrams (two) and trigrams (three) becoming increasingly common.
N-grams have various applications in the area of genomics. They are also applied to algorithms related to grammar correction and text compression. Take a look at this bigram of the most recurrent word pairings identified in the README dataset.
Slope Chart
If you’re wanting to highlight transitions, absolute values, rankings and variations in the long term, then slope charts or graphs are the right text data visualization.
Have a look at this chart which explores key variables related to tourist hotspots over a period of time.
Slope charts/graphs are the perfect text visualization example when comparing time periods or other points of reference and want to underline rises and drops across diverse categories between two data points.
Creating concise and accurate slope charts demands perseverance as there are no pre-designed templates to work from.
The type of data you have will determine whether or not a slope chart will be an effective tool. As an example, your chart will not prove as effective if there are many overlapping lines. Instead, your text visualization will appear cluttered, and your idea will be lost.
Your beautiful data deserves to be online
wpDataTables can make it that way. There’s a good reason why it’s the #1 WordPress plugin for creating responsive tables and charts.

And it’s really easy to do something like this:
- You provide the table data
- Configure and customize it
- Publish it in a post or page
And it’s not just pretty, but also practical. You can make large tables with up to millions of rows , or you can use advanced filters and search , or you can go wild and make it editable .
“Yeah, but I just like Excel too much and there’s nothing like that on websites”. Yeah, there is. You can use conditional formatting like in Excel or Google Sheets.
Did I tell you you can create charts too with your data? And that’s only a small part. There are lots of other features for you.
Sankey Chart

With a Sankey Chart, you can visualize how one group of values flows to the next group. These two interconnected points are called ‘nodes’ and the connections are ‘links’.
Sankey diagrams were first used to create a visual analysis of energy flows, but they emerged as an effective tool for understanding the flow of time, money, and resources. The flow design with the chart can showcase materials, fluids, revenue, energy, and costs.
Complex processes can be untangled using this visualization. It focuses on a particular element or resource that you need to stress and has the advantage of promoting various viewing levels.
If you liked this article about text data visualization, you should check out this article about dynamic data visualization .
There are also similar articles discussing table data visualization , infographics and data visualization , survey data visualization , and effective data visualization .
And let’s not forget about articles on visualizing Google Sheets data , misleading statistics , data visualization skills , and what data visualization to use .

Bogdan Radusinovic
Senior SEO and Marketing Specialist
Related Posts
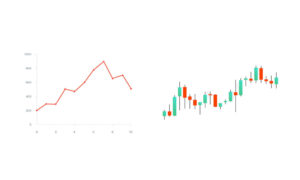
Line Chart Vs Candlestick: Which One Is Best And When
- Milan Jovanovic
- April 2, 2024
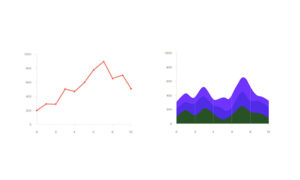
Line Chart Vs Area Chart: Which One Is Best And When
- March 28, 2024
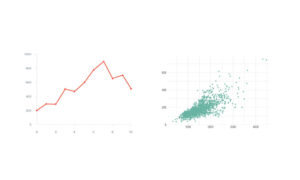
Line Chart Vs Scatter Plot: Which One Is Best And When
- March 25, 2024

- Virtual Visit
► Data Science
► Data Science With Python
► Data Analytics With Python
► Data Science With Python & R
► Big Data Hadoop
► Hadoop Admin
► Hadoop Data Analyst
► Big Data Testing
► Databases
► PL/SQL
► My/SQL
► MongoDB
► Business Analytics
► Business Analyst
► App Development
► Android App Development
► Cloud Computing
► AWS Cloud Computing
► Azure Cloud Computing
► GCP Cloud Computing
► Azure Data Engineer
► Full Stack Web Development
► Full Stack With React
► Full Stack With Angular
► Full Stack With Java
► Full Stack With Django
► Business Intelligence
► Tableau
► Data Warehousing & Business Intelligence
► Qlikview
► Cognos TM1
► IBM Cognos
► SAP Course
► SAP ABAP
► SAP HANA
► SAP Business Objects
► Business Process Automation
► RPA With UiPath
► Devops With AWS
► Programming
► Python
► Core Java
► Advanced Java
► JavaScript
► Laravel
► Codeigniter
► Symfony
► Ruby On Rails
► Zend Framework
► WordPress
► Joomla
► Automation Testing
► Selenium Automation Testing
► Software Testing
► Manual Testing
► Data Integration & Data Warehousing
► ETL Testing With Informatica
► ETL Development With Informatica
► Teradata
► AB Initio
► DataStage
► Digital Marketing
► Digital Marketing
► Linux Admin
► Red Hat Admin
► Spoken English
- FAQ – Frequently Asked Questions
- Latest Batches

- Data Analytics
Why Is Text Added To A Data Visualization Presentation?

- August 19, 2023
Table of Contents
Why is text added to a data visualization presentation
Have you ever come across the idea of transforming numbers into visuals? Well it’s possible because of Data Analytics and Data Visualization ! Imagine having a bunch of data, like numbers and facts, and transforming them into colorful charts, cool infographics, clear plots, and even moving animations. It’s like using visuals to speak the language of the human brain.
Have you ever thought about why we put text in data visualization presentations? We’ll use just one simple example to understand this interesting question.
Imagine looking at a beautiful painting. While the colors and shapes are visually shown, a small caption or title can provide important information about the artwork’s subject or the artist’s intention. When it comes to data visualization, in the same way, text plays an important role in making the visuals easier to understand & more impactful.
Just like that Text is added to data visualization presentations to provide context and perspective.
There are various methods, such as –
- Annotations
are used to enhance dashboard designs.
Before going into depth explanation Let’s First Understand What Is Data Visualization?
Enroll now and take the first step towards a successful career. Click here to join our courses today!
What Is Data Visualization?
Data visualization is basically creating pictures using numbers. It really helps us understand data by turning it into easy to read visuals format, just like charts or graphs. So this way, we can quickly see patterns and trends in the data . It’s like magic for turning confusing information into something clear and understandable.
Here are some great and popular tools for data visualization:
Tableau is a well liked tool known for simplifying data comprehension. It’s the best tool in data visualization, but it can be a bit expensive if you go for the paid version.
You can begin with the free version, but note that your data might not stay private. Plus, it’s quite adept at understanding everyday language.
Power BI tool is made by Microsoft and is great for both visualizing data and doing business intelligence stuff.
If you’re familiar with other Microsoft Office products, you’ll find this easy to learn. In presenting your data in an attractive and clear way, it’s very effective.
QlikView is somewhat similar to Tableau and has a large community of users who can help if you have questions. However, it’s not the easiest for beginners. It offers many advanced features (This can make it a bit overwhelming!). It can also understand natural (Human) language.
Level up your skills in Business Intelligence . Enroll now and become an expert.
Top 7 Tips for Adding Text to a Data Visualization Presentation
1) Clarity is Key: Keep your text concise and clear. Make sure you have to use simple words to explain difficult ideas without confusing the audience.
2) Context Matters: Begin with a brief introduction that sets the stage for your data visualization. Explain what the audience will observe and why it matters.
3) Highlight Insights: Use text to emphasize key findings or trends in your data. Direct the audience’s focus to what’s most important.
4) Use Visual Cues: Incorporate headings, titles, and labels to guide your audience through the presentation. Clear visuals with text cues create a smooth narrative flow.
5) Balance Text and Visuals: Maintain a harmonious balance between text and visual elements. Text should complement visuals, not overshadow them.
6) Ensure Accessibility: Choose readable fonts and colors that all viewers can easily see. Prioritize inclusivity to ensure everyone can understand your presentation.
7) Gather Feedback: Test your presentation on a diverse group before finalizing it. Collecting feedback makes sure that the text you add improves understanding and doesn’t create confusion for your audience.
Also Read: What Is Business Intelligence Architecture
Advantages and Disadvantages of adding text to a data visualization presentation
- Clarity: Text helps explain complex visuals, making data easier to understand.
- Context: Text provides an introduction, setting the scene for the data presentation.
- Highlighting: Key insights can be emphasized using text to guide audience attention.
- Guidance: Headings and labels help the audience navigate through the presentation.
- Accessibility: Clear fonts and colors make the information accessible to all viewers.
- Complementary: Text enhances visuals, creating a cohesive and informative narrative.
- Communication:Text helps clarify data units and gives extra information.
Disadvantages
- Overload: Too much text can overwhelm the audience and distract from visuals.
- Misinterpretation: Poorly written text can lead to misunderstandings or confusion.
- Lack of Focus: Excessive text can divert attention from critical data points.
- Aesthetic Impact: Too many words can clutter the presentation’s visual appeal.
- Time Consuming: Crafting effective text may require extra time and effort.
- Language Barriers: Complex language may hinder understanding for non-native speakers.
- Technical Terms: Unfamiliar terms can confuse audiences without specialized knowledge.
Also Read: Scope Of Business Analytics In 2023
You need to show your analysis in any presentation (If you want to make sensible presentations). Text analytics comes here. To explore this further and understand why text is added to a data visualization presentation, consider enrolling in Technogeeks course on Business Intelligence and Visualization for Beginners and experienced individuals.
Keep in mind, text and data visualization work together seamlessly, providing a strong method to clearly explain organizational structures & processes. If you make the most of text analytics and data visualization, your presentations will stand out.
Why is text added to a data visualization presentation?
So basically in data visualization text is added to help explain and provide context to the visualized data. It helps the users, shows important points, and makes hard information easier to get.
What to consider when using text in data visualizations?
Keep it clear and to the point. Second, Use a font that is easier on eyes. The text should be complementing the presentation, not overwhelming.
What is a Data Visualization presentation?
In a data visualization presentation, you give visual effects to the raw data. These effects (charts, graphs, histograms, etc.) are there to make the problems (or glitches) in data visible to the audience.
How do you present Data Visualization?
Start with a strong introduction. You are opening a world of visuals for the data to the audience. Use clear and catchy visuals. Add explanations in difficult points. Guide the audience’s focus through the key points.
Enroll now at Technogeeks to secure your future!
Get Free Career Counseling +91 8600998107 Or +91 7028710777

Leave a Reply Cancel reply
Your email address will not be published. Required fields are marked *
Save my name, email, and website in this browser for the next time I comment.

Top Trending Posts

What are Low-Code No-Code Platforms

What is Mendix | A Beginners Guide

Types Of Business Analytics

Computer Courses after 10th

Difference between Vlog and Blog

Best IT Courses After Graduation in Pune [Updated 2024]
Blogs you may like.

Technogeeks is a Group of IT working professionals located in Pune. We believe in sharing best practices with learners to build a great career in IT.
Popular Courses
Work with us.
Head Office (Pune):
3rd Floor, Plot No 7, Common Wealth Society, Aundh, Pune 411007
© All Rights Reserved.
- Call our Counselors:
- +91 8600998107
Get in touch to claim Best Available Discounts.
If You Are Looking for Job Assistance Please Fill Up the Form.

R news and tutorials contributed by hundreds of R bloggers
Data visualization reloaded: equipping your reports with the ultimate r package arsenal.
Posted on March 28, 2024 by Numbers around us in R bloggers | 0 Comments

In the vast and ever-expanding universe of data, the ability to not just see but truly understand the stories hidden within numbers becomes paramount. This journey of comprehension isn’t unlike the iconic moment from The Matrix , where Neo, standing amidst the endless possibilities of the digital realm, declares his need for “Guns, lots of guns.” In the context of our exploration, these “guns” are not weapons of destruction but powerful tools of creation and insight — data visualization packages for R, each with its unique capabilities to transform raw data into compelling narratives.
Our quest is navigated through the versatile landscapes of Quarto and R Markdown (Rmd), platforms that serve as the backbone for our reports. Whether you’re drafting an interactive web document, a static PDF, or a neatly formatted Word file, these tools are the canvases upon which our data stories will unfold. But a canvas alone does not make art — it’s the brushes, colors, and techniques that bring a scene to life. Similarly, our chosen R packages — each a brushstroke of genius — allow us to paint intricate pictures with our data.
This article will serve as your guide through this arsenal of visualization packages. From the foundational ggplot2 to the interactive plotly, the geospatial leaflet, and the detailed gt for tabular artistry, we'll cover a spectrum of tools that cater to every analyst's, researcher's, and data storyteller's needs. We'll delve into how each package can be utilized within Quarto and R Markdown to create reports that not only convey information but also engage and enlighten your audience.
As we embark on this journey together, remember that the power of these tools lies not just in their individual capabilities but in how they can be combined to tell a cohesive, compelling story. By the end of this exploration, you’ll be equipped with a diverse and potent arsenal, ready to tackle any data visualization challenge that comes your way.
Let the journey begin.
The Foundation with ggplot2
At the heart of our data visualization arsenal lies ggplot2, a package that has revolutionized the way we think about and create graphics in R. Inspired by Leland Wilkinson's Grammar of Graphics, ggplot2 allows users to assemble plots layer by layer, making the creation of complex visualizations both intuitive and accessible.
ggplot2 shines in its ability to break down and understand data visualization as a series of logical steps: data selection, aesthetic mapping, geometric objects, and statistical transformations. This structured approach enables users to craft nearly any type of graphic, from simple scatter plots to intricate layered visualizations. The package's extensive customization options—through scales, themes, and coordinates—further empower users to tailor their visuals to the precise narrative they wish to convey.
For reports in Quarto or R Markdown, ggplot2 acts as the foundational tool for data visualization. Its versatility is unmatched, offering crisp, publication-quality graphics for static outputs (PDF, DOCX) and adaptable visuals for dynamic HTML documents. Whether you're creating a formal report, a comprehensive academic paper, or an engaging web article, ggplot2 provides the necessary tools to visually articulate your data's story.
To illustrate the power of ggplot2, let's create a simple yet elegant scatter plot:

This code snippet highlights ggplot2's simplicity and elegance, creating a plot that is both visually appealing and informative. As we proceed to explore more specialized packages, ggplot2 remains our trusted foundation, enabling us to build upon it and enhance our reports with diverse visual narratives.
Enhancing Interactivity with plotly
In the dynamic world of web-based reporting, plotly stands out as a beacon of interactivity. It builds upon the static beauty of ggplot2 plots by adding a layer of engagement through interactive elements. Users can hover over data points, zoom in on areas of interest, and filter through datasets directly within their plots, transforming a static visualization into an interactive exploration.
plotly offers a wide range of interactive chart types, including line charts, bar charts, scatter plots, and more, all with the added benefit of user interaction. It's particularly adept at handling large datasets, making it possible to explore and interpret complex data in real-time. The package's ability to integrate with ggplot2 means that users can easily elevate their existing visualizations from static to dynamic with minimal effort.
For HTML reports created in Quarto or R Markdown, plotly enhances the reader's experience by making the data exploration an integral part of the narrative. This level of interactivity invites the audience to engage with the data on a deeper level, facilitating a more personalized exploration of the findings. It's especially useful in scenarios where understanding data nuances is crucial, such as in exploratory data analysis or when presenting results to a diverse audience.
Here’s how to transform a ggplot2 plot into an interactive plotly plot:
This code demonstrates the ease with which a static ggplot2 visualization can be converted into an interactive plotly graph. By incorporating plotly into your data storytelling toolkit, you unlock a world where data visualizations are not just seen but experienced.
Mapping Data with leaflet
Geospatial data visualization is a critical aspect of storytelling in many fields, from environmental science to urban planning. leaflet for R brings the power of interactive mapping to your reports, allowing you to create detailed, dynamic maps that can be embedded directly into HTML documents. Based on the Leaflet.js library, it is the premier tool for building interactive maps in the R ecosystem.
With leaflet, you can layer multiple data sources on a single map, customize map appearances, and add interactive features like pop-ups and markers. It supports various map types, including base maps from OpenStreetMap, Mapbox, and Google Maps. Whether you're tracking migration patterns, visualizing climate change data, or showcasing demographic trends, leaflet makes geospatial data accessible and engaging.
For Quarto or R Markdown reports destined for the web, leaflet maps offer a dynamic way to present geospatial data. Unlike static maps, leaflet enables readers to zoom in and out, explore different layers, and interact with the data points directly. This interactivity enhances the user's engagement and understanding, making leaflet an invaluable tool for reports that include location-based analysis or findings.
Creating an interactive map with leaflet is straightforward:

This example demonstrates how to create a basic interactive map showing specific locations. With leaflet, the complexity and depth of your geospatial visualizations are limited only by your imagination.
Interactive Tables with DT
In the realm of data presentation, tables are indispensable for displaying detailed information in a structured manner. DT (DataTables) is an R package that integrates the jQuery DataTables plugin, transforming static tables into interactive exploration tools. It enables users to search, sort, and paginate tables directly within HTML reports, enhancing the user's ability to engage with and understand the data.
DT offers a plethora of features to make tables more interactive and user-friendly. Highlights include automatic or custom column filtering, options for table styling, and the ability to include buttons for exporting the table to CSV, Excel, or PDF formats. These functionalities are particularly useful in reports that contain large datasets, allowing readers to navigate and focus on the data that interests them most.
For reports generated in Quarto or R Markdown with an HTML output, DT provides a superior way to present tabular data. It bridges the gap between static tables, which can be overwhelming and difficult to navigate, and the need for dynamic, accessible data presentation. Whether you're summarizing survey results, financial data, or scientific measurements, DT tables can significantly improve the readability and usability of your reports.
Here’s a simple example of how to create an interactive table with DT:

This code snippet demonstrates how to convert a subset of the mtcars dataset into an interactive table, complete with pagination and adjustable column widths. By integrating DT into your reporting toolkit, you can ensure that even the densest data tables become navigable and insightful components of your narrative.
The Grammar of Tables with gt
While DT focuses on interactivity for data tables, the gt package brings unparalleled levels of customization and styling to table creation in R. Standing for "Grammar of Tables," gt allows you to create highly detailed and beautifully formatted tables that communicate information clearly and effectively, akin to how ggplot2 revolutionizes plot creation.
gt enables you to craft tables that go beyond mere data presentation; it allows you to tell a story with your data. From adding footnotes, coloring cells based on values, to creating complex layouts with grouped headers and spanning labels, gt provides a comprehensive suite of tools for enhancing the aesthetic and functional aspects of tables in your reports.
In Quarto or R Markdown reports, regardless of the output format (HTML, PDF, or DOCX), gt tables can significantly elevate the visual standard and readability of your presentations. Especially in PDFs and printed documents, where interactive elements are not feasible, the detailed customization gt offers makes your tables not just data containers but key narrative elements of your report.
To demonstrate the capabilities of gt, let's create a simple yet styled table using a subset of the mtcars dataset:

This code snippet highlights how gt not only allows for the structuring and presentation of tabular data but also for the artistic expression within data reporting, making your tables both informative and visually appealing.
Bringing Plots to Life with ggiraph
In the quest to make reports more engaging, ggiraph emerges as a powerful ally, enabling the transformation of static ggplot2 graphics into interactive visual stories. ggiraph allows elements within ggplot2 plots, such as points, lines, and bars, to become interactive, supporting tooltips, hover actions, and even hyperlinks. This interactivity enriches the user experience, allowing for a deeper exploration and understanding of the underlying data.
The ggiraph package shines when you want to add a layer of engagement to your data visualizations. With it, viewers can hover over specific elements to see more details or click on parts of the graph to access external resources. This capability is invaluable for online reports, where reader engagement and interactivity are paramount.
For HTML-based reports created with Quarto or R Markdown, ggiraph enhances the storytelling potential by making data visualizations a two-way interaction channel. This feature is especially useful for exploratory data analysis, educational materials, or any report aiming to provide an immersive data exploration experience. While ggiraph excels in web environments, the static versions of these enriched plots still retain their aesthetic and informational value in PDF or DOCX outputs.
Here’s a basic example of how to create an interactive plot with ggiraph, making use of a simple ggplot2 bar chart:

This example assumes a scenario where clicking on a point in the scatter plot (simplified here as clicking on a category) would dynamically update the histogram to show the distribution of values for that category.
Seamless Plot Compositions with patchwork
While ggiraph brings individual plots to life with interactivity, patchwork is the tool for harmoniously combining multiple ggplot2 plots into a cohesive composition. patchwork simplifies the process of arranging multiple plots, allowing for complex layouts that maintain a unified aesthetic. It's akin to assembling a visual symphony from individual notes, where each plot plays its part in the overarching data narrative.
patchwork excels in its flexibility and ease of use, offering a syntax that is both intuitive and powerful. It allows for the vertical, horizontal, and nested arrangement of plots, and gives you control over spacing, alignment, and even shared legends. This capability is invaluable when you need to compare different aspects of your data side by side or tell a multi-faceted story through a series of visualizations.
In both Quarto and R Markdown reports, regardless of the output format, patchwork enables you to create visually appealing and informative plot arrangements. For static reports (PDF, DOCX), these compositions can help convey complex information in a digestible format. For HTML reports, while patchwork does not add interactivity to the plots themselves, the strategic arrangement of visual elements can guide the reader’s exploration of the data.
To demonstrate the power of patchwork, let's create a composition of two simple ggplot2 plots:

This example illustrates how patchwork seamlessly combines two distinct ggplot2 plots into a single, coherent visual statement. By arranging plots in a thoughtfully designed layout, you can enhance the storytelling impact of your data visualizations in reports.
Mastering Your Data Visualization Arsenal
Our journey through the landscape of R packages for enhancing reports in Quarto and R Markdown mirrors the pivotal scene from The Matrix , where an array of tools is summoned with a clear mission in mind. In our narrative, these tools — ggplot2, plotly, leaflet, DT, gt, ggiraph, and patchwork—form a robust arsenal, each offering unique capabilities to make our data reports not just informative, but compelling and engaging.
- ggplot2 laid the foundation, offering a versatile platform for creating a wide range of plots with deep customization options, ensuring that every chart precisely conveys its intended message.
- plotly and ggiraph introduced interactivity, transforming static images into dynamic conversations, inviting readers to explore and interact with the data on their terms.
- leaflet allowed us to map our narratives, providing geographical context and making location data more accessible and understandable.
- DT and gt revolutionized how we present tabular data, turning dense tables into clear, engaging visual elements of our reports.
- patchwork taught us the art of composition, enabling us to weave individual plots into coherent visual stories that guide the reader through our analyses seamlessly.
Each of these packages can be seen as a different type of “firearm” in our data visualization arsenal, equipped to tackle specific challenges and objectives in the realm of digital reporting. Whether we’re aiming for clarity, engagement, interactivity, or all of the above, our toolkit is now fully stocked to bring any data story to life.
As we conclude this exploration, remember that the true power of these tools lies not just in their individual capabilities but in how they can be combined to tell a cohesive, compelling story. Just as Neo chose his arsenal for the mission ahead, you now have the knowledge to select the right tools for your data visualization needs, ensuring your reports are not only seen but remembered.
The landscape of data storytelling is vast and ever-changing, but with this arsenal at your disposal, you’re well-equipped to make your mark. So, take these tools, explore their potential, and start crafting data stories that resonate, inform, and inspire.
Data Visualization Reloaded: Equipping Your Reports with the Ultimate R Package Arsenal was originally published in Numbers around us on Medium, where people are continuing the conversation by highlighting and responding to this story.
Copyright © 2024 | MH Corporate basic by MH Themes
Never miss an update! Subscribe to R-bloggers to receive e-mails with the latest R posts. (You will not see this message again.)
IMAGES
VIDEO
COMMENTS
So, text added to a data visualization presentation is the best way to summarize contexts. 2. It Makes the Data Easy to Understand. Visual data holds the utmost significance in data presentations because humans can process images faster than text. However, you may find it tough to understand complex datasets.
Text add to a data visualization presentation. Text in data visualization can help the audience understand data better and gain valuable insights. You can also provide additional information about the data in the presentation. This can help you highlight important features and points of data that need attention.
This article explains how to use text to make your visualizations easier to read and nicer to look at. Show information where readers need it. 01 Label directly. 02 Repeat the units your data is measured in. 03 Remind people what they're looking at in tooltips. 04 Move the axis ticks where they're needed.
Label - Text (words and numbers) is often used to label information. Labels offer critical information to help readers interpret visualizations. Introduce - Text is often required to set the reader on a clear path to understanding. An introduction should give readers a preview of what the graphic will show. Explain - Text can be used to ...
1. Collect your data. First things first, and that is to have all your information ready. Especially for long business presentations, there can be a lot of information to consider when working on your slides. Having it all organized and ready to use will make the whole process much easier to go through. 2.
Chances are, not much - but that's because text is undeniably one of the most vital components of data visualization.. While exploring the world of text in data visualization is quite an undertaking, we've put together some essential starting points to help you seamlessly integrate text into your charts. Whether it's through headings or labels, these recommendations are designed to ...
Pros And Cons Of Adding Text To A Data Visualization Presentation. There are both pros and cons to adding text to a data visualization presentation. Here are some of the most important factors: Pros. The presentation will be more understandable for the audience. You can provide more information about the data that is being shown.
Aug 31, 2023. --. Text is added to a data visualization presentation for several important reasons: Contextual Explanation: Data visualizations can often be complex and difficult to understand ...
Storytelling: Data visualization helps you tell a story with your data. You can highlight trends, correlations, and outliers, providing a compelling narrative. Use editable vivid infographics in PowerPoint. Choosing the Right Visualization. The first step in data visualization is selecting the right type of chart or graph for your data.
Data visualization is the process of converting complex data into visual representations that are easy to understand and interpret. There are several types of data visualization, including bar charts, line graphs, scatter plots, heat maps, and more. The purpose of data visualization is to help people understand and make sense of large data sets ...
In this blog post, we will look at a step-by-step approach to using data visualizations in your presentation. What is data visualization? Data visualization is the process of presenting data in a visual format, such as a chart, graph, or map. It helps users identify patterns and trends in a data set, making it easier to understand complex ...
They should effectively summarize the key ideas in your chart well. However, verbosity is a strict no-no when it comes to writing compelling chart captions. Avoid unnecessary articles and adjectives. Keep it short, concise, and crisp. Also, do not forget to mention the units of measurement in your caption or sub-caption.
Understanding a visualization can depend on a graph schema: a knowledge structure that includes default expectations, rules, and associations that a viewer uses to extract conceptual information from a data visualization. Figure 16 serves as an example of why a graph schema is often needed to interpret a data visualization. It depicts the GDP ...
Three Things to Remember about the Data Visualization Slide Three Things to Remember about the Data Visualization Slide. Notes. ... Now that you have started considering how to effectively add text to your slides—with an eye to adding less (and larger text) to help the audience easily and quickly process it—we move on to adding visual ...
Why is text added to a data visualization presentation? Texts are added to charts and graphs to guide the audience and provide context. Headlines, legends, and other labels provide extra information about the graph. Headlines provide context under which the audience can use to interpret data.
This section will share with you the 4 golden rules of creating a data visualization ppt your audience will understand. Data is only useful when your audience can understand it. One of the best ways to decipher a jumble of figures and statistics is to turn it into a visual representation. By understanding and choosing the best medium for your ...
Data visualization is the representation of information and data using charts, graphs, maps, and other visual tools. These visualizations allow us to easily understand any patterns, trends, or outliers in a data set. Data visualization also presents data to the general public or specific audiences without technical knowledge in an accessible ...
While adding text to your data visualization presentation, you may have to get rid of some of the text, but that is okay because, in the end, you want to keep your presentation smart, concise, and ...
The psychology of visual processing in data visualization is a deeply fascinating area that intersects psychology, neuroscience, and design principles. It focuses on how humans interpret, understand, and respond to visual data presentations. It highlights the incredible efficiency of our visual system compared to other forms of data processing.
Here's my five-step routine to make and deliver your data presentation right where it is intended —. 1. Understand Your Data & Make It Seen. Data slides aren't really about data; they're about the meaning of that data. As data professionals, everyone approaches data differently.
"One thing we call for is for people to consider a text-only option when studying visualization solutions, since we consolidated evidence that a significant minority of viewers prefer text only," explained Hearst. She added that while "the visualization field has theories of visual literacy, it should incorporate theories of reading ...
Text Visualization 101. Text visualization is a visual way of presenting information—word clouds, graphs, maps, timelines, networks and more, can all be used to visualize text data. Doing so provides a brief understanding of the most important keywords, and sums up and communicates trends and frameworks within a specific text.
You need to show your analysis in any presentation (If you want to make sensible presentations). Text analytics comes here. To explore this further and understand why text is added to a data visualization presentation, consider enrolling in Technogeeks course on Business Intelligence and Visualization for Beginners and experienced individuals.
The article talks about why is text added to data visualization presentation. Learn the pros and cons of adding text and tips on doing it. Technology Technology. Courses in Technology. ... Before you add text to a data visualization presentation, you should consider the pros and cons to avoid overdoing it. If you add text, be sure to do so ...
DT (DataTables) is an R package that integrates the jQuery DataTables plugin, transforming static tables into interactive exploration tools. It enables users to search, sort, and paginate tables directly within HTML reports, enhancing the user's ability to engage with and understand the data. DT offers a plethora of features to make tables more ...