
Statistics Made Easy

What is a Directional Hypothesis? (Definition & Examples)
A statistical hypothesis is an assumption about a population parameter . For example, we may assume that the mean height of a male in the U.S. is 70 inches.
The assumption about the height is the statistical hypothesis and the true mean height of a male in the U.S. is the population parameter .
To test whether a statistical hypothesis about a population parameter is true, we obtain a random sample from the population and perform a hypothesis test on the sample data.
Whenever we perform a hypothesis test, we always write down a null and alternative hypothesis:
- Null Hypothesis (H 0 ): The sample data occurs purely from chance.
- Alternative Hypothesis (H A ): The sample data is influenced by some non-random cause.
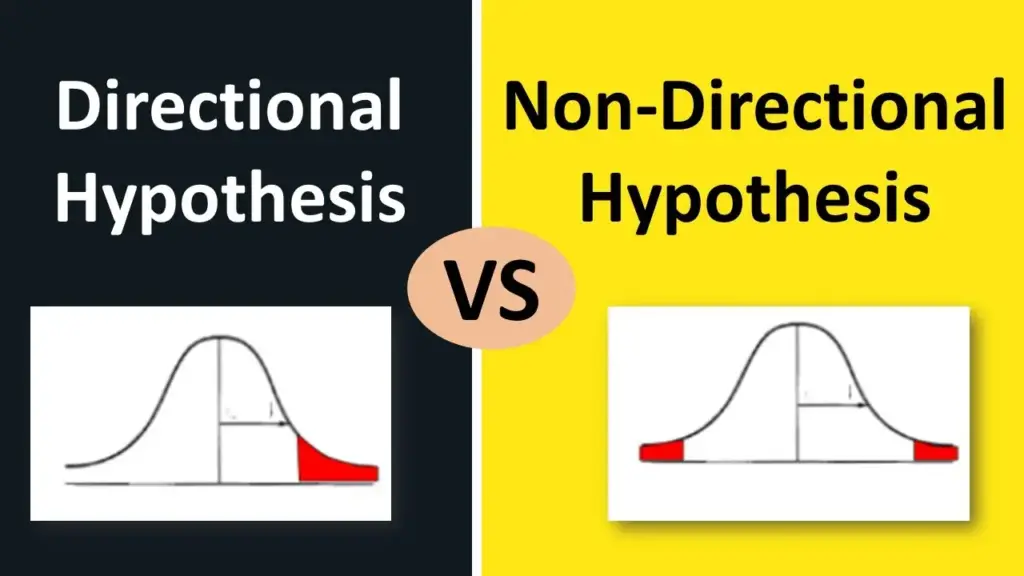
A hypothesis test can either contain a directional hypothesis or a non-directional hypothesis:
- Directional hypothesis: The alternative hypothesis contains the less than (“<“) or greater than (“>”) sign. This indicates that we’re testing whether or not there is a positive or negative effect.
- Non-directional hypothesis: The alternative hypothesis contains the not equal (“≠”) sign. This indicates that we’re testing whether or not there is some effect, without specifying the direction of the effect.
Note that directional hypothesis tests are also called “one-tailed” tests and non-directional hypothesis tests are also called “two-tailed” tests.
Check out the following examples to gain a better understanding of directional vs. non-directional hypothesis tests.
Example 1: Baseball Programs
A baseball coach believes a certain 4-week program will increase the mean hitting percentage of his players, which is currently 0.285.
To test this, he measures the hitting percentage of each of his players before and after participating in the program.
He then performs a hypothesis test using the following hypotheses:
- H 0 : μ = .285 (the program will have no effect on the mean hitting percentage)
- H A : μ > .285 (the program will cause mean hitting percentage to increase)
This is an example of a directional hypothesis because the alternative hypothesis contains the greater than “>” sign. The coach believes that the program will influence the mean hitting percentage of his players in a positive direction.
Example 2: Plant Growth
A biologist believes that a certain pesticide will cause plants to grow less during a one-month period than they normally do, which is currently 10 inches.
To test this, she applies the pesticide to each of the plants in her laboratory for one month.
She then performs a hypothesis test using the following hypotheses:
- H 0 : μ = 10 inches (the pesticide will have no effect on the mean plant growth)
- H A : μ < 10 inches (the pesticide will cause mean plant growth to decrease)
This is also an example of a directional hypothesis because the alternative hypothesis contains the less than “<” sign. The biologist believes that the pesticide will influence the mean plant growth in a negative direction.
Example 3: Studying Technique
A professor believes that a certain studying technique will influence the mean score that her students receive on a certain exam, but she’s unsure if it will increase or decrease the mean score, which is currently 82.
To test this, she lets each student use the studying technique for one month leading up to the exam and then administers the same exam to each of the students.
- H 0 : μ = 82 (the studying technique will have no effect on the mean exam score)
- H A : μ ≠ 82 (the studying technique will cause the mean exam score to be different than 82)
This is an example of a non-directional hypothesis because the alternative hypothesis contains the not equal “≠” sign. The professor believes that the studying technique will influence the mean exam score, but doesn’t specify whether it will cause the mean score to increase or decrease.
Additional Resources
Introduction to Hypothesis Testing Introduction to the One Sample t-test Introduction to the Two Sample t-test Introduction to the Paired Samples t-test
Featured Posts

Hey there. My name is Zach Bobbitt. I have a Masters of Science degree in Applied Statistics and I’ve worked on machine learning algorithms for professional businesses in both healthcare and retail. I’m passionate about statistics, machine learning, and data visualization and I created Statology to be a resource for both students and teachers alike. My goal with this site is to help you learn statistics through using simple terms, plenty of real-world examples, and helpful illustrations.
Leave a Reply Cancel reply
Your email address will not be published. Required fields are marked *
psychologyrocks
Hypotheses; directional and non-directional, what is the difference between an experimental and an alternative hypothesis.
Nothing much! If the study is a laboratory experiment then we can call the hypothesis “an experimental hypothesis”, where we make a prediction about how the IV causes an effect on the DV. If we have a non-experimental design, i.e. we are not able to manipulate the IV as in a natural or quasi-experiment , or if some other research method has been used, then we call it an “alternativehypothesis”, alternative to the null.
Directional hypothesis: A directional (or one tailed hypothesis) states which way you think the results are going to go, for example in an experimental study we might say…”Participants who have been deprived of sleep for 24 hours will have more cold symptoms in the following week after exposure to a virus than participants who have not been sleep deprived”; the hypothesis compares the two groups/conditions and states which one will ….have more/less, be quicker/slower, etc.
If we had a correlational study, the directional hypothesis would state whether we expect a positive or a negative correlation, we are stating how the two variables will be related to each other, e.g. there will be a positive correlation between the number of stressful life events experienced in the last year and the number of coughs and colds suffered, whereby the more life events you have suffered the more coughs and cold you will have had”. The directional hypothesis can also state a negative correlation, e.g. the higher the number of face-book friends, the lower the life satisfaction score “
Non-directional hypothesis: A non-directional (or two tailed hypothesis) simply states that there will be a difference between the two groups/conditions but does not say which will be greater/smaller, quicker/slower etc. Using our example above we would say “There will be a difference between the number of cold symptoms experienced in the following week after exposure to a virus for those participants who have been sleep deprived for 24 hours compared with those who have not been sleep deprived for 24 hours.”
When the study is correlational, we simply state that variables will be correlated but do not state whether the relationship will be positive or negative, e.g. there will be a significant correlation between variable A and variable B.
Null hypothesis The null hypothesis states that the alternative or experimental hypothesis is NOT the case, if your experimental hypothesis was directional you would say…
Participants who have been deprived of sleep for 24 hours will NOT have more cold symptoms in the following week after exposure to a virus than participants who have not been sleep deprived and any difference that does arise will be due to chance alone.
or with a directional correlational hypothesis….
There will NOT be a positive correlation between the number of stress life events experienced in the last year and the number of coughs and colds suffered, whereby the more life events you have suffered the more coughs and cold you will have had”
With a non-directional or two tailed hypothesis…
There will be NO difference between the number of cold symptoms experienced in the following week after exposure to a virus for those participants who have been sleep deprived for 24 hours compared with those who have not been sleep deprived for 24 hours.
or for a correlational …
there will be NO correlation between variable A and variable B.
When it comes to conducting an inferential stats test, if you have a directional hypothesis , you must do a one tailed test to find out whether your observed value is significant. If you have a non-directional hypothesis , you must do a two tailed test .
Exam Techniques/Advice
- Remember, a decent hypothesis will contain two variables, in the case of an experimental hypothesis there will be an IV and a DV; in a correlational hypothesis there will be two co-variables
- both variables need to be fully operationalised to score the marks, that is you need to be very clear and specific about what you mean by your IV and your DV; if someone wanted to repeat your study, they should be able to look at your hypothesis and know exactly what to change between the two groups/conditions and exactly what to measure (including any units/explanation of rating scales etc, e.g. “where 1 is low and 7 is high”)
- double check the question, did it ask for a directional or non-directional hypothesis?
- if you were asked for a null hypothesis, make sure you always include the phrase “and any difference/correlation (is your study experimental or correlational?) that does arise will be due to chance alone”
Practice Questions:
- Mr Faraz wants to compare the levels of attendance between his psychology group and those of Mr Simon, who teaches a different psychology group. Which of the following is a suitable directional (one tailed) hypothesis for Mr Faraz’s investigation?
A There will be a difference in the levels of attendance between the two psychology groups.
B Students’ level of attendance will be higher in Mr Faraz’s group than Mr Simon’s group.
C Any difference in the levels of attendance between the two psychology groups is due to chance.
D The level of attendance of the students will depend upon who is teaching the groups.
2. Tracy works for the local council. The council is thinking about reducing the number of people it employs to pick up litter from the street. Tracy has been asked to carry out a study to see if having the streets cleaned at less regular intervals will affect the amount of litter the public will drop. She studies a street to compare how much litter is dropped at two different times, once when it has just been cleaned and once after it has not been cleaned for a month.
Write a fully operationalised non-directional (two-tailed) hypothesis for Tracy’s study. (2)
3. Jamila is conducting a practical investigation to look at gender differences in carrying out visuo-spatial tasks. She decides to give males and females a jigsaw puzzle and will time them to see who completes it the fastest. She uses a random sample of pupils from a local school to get her participants.
(a) Write a fully operationalised directional (one tailed) hypothesis for Jamila’s study. (2) (b) Outline one strength and one weakness of the random sampling method. You may refer to Jamila’s use of this type of sampling in your answer. (4)
4. Which of the following is a non-directional (two tailed) hypothesis?
A There is a difference in driving ability with men being better drivers than women
B Women are better at concentrating on more than one thing at a time than men
C Women spend more time doing the cooking and cleaning than men
D There is a difference in the number of men and women who participate in sports
Revision Activity
writing-hypotheses-revision-sheet
Quizizz link for teachers: https://quizizz.com/admin/quiz/5bf03f51add785001bc5a09e
Share this:
- Already have a WordPress.com account? Log in now.
- Subscribe Subscribed
- Copy shortlink
- Report this content
- View post in Reader
- Manage subscriptions
- Collapse this bar
What is The Null Hypothesis & When Do You Reject The Null Hypothesis
Julia Simkus
Editor at Simply Psychology
BA (Hons) Psychology, Princeton University
Julia Simkus is a graduate of Princeton University with a Bachelor of Arts in Psychology. She is currently studying for a Master's Degree in Counseling for Mental Health and Wellness in September 2023. Julia's research has been published in peer reviewed journals.
Learn about our Editorial Process
Saul Mcleod, PhD
Editor-in-Chief for Simply Psychology
BSc (Hons) Psychology, MRes, PhD, University of Manchester
Saul Mcleod, PhD., is a qualified psychology teacher with over 18 years of experience in further and higher education. He has been published in peer-reviewed journals, including the Journal of Clinical Psychology.
Olivia Guy-Evans, MSc
Associate Editor for Simply Psychology
BSc (Hons) Psychology, MSc Psychology of Education
Olivia Guy-Evans is a writer and associate editor for Simply Psychology. She has previously worked in healthcare and educational sectors.
On This Page:
A null hypothesis is a statistical concept suggesting no significant difference or relationship between measured variables. It’s the default assumption unless empirical evidence proves otherwise.
The null hypothesis states no relationship exists between the two variables being studied (i.e., one variable does not affect the other).
The null hypothesis is the statement that a researcher or an investigator wants to disprove.
Testing the null hypothesis can tell you whether your results are due to the effects of manipulating the dependent variable or due to random chance.
How to Write a Null Hypothesis
Null hypotheses (H0) start as research questions that the investigator rephrases as statements indicating no effect or relationship between the independent and dependent variables.
It is a default position that your research aims to challenge or confirm.
For example, if studying the impact of exercise on weight loss, your null hypothesis might be:
There is no significant difference in weight loss between individuals who exercise daily and those who do not.
Examples of Null Hypotheses
When do we reject the null hypothesis .
We reject the null hypothesis when the data provide strong enough evidence to conclude that it is likely incorrect. This often occurs when the p-value (probability of observing the data given the null hypothesis is true) is below a predetermined significance level.
If the collected data does not meet the expectation of the null hypothesis, a researcher can conclude that the data lacks sufficient evidence to back up the null hypothesis, and thus the null hypothesis is rejected.
Rejecting the null hypothesis means that a relationship does exist between a set of variables and the effect is statistically significant ( p > 0.05).
If the data collected from the random sample is not statistically significance , then the null hypothesis will be accepted, and the researchers can conclude that there is no relationship between the variables.
You need to perform a statistical test on your data in order to evaluate how consistent it is with the null hypothesis. A p-value is one statistical measurement used to validate a hypothesis against observed data.
Calculating the p-value is a critical part of null-hypothesis significance testing because it quantifies how strongly the sample data contradicts the null hypothesis.
The level of statistical significance is often expressed as a p -value between 0 and 1. The smaller the p-value, the stronger the evidence that you should reject the null hypothesis.

Usually, a researcher uses a confidence level of 95% or 99% (p-value of 0.05 or 0.01) as general guidelines to decide if you should reject or keep the null.
When your p-value is less than or equal to your significance level, you reject the null hypothesis.
In other words, smaller p-values are taken as stronger evidence against the null hypothesis. Conversely, when the p-value is greater than your significance level, you fail to reject the null hypothesis.
In this case, the sample data provides insufficient data to conclude that the effect exists in the population.
Because you can never know with complete certainty whether there is an effect in the population, your inferences about a population will sometimes be incorrect.
When you incorrectly reject the null hypothesis, it’s called a type I error. When you incorrectly fail to reject it, it’s called a type II error.
Why Do We Never Accept The Null Hypothesis?
The reason we do not say “accept the null” is because we are always assuming the null hypothesis is true and then conducting a study to see if there is evidence against it. And, even if we don’t find evidence against it, a null hypothesis is not accepted.
A lack of evidence only means that you haven’t proven that something exists. It does not prove that something doesn’t exist.
It is risky to conclude that the null hypothesis is true merely because we did not find evidence to reject it. It is always possible that researchers elsewhere have disproved the null hypothesis, so we cannot accept it as true, but instead, we state that we failed to reject the null.
One can either reject the null hypothesis, or fail to reject it, but can never accept it.
Why Do We Use The Null Hypothesis?
We can never prove with 100% certainty that a hypothesis is true; We can only collect evidence that supports a theory. However, testing a hypothesis can set the stage for rejecting or accepting this hypothesis within a certain confidence level.
The null hypothesis is useful because it can tell us whether the results of our study are due to random chance or the manipulation of a variable (with a certain level of confidence).
A null hypothesis is rejected if the measured data is significantly unlikely to have occurred and a null hypothesis is accepted if the observed outcome is consistent with the position held by the null hypothesis.
Rejecting the null hypothesis sets the stage for further experimentation to see if a relationship between two variables exists.
Hypothesis testing is a critical part of the scientific method as it helps decide whether the results of a research study support a particular theory about a given population. Hypothesis testing is a systematic way of backing up researchers’ predictions with statistical analysis.
It helps provide sufficient statistical evidence that either favors or rejects a certain hypothesis about the population parameter.
Purpose of a Null Hypothesis
- The primary purpose of the null hypothesis is to disprove an assumption.
- Whether rejected or accepted, the null hypothesis can help further progress a theory in many scientific cases.
- A null hypothesis can be used to ascertain how consistent the outcomes of multiple studies are.
Do you always need both a Null Hypothesis and an Alternative Hypothesis?
The null (H0) and alternative (Ha or H1) hypotheses are two competing claims that describe the effect of the independent variable on the dependent variable. They are mutually exclusive, which means that only one of the two hypotheses can be true.
While the null hypothesis states that there is no effect in the population, an alternative hypothesis states that there is statistical significance between two variables.
The goal of hypothesis testing is to make inferences about a population based on a sample. In order to undertake hypothesis testing, you must express your research hypothesis as a null and alternative hypothesis. Both hypotheses are required to cover every possible outcome of the study.
What is the difference between a null hypothesis and an alternative hypothesis?
The alternative hypothesis is the complement to the null hypothesis. The null hypothesis states that there is no effect or no relationship between variables, while the alternative hypothesis claims that there is an effect or relationship in the population.
It is the claim that you expect or hope will be true. The null hypothesis and the alternative hypothesis are always mutually exclusive, meaning that only one can be true at a time.
What are some problems with the null hypothesis?
One major problem with the null hypothesis is that researchers typically will assume that accepting the null is a failure of the experiment. However, accepting or rejecting any hypothesis is a positive result. Even if the null is not refuted, the researchers will still learn something new.
Why can a null hypothesis not be accepted?
We can either reject or fail to reject a null hypothesis, but never accept it. If your test fails to detect an effect, this is not proof that the effect doesn’t exist. It just means that your sample did not have enough evidence to conclude that it exists.
We can’t accept a null hypothesis because a lack of evidence does not prove something that does not exist. Instead, we fail to reject it.
Failing to reject the null indicates that the sample did not provide sufficient enough evidence to conclude that an effect exists.
If the p-value is greater than the significance level, then you fail to reject the null hypothesis.
Is a null hypothesis directional or non-directional?
A hypothesis test can either contain an alternative directional hypothesis or a non-directional alternative hypothesis. A directional hypothesis is one that contains the less than (“<“) or greater than (“>”) sign.
A nondirectional hypothesis contains the not equal sign (“≠”). However, a null hypothesis is neither directional nor non-directional.
A null hypothesis is a prediction that there will be no change, relationship, or difference between two variables.
The directional hypothesis or nondirectional hypothesis would then be considered alternative hypotheses to the null hypothesis.
Gill, J. (1999). The insignificance of null hypothesis significance testing. Political research quarterly , 52 (3), 647-674.
Krueger, J. (2001). Null hypothesis significance testing: On the survival of a flawed method. American Psychologist , 56 (1), 16.
Masson, M. E. (2011). A tutorial on a practical Bayesian alternative to null-hypothesis significance testing. Behavior research methods , 43 , 679-690.
Nickerson, R. S. (2000). Null hypothesis significance testing: a review of an old and continuing controversy. Psychological methods , 5 (2), 241.
Rozeboom, W. W. (1960). The fallacy of the null-hypothesis significance test. Psychological bulletin , 57 (5), 416.
Directional and non-directional hypothesis: A Comprehensive Guide
Karolina Konopka
Customer support manager

In the world of research and statistical analysis, hypotheses play a crucial role in formulating and testing scientific claims. Understanding the differences between directional and non-directional hypothesis is essential for designing sound experiments and drawing accurate conclusions. Whether you’re a student, researcher, or simply curious about the foundations of hypothesis testing, this guide will equip you with the knowledge and tools to navigate this fundamental aspect of scientific inquiry.
Understanding Directional Hypothesis
Understanding directional hypotheses is crucial for conducting hypothesis-driven research, as they guide the selection of appropriate statistical tests and aid in the interpretation of results. By incorporating directional hypotheses, researchers can make more precise predictions, contribute to scientific knowledge, and advance their fields of study.
Definition of directional hypothesis
Directional hypotheses, also known as one-tailed hypotheses, are statements in research that make specific predictions about the direction of a relationship or difference between variables. Unlike non-directional hypotheses, which simply state that there is a relationship or difference without specifying its direction, directional hypotheses provide a focused and precise expectation.
A directional hypothesis predicts either a positive or negative relationship between variables or predicts that one group will perform better than another. It asserts a specific direction of effect or outcome. For example, a directional hypothesis could state that “increased exposure to sunlight will lead to an improvement in mood” or “participants who receive the experimental treatment will exhibit higher levels of cognitive performance compared to the control group.”
Directional hypotheses are formulated based on existing theory, prior research, or logical reasoning, and they guide the researcher’s expectations and analysis. They allow for more targeted predictions and enable researchers to test specific hypotheses using appropriate statistical tests.
The role of directional hypothesis in research
Directional hypotheses also play a significant role in research surveys. Let’s explore their role specifically in the context of survey research:
- Objective-driven surveys : Directional hypotheses help align survey research with specific objectives. By formulating directional hypotheses, researchers can focus on gathering data that directly addresses the predicted relationship or difference between variables of interest.
- Question design and measurement : Directional hypotheses guide the design of survey question types and the selection of appropriate measurement scales. They ensure that the questions are tailored to capture the specific aspects related to the predicted direction, enabling researchers to obtain more targeted and relevant data from survey respondents.
- Data analysis and interpretation : Directional hypotheses assist in data analysis by directing researchers towards appropriate statistical tests and methods. Researchers can analyze the survey data to specifically test the predicted relationship or difference, enhancing the accuracy and reliability of their findings. The results can then be interpreted within the context of the directional hypothesis, providing more meaningful insights.
- Practical implications and decision-making : Directional hypotheses in surveys often have practical implications. When the predicted relationship or difference is confirmed, it informs decision-making processes, program development, or interventions. The survey findings based on directional hypotheses can guide organizations, policymakers, or practitioners in making informed choices to achieve desired outcomes.
- Replication and further research : Directional hypotheses in survey research contribute to the replication and extension of studies. Researchers can replicate the survey with different populations or contexts to assess the generalizability of the predicted relationships. Furthermore, if the directional hypothesis is supported, it encourages further research to explore underlying mechanisms or boundary conditions.
By incorporating directional hypotheses in survey research, researchers can align their objectives, design effective surveys, conduct focused data analysis, and derive practical insights. They provide a framework for organizing survey research and contribute to the accumulation of knowledge in the field.
Examples of research questions for directional hypothesis
Here are some examples of research questions that lend themselves to directional hypotheses:
- Does increased daily exercise lead to a decrease in body weight among sedentary adults?
- Is there a positive relationship between study hours and academic performance among college students?
- Does exposure to violent video games result in an increase in aggressive behavior among adolescents?
- Does the implementation of a mindfulness-based intervention lead to a reduction in stress levels among working professionals?
- Is there a difference in customer satisfaction between Product A and Product B, with Product A expected to have higher satisfaction ratings?
- Does the use of social media influence self-esteem levels, with higher social media usage associated with lower self-esteem?
- Is there a negative relationship between job satisfaction and employee turnover, indicating that lower job satisfaction leads to higher turnover rates?
- Does the administration of a specific medication result in a decrease in symptoms among individuals with a particular medical condition?
- Does increased access to early childhood education lead to improved cognitive development in preschool-aged children?
- Is there a difference in purchase intention between advertisements with celebrity endorsements and advertisements without, with celebrity endorsements expected to have a higher impact?
These research questions generate specific predictions about the direction of the relationship or difference between variables and can be tested using appropriate research methods and statistical analyses.
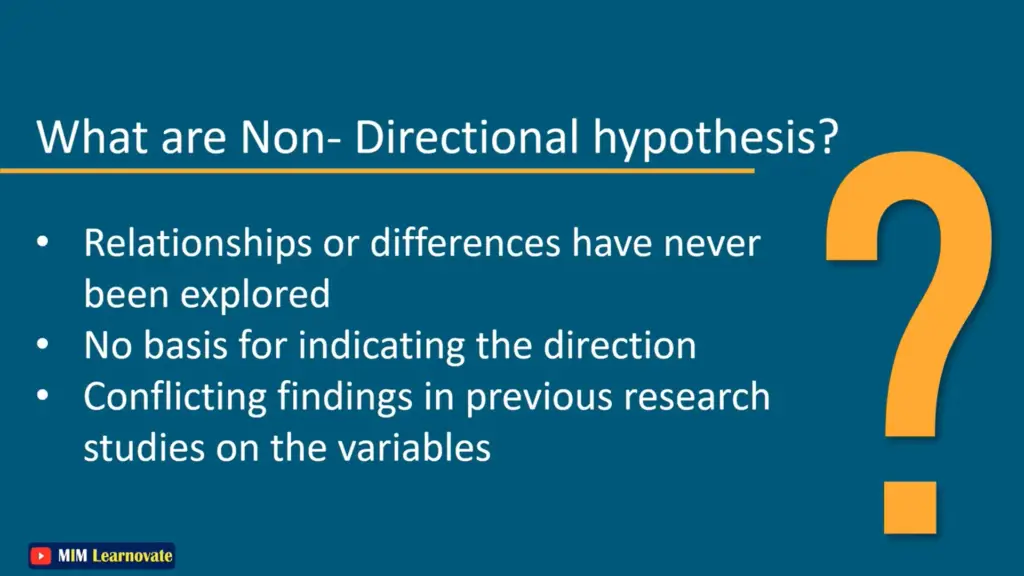
Definition of non-directional hypothesis
Non-directional hypotheses, also known as two-tailed hypotheses, are statements in research that indicate the presence of a relationship or difference between variables without specifying the direction of the effect. Instead of making predictions about the specific direction of the relationship or difference, non-directional hypotheses simply state that there is an association or distinction between the variables of interest.
Non-directional hypotheses are often used when there is no prior theoretical basis or clear expectation about the direction of the relationship. They leave the possibility open for either a positive or negative relationship, or for both groups to differ in some way without specifying which group will perform better or worse.
Advantages and utility of non-directional hypothesis
Non-directional hypotheses in survey s offer several advantages and utilities, providing flexibility and comprehensive analysis of survey data. Here are some of the key advantages and utilities of using non-directional hypotheses in surveys:
- Exploration of Relationships : Non-directional hypotheses allow researchers to explore and examine relationships between variables without assuming a specific direction. This is particularly useful in surveys where the relationship between variables may not be well-known or there may be conflicting evidence regarding the direction of the effect.
- Flexibility in Question Design : With non-directional hypotheses, survey questions can be designed to measure the relationship between variables without being biased towards a particular outcome. This flexibility allows researchers to collect data and analyze the results more objectively.
- Open to Unexpected Findings : Non-directional hypotheses enable researchers to be open to unexpected or surprising findings in survey data. By not committing to a specific direction of the effect, researchers can identify and explore relationships that may not have been initially anticipated, leading to new insights and discoveries.
- Comprehensive Analysis : Non-directional hypotheses promote comprehensive analysis of survey data by considering the possibility of an effect in either direction. Researchers can assess the magnitude and significance of relationships without limiting their analysis to only one possible outcome.
- S tatistical Validity : Non-directional hypotheses in surveys allow for the use of two-tailed statistical tests, which provide a more conservative and robust assessment of significance. Two-tailed tests consider both positive and negative deviations from the null hypothesis, ensuring accurate and reliable statistical analysis of survey data.
- Exploratory Research : Non-directional hypotheses are particularly useful in exploratory research, where the goal is to gather initial insights and generate hypotheses. Surveys with non-directional hypotheses can help researchers explore various relationships and identify patterns that can guide further research or hypothesis development.
It is worth noting that the choice between directional and non-directional hypotheses in surveys depends on the research objectives, existing knowledge, and the specific variables being investigated. Researchers should carefully consider the advantages and limitations of each approach and select the one that aligns best with their research goals and survey design.
- Share with others
- Twitter Twitter Icon
- LinkedIn LinkedIn Icon
Related posts
How to implement nps surveys: a step-by-step guide, 15 best website survey questions to ask your visitors, how to write a good survey introduction, 7 best ai survey generators, multiple choice questions: types, examples & samples, how to make a gdpr compliant survey, get answers today.
- No credit card required
- No time limit on Free plan
You can modify this template in every possible way.
All templates work great on every device.
8.1.2 - Hypothesis Testing
A hypothesis test for a proportion is used when you are comparing one group to a known or hypothesized population proportion value. In other words, you have one sample with one categorical variable. The hypothesized value of the population proportion is symbolized by \(p_0\) because this is the value in the null hypothesis (\(H_0\)).
If \(np_0 \ge 10\) and \(n(1-p_0) \ge 10\) then the distribution of sample proportions is approximately normal and can be estimated using the normal distribution. That sampling distribution will have a mean of \(p_0\) and a standard deviation (i.e., standard error) of \(\sqrt{\frac{p_0 (1-p_0)}{n}}\)
Recall that the standard normal distribution is also known as the z distribution. Thus, this is known as a "single sample proportion z test" or "one sample proportion z test."
If \(np_0 < 10\) or \(n(1-p_0) < 10\) then the distribution of sample proportions follows a binomial distribution. We will not be conducting this test by hand in this course, however you will learn how this can be conducted using Minitab using the exact method.
8.1.2.1 - Normal Approximation Method Formulas
Here we will be using the five step hypothesis testing procedure to compare the proportion in one random sample to a specified population proportion using the normal approximation method.
In order to use the normal approximation method, the assumption is that both \(n p_0 \geq 10\) and \(n (1-p_0) \geq 10\). Recall that \(p_0\) is the population proportion in the null hypothesis.
Where \(p_0\) is the hypothesized population proportion that you are comparing your sample to.
When using the normal approximation method we will be using a z test statistic. The z test statistic tells us how far our sample proportion is from the hypothesized population proportion in standard error units. Note that this formula follows the basic structure of a test statistic that you learned in the last lesson:
\(test\;statistic=\dfrac{sample\;statistic-null\;parameter}{standard\;error}\)
\(\widehat{p}\) = sample proportion \(p_{0}\) = hypothesize population proportion \(n\) = sample size
Given that the null hypothesis is true, the p value is the probability that a randomly selected sample of n would have a sample proportion as different, or more different, than the one in our sample, in the direction of the alternative hypothesis. We can find the p value by mapping the test statistic from step 2 onto the z distribution.
Note that p-values are also symbolized by \(p\). Do not confuse this with the population proportion which shares the same symbol.
We can look up the \(p\)-value using Minitab by constructing the sampling distribution. Because we are using the normal approximation here, we have a \(z\) test statistic that we can map onto the \(z\) distribution. Recall, the z distribution is a normal distribution with a mean of 0 and standard deviation of 1. If we are conducting a one-tailed (i.e., right- or left-tailed) test, we look up the area of the sampling distribution that is beyond our test statistic. If we are conducting a two-tailed (i.e., non-directional) test there is one additional step: we need to multiple the area by two to take into account the possibility of being in the right or left tail.
We can decide between the null and alternative hypotheses by examining our p-value. If \(p \leq \alpha\) reject the null hypothesis. If \(p>\alpha\) fail to reject the null hypothesis. Unless stated otherwise, assume that \(\alpha=.05\).
When we reject the null hypothesis our results are said to be statistically significant.
Based on our decision in step 4, we will write a sentence or two concerning our decision in relation to the original research question.
8.1.2.1.1 - Video Example: Male Babies
8.1.2.1.2 - Example: Handedness
Research Question : Are more than 80% of American's right handed?
In a sample of 100 Americans, 87 were right handed.
\(np_0 = 100(0.80)=80\)
\(n(1-p_0) = 100 (1-0.80) = 20\)
Both \(np_0\) and \(n(1-p_0)\) are at least 10 so we can use the normal approximation method.
This is a right-tailed test because we want to know if the proportion is greater than 0.80.
\(H_{0}\colon p=0.80\) \(H_{a}\colon p>0.80\)
\(z=\dfrac{\widehat{p}- p_0 }{\sqrt{\frac{p_0 (1- p_0)}{n}}}\)
\(\widehat{p}=\dfrac{87}{100}=0.87\), \(p_{0}=0.80\), \(n=100\)
\(z= \dfrac{\widehat{p}- p_0 }{\sqrt{\frac{p_0 (1- p_0)}{n}}}= \dfrac{0.87-0.80}{\sqrt{\frac{0.80 (1-0.80)}{100}}}=1.75\)
Our \(z\) test statistic is 1.75.
This is a right-tailed test so we need to find the area to the right of the test statistic, \(z=1.75\), on the z distribution.
Using Minitab , we find the probability \(P(z\geq1.75)=0.0400592\) which may be rounded to \(p\; value=0.0401\).

\(p\leq .05\), therefore our decision is to reject the null hypothesis
Yes, there is statistical evidence to state that more than 80% of all Americans are right handed.
8.1.2.1.3 - Example: Ice Cream
Research Question : Is the percentage of Creamery customers who prefer chocolate ice cream over vanilla less than 80%?
In a sample of 50 customers 60% preferred chocolate over vanilla.
\(np_0 = 50(0.80) = 40\)
\(n(1-p_0)=50(1-0.80) = 10\)
Both \(np_0\) and \(n(1-p_0)\) are at least 10. We can use the normal approximation method.
This is a left-tailed test because we want to know if the proportion is less than 0.80.
\(H_{0}\colon p=0.80\) \(H_{a}\colon p<0.80\)
\(\widehat{p}=0.60\), \(p_{0}=0.80\), \(n=50\)
\(z= \dfrac{\widehat{p}- p_0 }{\sqrt{\frac{p_0 (1- p_0)}{n}}}= \dfrac{0.60-0.80}{\sqrt{\frac{0.80 (1-0.80)}{50}}}=-3.536\)
Our \(z\) test statistic is -3.536.
This is a left-tailed test so we need to find the area to the right of our test statistic, \(z=-3.536\).

From the Minitab output above, the p-value is 0.0002031
\(p \leq.05\), therefore our decision is to reject the null hypothesis.
Yes, there is evidence that the percentage of all Creamery customers who prefer chocolate ice cream over vanilla is less than 80%.
8.1.2.1.4 - Example: Overweight Citizens
According to the Center for Disease Control (CDC), the percent of adults 20 years of age and over in the United States who are overweight is 69.0% (see http://www.cdc.gov/nchs/fastats/obesity-overweight.htm ). One city’s council wants to know if the proportion of overweight citizens in their city is different from this known national proportion. They take a random sample of 150 adults 20 years of age or older in their city and find that 98 are classified as overweight. Let’s use the five step hypothesis testing procedure to determine if there is evidence that the proportion in this city is different from the known national proportion.
\(np_0 =150 (0.690)=103.5 \)
\(n (1-p_0) =150 (1-0.690)=46.5\)
Both \(n p_0\) and \(n (1-p_0)\) are at least 10, this assumption has been met.
Research question: Is this city’s proportion of overweight individuals different from 0.690?
This is a non-directional test because our question states that we are looking for a differences as opposed to a specific direction. This will be a two-tailed test.
\(H_{0}\colon p=0.690\) \(H_{a}\colon p\neq 0.690\)
\(\widehat{p}=\dfrac{98}{150}=.653\)
\( z =\dfrac{0.653- 0.690 }{\sqrt{\frac{0.690 (1- 0.690)}{150}}} = -0.980 \)
Our test statistic is \(z=-0.980\)
This is a non-directional (i.e., two-tailed) test, so we need to find the area under the z distribution that is more extreme than \(z=-0.980\).
In Minitab, we find the proportion of a normal curve beyond \(\pm0.980\):

\(p-value=0.163543+0.163543=0.327086\)
\(p>\alpha\), therefore we fail to reject the null hypothesis
There is not sufficient evidence to state that the proportion of citizens of this city who are overweight is different from the national proportion of 0.690.
8.1.2.2 - Minitab: Hypothesis Tests for One Proportion
A hypothesis test for one proportion can be conducted in Minitab. This can be done using raw data or summarized data.
- If you have a data file with every individual's observation, then you have raw data .
- If you do not have each individual observation, but rather have the sample size and number of successes in the sample, then you have summarized data.
The next two pages will show you how to use Minitab to conduct this analysis using either raw data or summarized data .
Note that the default method for constructing the sampling distribution in Minitab is to use the exact method. If \(np_0 \geq 10\) and \(n(1-p_0) \geq 10\) then you will need to change this to the normal approximation method. This must be done manually. Minitab will use the method that you select, it will not check assumptions for you!
8.1.2.2.1 - Minitab: 1 Proportion z Test, Raw Data
If you have data in a Minitab worksheet, then you have what we call "raw data." This is in contrast to "summarized data" which you'll see on the next page.
In order to use the normal approximation method both \(np_0 \geq 10\) and \(n(1-p_0) \geq 10\). Before we can conduct our hypothesis test we must check this assumption to determine if the normal approximation method or exact method should be used. This must be checked manually. Minitab will not check assumptions for you.
In the example below, we want to know if there is evidence that the proportion of students who are male is different from 0.50.
\(n=226\) and \(p_0=0.50\)
\(np_0 = 226(0.50)=113\) and \(n(1-p_0) = 226(1-0.50)=113\)
Both \(np_0 \geq 10\) and \(n(1-p_0) \geq 10\) so we can use the normal approximation method.
Minitab ® – Conducting a One Sample Proportion z Test: Raw Data
Research question: Is the proportion of students who are male different from 0.50?
- class_survey.mpx
- In Minitab, select Stat > Basic Statistics > 1 Proportion
- Select One or more samples, each in a column from the dropdown
- Double-click the variable Biological Sex to insert it into the box
- Check the box next to Perform hypothesis test and enter 0.50 in the Hypothesized proportion box
- Select Options
- Use the default Alternative hypothesis setting of Proportion ≠ hypothesized proportion value
- Use the default Confidence level of 95
- Select Normal approximation method
- Click OK and OK
The result should be the following output:
Event: Biological Sex = Male p: proportion where Biological Sex = Male Normal approximation is used for this analysis.
Summary of Results
We could summarize these results using the five-step hypothesis testing procedure:
\(np_0 = 226(0.50)=113\) and \(n(1-p_0) = 226(1-0.50)=113\) therefore the normal approximation method will be used.
\(H_0\colon p = 0.50\)
\(H_a\colon p \ne 0.50\)
From the Minitab output, \(z\) = -1.86
From the Minitab output, \(p\) = 0.0625
\(p > \alpha\), fail to reject the null hypothesis
There is NOT enough evidence that the proportion of all students in the population who are male is different from 0.50.
8.1.2.2.2 - Minitab: 1 Sample Proportion z test, Summary Data
Example: overweight.
The following example uses a scenario in which we want to know if the proportion of college women who think they are overweight is less than 40%. We collect data from a random sample of 129 college women and 37 said that they think they are overweight.
First, we should check assumptions to determine if the normal approximation method or exact method should be used:
\(np_0=129(0.40)=51.6\) and \(n(1-p_0)=129(1-0.40)=77.4\) both values are at least 10 so we can use the normal approximation method.
Minitab ® – Performing a One Proportion z Test with Summarized Data
To perform a one sample proportion z test with summarized data in Minitab:
- Select Summarized data from the dropdown
- For number of events, add 37 and for number of trials add 129.
- Check the box next to Perform hypothesis test and enter 0.40 in the Hypothesized proportion box
- Use the default Alternative hypothesis setting of Proportion < hypothesized proportion value
Event: Event proportion Normal approximation is used for this analysis.
\(H_0\colon p = 0.40\)
\(H_a\colon p < 0.40\)
From output, \(z\) = -2.62
From output, \(p\) = 0.004
\(p \leq \alpha\), reject the null hypothesis
There is evidence that the proportion of women in the population who think they are overweight is less than 40%.
8.1.2.2.2.1 - Minitab Example: Normal Approx. Method
Example: gym membership.
Research question: Are less than 50% of all individuals with a membership at one gym female?
A simple random sample of 60 individuals with a membership at one gym was collected. Each individual's biological sex was recorded. There were 24 females.
First we have to check the assumptions:
np = 60 (0.50) = 30
n(1-p) = 60(1-0.50) = 30
The assumptions are met to use the normal approximation method.
- For number of events, add 24 and for number of trials add 60.
\(np_0=60(0.50)=30\) and \(n(1-p_0)=60(1-0.50)=30\) both values are at least 10 so we can use the normal approximation method.
\(H_0\colon p = 0.50\)
\(H_a\colon p < 0.50\)
From output, \(z\) = -1.55
From output, \(p\) = 0.061
\(p \geq \alpha\), fail to reject the null hypothesis
There is not enough evidence to support the alternative that the proportion of women memberships at this gym is less than 50%.
Live revision! Join us for our free exam revision livestreams Watch now →
Reference Library
Collections
- See what's new
- All Resources
- Student Resources
- Assessment Resources
- Teaching Resources
- CPD Courses
- Livestreams
Study notes, videos, interactive activities and more!
Psychology news, insights and enrichment
Currated collections of free resources
Browse resources by topic
- All Psychology Resources
Resource Selections
Currated lists of resources
Non-Directional Hypothesis
A non-directional hypothesis is a two-tailed hypothesis that does not predict the direction of the difference or relationship (e.g. girls and boys are different in terms of helpfulness).
- Share on Facebook
- Share on Twitter
- Share by Email
Research Methods: MCQ Revision Test 1 for AQA A Level Psychology
Topic Videos
Example Answers for Research Methods: A Level Psychology, Paper 2, June 2018 (AQA)
Exam Support
Example Answer for Question 14 Paper 2: AS Psychology, June 2017 (AQA)
Model answer for question 11 paper 2: as psychology, june 2016 (aqa), a level psychology topic quiz - research methods.
Quizzes & Activities
Our subjects
- › Criminology
- › Economics
- › Geography
- › Health & Social Care
- › Psychology
- › Sociology
- › Teaching & learning resources
- › Student revision workshops
- › Online student courses
- › CPD for teachers
- › Livestreams
- › Teaching jobs
Boston House, 214 High Street, Boston Spa, West Yorkshire, LS23 6AD Tel: 01937 848885
- › Contact us
- › Terms of use
- › Privacy & cookies
© 2002-2024 Tutor2u Limited. Company Reg no: 04489574. VAT reg no 816865400.

Aims And Hypotheses, Directional And Non-Directional
March 7, 2021 - paper 2 psychology in context | research methods.
- Back to Paper 2 - Research Methods
In Psychology, hypotheses are predictions made by the researcher about the outcome of a study. The research can chose to make a specific prediction about what they feel will happen in their research (a directional hypothesis) or they can make a ‘general,’ ‘less specific’ prediction about the outcome of their research (a non-directional hypothesis). The type of prediction that a researcher makes is usually dependent on whether or not any previous research has also investigated their research aim.
Variables Recap:
The independent variable (IV) is the variable that psychologists manipulate/change to see if changing this variable has an effect on the depen dent variable (DV).
The dependent variable (DV) is the variable that the psychologists measures (to see if the IV has had an effect).
It is important that the only variable that is changed in research is the independent variable (IV), all other variables have to be kept constant across the control condition and the experimental conditions. Only then will researchers be able to observe the true effects of just the independent variable (IV) on the dependent variable (DV).
Research/Experimental Aim(S):

An aim is a clear and precise statement of the purpose of the study. It is a statement of why a research study is taking place. This should include what is being studied and what the study is trying to achieve. (e.g. “This study aims to investigate the effects of alcohol on reaction times”.
It is important that aims created in research are realistic and ethical.
Hypotheses:
This is a testable statement that predicts what the researcher expects to happen in their research. The research study itself is therefore a means of testing whether or not the hypothesis is supported by the findings. If the findings do support the hypothesis then the hypothesis can be retained (i.e., accepted), but if not, then it must be rejected.
Three Different Hypotheses:

We're not around right now. But you can send us an email and we'll get back to you, asap.
Start typing and press Enter to search
Cookie Policy - Terms and Conditions - Privacy Policy


Directional vs. Non-Directional Hypothesis in Research
In the world of research and statistical analysis, formulating hypotheses is a crucial step in the scientific process. Hypotheses guide researchers in making predictions and testing relationships between variables. When it comes to hypotheses, there are two main types: directional and non-directional.
In this blog post, we will explore the differences between Directional vs. Non-Directional Hypothesis in Research and their implications in research.
- Table of Contents
Directional Hypothesis
A directional hypothesis, also known as a one-tailed hypothesis, is formulated with a specific predicted direction of the relationship between variables. It indicates an expectation of the relationship being either positive or negative.

The directional hypothesis is often used when there is prior knowledge or theoretical reasoning supporting the predicted direction of the relationship. It allows researchers to make more specific predictions and draw conclusions based on the expected direction of the effect.
Example of Directional Hypothesis
For example, a directional hypothesis might state that “increased physical activity will lead to a decrease in body weight.” Here, the researcher expects a negative relationship between physical activity and body weight.
Advantages of Directional Hypothesis
- Specific predictions: Directional hypotheses provide a clear prediction of the expected relationship between variables, allowing for a focused investigation.
- Increased statistical power: By focusing on one direction of the relationship, researchers can allocate more statistical power to that specific direction, increasing the chances of detecting a significant effect if it exists.
Non-Directional Hypothesis
A non-directional hypothesis, also known as a two-tailed hypothesis, does not make a specific prediction about the direction of the relationship between variables. Instead, it states that there is a relationship, but without indicating whether it will be positive or negative.
Non-directional hypotheses are often used when there is insufficient prior knowledge or theoretical basis to predict the direction of the relationship. It allows for a more exploratory approach, where the researcher is open to discovering the nature of the relationship through data analysis .
Read More: Internal Validity vs External Validity | Examples
Example of Non-Directional Hypothesis
For example, a non-directional hypothesis might state that “there is a relationship between caffeine consumption and reaction time.” Here, the researcher expects a relationship between the variables but does not specify the direction.
Read More: Population vs Sample | Examples
Advantages of Non-Directional Hypothesis:
- Flexibility: Non-directional hypotheses provide flexibility in exploring relationships between variables without preconceived notions about the direction of the effect.
- Open to unexpected findings : By not specifying the direction, researchers remain open to unexpected results or alternative explanations that may emerge during the analysis.
Difference Between Directional and Non-Directional Hypotheses
Choosing Between Directional and Non-Directional Hypotheses: The choice between a directional and non-directional hypothesis depends on the research question, existing knowledge, and theoretical background. Here are a few considerations for selecting the appropriate type of hypothesis:

- Prior research: If previous studies have established a clear direction of the relationship, a directional hypothesis may be more appropriate.
- Theoretical reasoning: If there is a strong theoretical foundation supporting a specific direction, a directional hypothesis can provide a focused investigation.
- Exploratory nature: If the research question is exploratory or lacks prior knowledge, a non-directional hypothesis allows for a more open-ended investigation.
Read More: Reliability vs Validity | Examples
- Directional vs. Non-Directional Hypothesis
Formulating hypotheses is an essential step in the research process, guiding researchers in testing relationships between variables.
Directional hypotheses offer specific predictions about the expected direction of the relationship, whereas non-directional hypotheses allow for more exploratory investigations without preconceived notions of the direction.
The choice between these types of hypotheses depends on the research question, prior knowledge, and theoretical background.
By understanding the distinctions between directional and non-directional hypotheses, researchers can effectively formulate hypotheses that align with their research goals and contribute to the advancement of scientific knowledge.
Remember, hypotheses serve as a roadmap for research, and regardless of their type, they play a crucial role in scientific inquiry and the pursuit of knowledge.
Other articles
Please read through some of our other articles with examples and explanations if you’d like to learn more about research methodology.
Comparision
- Basic and Applied Research
- Cross-Sectional vs Longitudinal Studies
- Survey vs Questionnaire
- Open Ended vs Closed Ended Questions
- Experimental and Non-Experimental Research
- Inductive vs Deductive Approach
- Null and Alternative Hypothesis
- Reliability vs Validity
- Population vs Sample
- Conceptual Framework and Theoretical Framework
- Bibliography and Reference
- Stratified vs Cluster Sampling
- Sampling Error vs Sampling Bias
- Internal Validity vs External Validity
- Full-Scale, Laboratory-Scale and Pilot-Scale Studies
- Plagiarism and Paraphrasing
- Research Methodology Vs. Research Method
- Mediator and Moderator
- Type I vs Type II error
- Descriptive and Inferential Statistics
- Microsoft Excel and SPSS
- Parametric and Non-Parametric Test
- Independent vs. Dependent Variable – MIM Learnovate
- Research Article and Research Paper
- Proposition and Hypothesis
- Principal Component Analysis and Partial Least Squares
- Academic Research vs Industry Research
- Clinical Research vs Lab Research
- Research Lab and Hospital Lab
- Thesis Statement and Research Question
- Quantitative Researchers vs. Quantitative Traders
- Premise, Hypothesis and Supposition
- Survey Vs Experiment
- Hypothesis and Theory
- Independent vs. Dependent Variable
- APA vs. MLA
- Ghost Authorship vs. Gift Authorship
- Research Methods
- Quantitative Research
- Qualitative Research
- Case Study Research
- Survey Research
- Conclusive Research
- Descriptive Research
- Cross-Sectional Research
- Theoretical Framework
- Conceptual Framework
- Triangulation
- Grounded Theory
- Quasi-Experimental Design
- Mixed Method
- Correlational Research
- Randomized Controlled Trial
- Stratified Sampling
- Ethnography
- Ghost Authorship
- Secondary Data Collection
- Primary Data Collection
- Ex-Post-Facto
- Dissertation Topic
- Thesis Statement
- Research Proposal
- Research Questions
- Research Problem
- Research Gap
- Types of Research Gaps
- Operationalization of Variables
- Literature Review
- Research Hypothesis
- Questionnaire
- Reliability
- Measurement of Scale
- Sampling Techniques
- Acknowledgements
- PLS-SEM model
- Principal Components Analysis
- Multivariate Analysis
- Friedman Test
- Chi-Square Test (Χ²)
- Effect Size

Related Posts
Peer review | types of peer review, ethics in research: safeguarding integrity and credibility, advantages and disadvantages of snowball sampling, exploring qualitative researcher skills: what they are and how to develop them, difference between quota sampling and stratified sampling, how effective laboratory design impacts health, safety, and productivity, why is laboratory safety important in research, what is purposive sampling | examples, quota sampling in research, top ai tools for literature review , leave a reply cancel reply.
Save my name, email, and website in this browser for the next time I comment.
Directional Hypothesis: Definition and 10 Examples

A directional hypothesis refers to a type of hypothesis used in statistical testing that predicts a particular direction of the expected relationship between two variables.
In simpler terms, a directional hypothesis is an educated, specific guess about the direction of an outcome—whether an increase, decrease, or a proclaimed difference in variable sets.
For example, in a study investigating the effects of sleep deprivation on cognitive performance, a directional hypothesis might state that as sleep deprivation (Independent Variable) increases, cognitive performance (Dependent Variable) decreases (Killgore, 2010). Such a hypothesis offers a clear, directional relationship whereby a specific increase or decrease is anticipated.
Global warming provides another notable example of a directional hypothesis. A researcher might hypothesize that as carbon dioxide (CO2) levels increase, global temperatures also increase (Thompson, 2010). In this instance, the hypothesis clearly articulates an upward trend for both variables.
In any given circumstance, it’s imperative that a directional hypothesis is grounded on solid evidence. For instance, the CO2 and global temperature relationship is based on substantial scientific evidence, and not on a random guess or mere speculation (Florides & Christodoulides, 2009).
Directional vs Non-Directional vs Null Hypotheses
A directional hypothesis is generally contrasted to a non-directional hypothesis. Here’s how they compare:
- Directional hypothesis: A directional hypothesis provides a perspective of the expected relationship between variables, predicting the direction of that relationship (either positive, negative, or a specific difference).
- Non-directional hypothesis: A non-directional hypothesis denotes the possibility of a relationship between two variables ( the independent and dependent variables ), although this hypothesis does not venture a prediction as to the direction of this relationship (Ali & Bhaskar, 2016). For example, a non-directional hypothesis might state that there exists a relationship between a person’s diet (independent variable) and their mood (dependent variable), without indicating whether improvement in diet enhances mood positively or negatively. Overall, the choice between a directional or non-directional hypothesis depends on the known or anticipated link between the variables under consideration in research studies.
Another very important type of hypothesis that we need to know about is a null hypothesis :
- Null hypothesis : The null hypothesis stands as a universality—the hypothesis that there is no observed effect in the population under study, meaning there is no association between variables (or that the differences are down to chance). For instance, a null hypothesis could be constructed around the idea that changing diet (independent variable) has no discernible effect on a person’s mood (dependent variable) (Yan & Su, 2016). This proposition is the one that we aim to disprove in an experiment.
While directional and non-directional hypotheses involve some integrated expectations about the outcomes (either distinct direction or a vague relationship), a null hypothesis operates on the premise of negating such relationships or effects.
The null hypotheses is typically proposed to be negated or disproved by statistical tests, paving way for the acceptance of an alternate hypothesis (either directional or non-directional).
Directional Hypothesis Examples
1. exercise and heart health.
Research suggests that as regular physical exercise (independent variable) increases, the risk of heart disease (dependent variable) decreases (Jakicic, Davis, Rogers, King, Marcus, Helsel, Rickman, Wahed, Belle, 2016). In this example, a directional hypothesis anticipates that the more individuals maintain routine workouts, the lesser would be their odds of developing heart-related disorders. This assumption is based on the underlying fact that routine exercise can help reduce harmful cholesterol levels, regulate blood pressure, and bring about overall health benefits. Thus, a direction – a decrease in heart disease – is expected in relation with an increase in exercise.
2. Screen Time and Sleep Quality
Another classic instance of a directional hypothesis can be seen in the relationship between the independent variable, screen time (especially before bed), and the dependent variable, sleep quality. This hypothesis predicts that as screen time before bed increases, sleep quality decreases (Chang, Aeschbach, Duffy, Czeisler, 2015). The reasoning behind this hypothesis is the disruptive effect of artificial light (especially blue light from screens) on melatonin production, a hormone needed to regulate sleep. As individuals spend more time exposed to screens before bed, it is predictably hypothesized that their sleep quality worsens.
3. Job Satisfaction and Employee Turnover
A typical scenario in organizational behavior research posits that as job satisfaction (independent variable) increases, the rate of employee turnover (dependent variable) decreases (Cheng, Jiang, & Riley, 2017). This directional hypothesis emphasizes that an increased level of job satisfaction would lead to a reduced rate of employees leaving the company. The theoretical basis for this hypothesis is that satisfied employees often tend to be more committed to the organization and are less likely to seek employment elsewhere, thus reducing turnover rates.
4. Healthy Eating and Body Weight
Healthy eating, as the independent variable, is commonly thought to influence body weight, the dependent variable, in a positive way. For example, the hypothesis might state that as consumption of healthy foods increases, an individual’s body weight decreases (Framson, Kristal, Schenk, Littman, Zeliadt, & Benitez, 2009). This projection is based on the premise that healthier foods, such as fruits and vegetables, are generally lower in calories than junk food, assisting in weight management.
5. Sun Exposure and Skin Health
The association between sun exposure (independent variable) and skin health (dependent variable) allows for a definitive hypothesis declaring that as sun exposure increases, the risk of skin damage or skin cancer increases (Whiteman, Whiteman, & Green, 2001). The premise aligns with the understanding that overexposure to the sun’s ultraviolet rays can deteriorate skin health, leading to conditions like sunburn or, in extreme cases, skin cancer.
6. Study Hours and Academic Performance
A regularly assessed relationship in academia suggests that as the number of study hours (independent variable) rises, so too does academic performance (dependent variable) (Nonis, Hudson, Logan, Ford, 2013). The hypothesis proposes a positive correlation , with an increase in study time expected to contribute to enhanced academic outcomes.
7. Screen Time and Eye Strain
It’s commonly hypothesized that as screen time (independent variable) increases, the likelihood of experiencing eye strain (dependent variable) also increases (Sheppard & Wolffsohn, 2018). This is based on the idea that prolonged engagement with digital screens—computers, tablets, or mobile phones—can cause discomfort or fatigue in the eyes, attributing to symptoms of eye strain.
8. Physical Activity and Stress Levels
In the sphere of mental health, it’s often proposed that as physical activity (independent variable) increases, levels of stress (dependent variable) decrease (Stonerock, Hoffman, Smith, Blumenthal, 2015). Regular exercise is known to stimulate the production of endorphins, the body’s natural mood elevators, helping to alleviate stress.
9. Water Consumption and Kidney Health
A common health-related hypothesis might predict that as water consumption (independent variable) increases, the risk of kidney stones (dependent variable) decreases (Curhan, Willett, Knight, & Stampfer, 2004). Here, an increase in water intake is inferred to reduce the risk of kidney stones by diluting the substances that lead to stone formation.
10. Traffic Noise and Sleep Quality
In urban planning research, it’s often supposed that as traffic noise (independent variable) increases, sleep quality (dependent variable) decreases (Muzet, 2007). Increased noise levels, particularly during the night, can result in sleep disruptions, thus, leading to poor sleep quality.
11. Sugar Consumption and Dental Health
In the field of dental health, an example might be stating as one’s sugar consumption (independent variable) increases, dental health (dependent variable) decreases (Sheiham, & James, 2014). This stems from the fact that sugar is a major factor in tooth decay, and increased consumption of sugary foods or drinks leads to a decline in dental health due to the high likelihood of cavities.
See 15 More Examples of Hypotheses Here
A directional hypothesis plays a critical role in research, paving the way for specific predicted outcomes based on the relationship between two variables. These hypotheses clearly illuminate the expected direction—the increase or decrease—of an effect. From predicting the impacts of healthy eating on body weight to forecasting the influence of screen time on sleep quality, directional hypotheses allow for targeted and strategic examination of phenomena. In essence, directional hypotheses provide the crucial path for inquiry, shaping the trajectory of research studies and ultimately aiding in the generation of insightful, relevant findings.
Ali, S., & Bhaskar, S. (2016). Basic statistical tools in research and data analysis. Indian Journal of Anaesthesia, 60 (9), 662-669. doi: https://doi.org/10.4103%2F0019-5049.190623
Chang, A. M., Aeschbach, D., Duffy, J. F., & Czeisler, C. A. (2015). Evening use of light-emitting eReaders negatively affects sleep, circadian timing, and next-morning alertness. Proceeding of the National Academy of Sciences, 112 (4), 1232-1237. doi: https://doi.org/10.1073/pnas.1418490112
Cheng, G. H. L., Jiang, D., & Riley, J. H. (2017). Organizational commitment and intrinsic motivation of regular and contractual primary school teachers in China. New Psychology, 19 (3), 316-326. Doi: https://doi.org/10.4103%2F2249-4863.184631
Curhan, G. C., Willett, W. C., Knight, E. L., & Stampfer, M. J. (2004). Dietary factors and the risk of incident kidney stones in younger women: Nurses’ Health Study II. Archives of Internal Medicine, 164 (8), 885–891.
Florides, G. A., & Christodoulides, P. (2009). Global warming and carbon dioxide through sciences. Environment international , 35 (2), 390-401. doi: https://doi.org/10.1016/j.envint.2008.07.007
Framson, C., Kristal, A. R., Schenk, J. M., Littman, A. J., Zeliadt, S., & Benitez, D. (2009). Development and validation of the mindful eating questionnaire. Journal of the American Dietetic Association, 109 (8), 1439-1444. doi: https://doi.org/10.1016/j.jada.2009.05.006
Jakicic, J. M., Davis, K. K., Rogers, R. J., King, W. C., Marcus, M. D., Helsel, D., … & Belle, S. H. (2016). Effect of wearable technology combined with a lifestyle intervention on long-term weight loss: The IDEA randomized clinical trial. JAMA, 316 (11), 1161-1171.
Khan, S., & Iqbal, N. (2013). Study of the relationship between study habits and academic achievement of students: A case of SPSS model. Higher Education Studies, 3 (1), 14-26.
Killgore, W. D. (2010). Effects of sleep deprivation on cognition. Progress in brain research , 185 , 105-129. doi: https://doi.org/10.1016/B978-0-444-53702-7.00007-5
Marczinski, C. A., & Fillmore, M. T. (2014). Dissociative antagonistic effects of caffeine on alcohol-induced impairment of behavioral control. Experimental and Clinical Psychopharmacology, 22 (4), 298–311. doi: https://psycnet.apa.org/doi/10.1037/1064-1297.11.3.228
Muzet, A. (2007). Environmental Noise, Sleep and Health. Sleep Medicine Reviews, 11 (2), 135-142. doi: https://doi.org/10.1016/j.smrv.2006.09.001
Nonis, S. A., Hudson, G. I., Logan, L. B., & Ford, C. W. (2013). Influence of perceived control over time on college students’ stress and stress-related outcomes. Research in Higher Education, 54 (5), 536-552. doi: https://doi.org/10.1023/A:1018753706925
Sheiham, A., & James, W. P. (2014). A new understanding of the relationship between sugars, dental caries and fluoride use: implications for limits on sugars consumption. Public health nutrition, 17 (10), 2176-2184. Doi: https://doi.org/10.1017/S136898001400113X
Sheppard, A. L., & Wolffsohn, J. S. (2018). Digital eye strain: prevalence, measurement and amelioration. BMJ open ophthalmology , 3 (1), e000146. doi: http://dx.doi.org/10.1136/bmjophth-2018-000146
Stonerock, G. L., Hoffman, B. M., Smith, P. J., & Blumenthal, J. A. (2015). Exercise as Treatment for Anxiety: Systematic Review and Analysis. Annals of Behavioral Medicine, 49 (4), 542–556. doi: https://doi.org/10.1007/s12160-014-9685-9
Thompson, L. G. (2010). Climate change: The evidence and our options. The Behavior Analyst , 33 , 153-170. Doi: https://doi.org/10.1007/BF03392211
Whiteman, D. C., Whiteman, C. A., & Green, A. C. (2001). Childhood sun exposure as a risk factor for melanoma: a systematic review of epidemiologic studies. Cancer Causes & Control, 12 (1), 69-82. doi: https://doi.org/10.1023/A:1008980919928
Yan, X., & Su, X. (2009). Linear regression analysis: theory and computing . New Jersey: World Scientific.

Chris Drew (PhD)
Dr. Chris Drew is the founder of the Helpful Professor. He holds a PhD in education and has published over 20 articles in scholarly journals. He is the former editor of the Journal of Learning Development in Higher Education. [Image Descriptor: Photo of Chris]
- Chris Drew (PhD) https://helpfulprofessor.com/author/chris-drew-phd/ 5 Top Tips for Succeeding at University
- Chris Drew (PhD) https://helpfulprofessor.com/author/chris-drew-phd/ 50 Durable Goods Examples
- Chris Drew (PhD) https://helpfulprofessor.com/author/chris-drew-phd/ 100 Consumer Goods Examples
- Chris Drew (PhD) https://helpfulprofessor.com/author/chris-drew-phd/ 30 Globalization Pros and Cons
Leave a Comment Cancel Reply
Your email address will not be published. Required fields are marked *
Get science-backed answers as you write with Paperpal's Research feature
How to Write a Hypothesis? Types and Examples

All research studies involve the use of the scientific method, which is a mathematical and experimental technique used to conduct experiments by developing and testing a hypothesis or a prediction about an outcome. Simply put, a hypothesis is a suggested solution to a problem. It includes elements that are expressed in terms of relationships with each other to explain a condition or an assumption that hasn’t been verified using facts. 1 The typical steps in a scientific method include developing such a hypothesis, testing it through various methods, and then modifying it based on the outcomes of the experiments.
A research hypothesis can be defined as a specific, testable prediction about the anticipated results of a study. 2 Hypotheses help guide the research process and supplement the aim of the study. After several rounds of testing, hypotheses can help develop scientific theories. 3 Hypotheses are often written as if-then statements.
Here are two hypothesis examples:
Dandelions growing in nitrogen-rich soils for two weeks develop larger leaves than those in nitrogen-poor soils because nitrogen stimulates vegetative growth. 4
If a company offers flexible work hours, then their employees will be happier at work. 5
Table of Contents
- What is a hypothesis?
- Types of hypotheses
- Characteristics of a hypothesis
- Functions of a hypothesis
- How to write a hypothesis
- Hypothesis examples
- Frequently asked questions
What is a hypothesis?

A hypothesis expresses an expected relationship between variables in a study and is developed before conducting any research. Hypotheses are not opinions but rather are expected relationships based on facts and observations. They help support scientific research and expand existing knowledge. An incorrectly formulated hypothesis can affect the entire experiment leading to errors in the results so it’s important to know how to formulate a hypothesis and develop it carefully.
A few sources of a hypothesis include observations from prior studies, current research and experiences, competitors, scientific theories, and general conditions that can influence people. Figure 1 depicts the different steps in a research design and shows where exactly in the process a hypothesis is developed. 4
There are seven different types of hypotheses—simple, complex, directional, nondirectional, associative and causal, null, and alternative.
Types of hypotheses
The seven types of hypotheses are listed below: 5 , 6,7
- Simple : Predicts the relationship between a single dependent variable and a single independent variable.
Example: Exercising in the morning every day will increase your productivity.
- Complex : Predicts the relationship between two or more variables.
Example: Spending three hours or more on social media daily will negatively affect children’s mental health and productivity, more than that of adults.
- Directional : Specifies the expected direction to be followed and uses terms like increase, decrease, positive, negative, more, or less.
Example: The inclusion of intervention X decreases infant mortality compared to the original treatment.
- Non-directional : Does not predict the exact direction, nature, or magnitude of the relationship between two variables but rather states the existence of a relationship. This hypothesis may be used when there is no underlying theory or if findings contradict prior research.
Example: Cats and dogs differ in the amount of affection they express.
- Associative and causal : An associative hypothesis suggests an interdependency between variables, that is, how a change in one variable changes the other.
Example: There is a positive association between physical activity levels and overall health.
A causal hypothesis, on the other hand, expresses a cause-and-effect association between variables.
Example: Long-term alcohol use causes liver damage.
- Null : Claims that the original hypothesis is false by showing that there is no relationship between the variables.
Example: Sleep duration does not have any effect on productivity.
- Alternative : States the opposite of the null hypothesis, that is, a relationship exists between two variables.
Example: Sleep duration affects productivity.

Characteristics of a hypothesis
So, what makes a good hypothesis? Here are some important characteristics of a hypothesis. 8,9
- Testable : You must be able to test the hypothesis using scientific methods to either accept or reject the prediction.
- Falsifiable : It should be possible to collect data that reject rather than support the hypothesis.
- Logical : Hypotheses shouldn’t be a random guess but rather should be based on previous theories, observations, prior research, and logical reasoning.
- Positive : The hypothesis statement about the existence of an association should be positive, that is, it should not suggest that an association does not exist. Therefore, the language used and knowing how to phrase a hypothesis is very important.
- Clear and accurate : The language used should be easily comprehensible and use correct terminology.
- Relevant : The hypothesis should be relevant and specific to the research question.
- Structure : Should include all the elements that make a good hypothesis: variables, relationship, and outcome.
Functions of a hypothesis
The following list mentions some important functions of a hypothesis: 1
- Maintains the direction and progress of the research.
- Expresses the important assumptions underlying the proposition in a single statement.
- Establishes a suitable context for researchers to begin their investigation and for readers who are referring to the final report.
- Provides an explanation for the occurrence of a specific phenomenon.
- Ensures selection of appropriate and accurate facts necessary and relevant to the research subject.
To summarize, a hypothesis provides the conceptual elements that complete the known data, conceptual relationships that systematize unordered elements, and conceptual meanings and interpretations that explain the unknown phenomena. 1

How to write a hypothesis
Listed below are the main steps explaining how to write a hypothesis. 2,4,5
- Make an observation and identify variables : Observe the subject in question and try to recognize a pattern or a relationship between the variables involved. This step provides essential background information to begin your research.
For example, if you notice that an office’s vending machine frequently runs out of a specific snack, you may predict that more people in the office choose that snack over another.
- Identify the main research question : After identifying a subject and recognizing a pattern, the next step is to ask a question that your hypothesis will answer.
For example, after observing employees’ break times at work, you could ask “why do more employees take breaks in the morning rather than in the afternoon?”
- Conduct some preliminary research to ensure originality and novelty : Your initial answer, which is your hypothesis, to the question is based on some pre-existing information about the subject. However, to ensure that your hypothesis has not been asked before or that it has been asked but rejected by other researchers you would need to gather additional information.
For example, based on your observations you might state a hypothesis that employees work more efficiently when the air conditioning in the office is set at a lower temperature. However, during your preliminary research you find that this hypothesis was proven incorrect by a prior study.
- Develop a general statement : After your preliminary research has confirmed the originality of your proposed answer, draft a general statement that includes all variables, subjects, and predicted outcome. The statement could be if/then or declarative.
- Finalize the hypothesis statement : Use the PICOT model, which clarifies how to word a hypothesis effectively, when finalizing the statement. This model lists the important components required to write a hypothesis.
P opulation: The specific group or individual who is the main subject of the research
I nterest: The main concern of the study/research question
C omparison: The main alternative group
O utcome: The expected results
T ime: Duration of the experiment
Once you’ve finalized your hypothesis statement you would need to conduct experiments to test whether the hypothesis is true or false.
Hypothesis examples
The following table provides examples of different types of hypotheses. 10 ,11

Key takeaways
Here’s a summary of all the key points discussed in this article about how to write a hypothesis.
- A hypothesis is an assumption about an association between variables made based on limited evidence, which should be tested.
- A hypothesis has four parts—the research question, independent variable, dependent variable, and the proposed relationship between the variables.
- The statement should be clear, concise, testable, logical, and falsifiable.
- There are seven types of hypotheses—simple, complex, directional, non-directional, associative and causal, null, and alternative.
- A hypothesis provides a focus and direction for the research to progress.
- A hypothesis plays an important role in the scientific method by helping to create an appropriate experimental design.
Frequently asked questions
Hypotheses and research questions have different objectives and structure. The following table lists some major differences between the two. 9
Here are a few examples to differentiate between a research question and hypothesis.
Yes, here’s a simple checklist to help you gauge the effectiveness of your hypothesis. 9 1. When writing a hypothesis statement, check if it: 2. Predicts the relationship between the stated variables and the expected outcome. 3. Uses simple and concise language and is not wordy. 4. Does not assume readers’ knowledge about the subject. 5. Has observable, falsifiable, and testable results.
As mentioned earlier in this article, a hypothesis is an assumption or prediction about an association between variables based on observations and simple evidence. These statements are usually generic. Research objectives, on the other hand, are more specific and dictated by hypotheses. The same hypothesis can be tested using different methods and the research objectives could be different in each case. For example, Louis Pasteur observed that food lasts longer at higher altitudes, reasoned that it could be because the air at higher altitudes is cleaner (with fewer or no germs), and tested the hypothesis by exposing food to air cleaned in the laboratory. 12 Thus, a hypothesis is predictive—if the reasoning is correct, X will lead to Y—and research objectives are developed to test these predictions.
Null hypothesis testing is a method to decide between two assumptions or predictions between variables (null and alternative hypotheses) in a statistical relationship in a sample. The null hypothesis, denoted as H 0 , claims that no relationship exists between variables in a population and any relationship in the sample reflects a sampling error or occurrence by chance. The alternative hypothesis, denoted as H 1 , claims that there is a relationship in the population. In every study, researchers need to decide whether the relationship in a sample occurred by chance or reflects a relationship in the population. This is done by hypothesis testing using the following steps: 13 1. Assume that the null hypothesis is true. 2. Determine how likely the sample relationship would be if the null hypothesis were true. This probability is called the p value. 3. If the sample relationship would be extremely unlikely, reject the null hypothesis and accept the alternative hypothesis. If the relationship would not be unlikely, accept the null hypothesis.

To summarize, researchers should know how to write a good hypothesis to ensure that their research progresses in the required direction. A hypothesis is a testable prediction about any behavior or relationship between variables, usually based on facts and observation, and states an expected outcome.
We hope this article has provided you with essential insight into the different types of hypotheses and their functions so that you can use them appropriately in your next research project.
References
- Dalen, DVV. The function of hypotheses in research. Proquest website. Accessed April 8, 2024. https://www.proquest.com/docview/1437933010?pq-origsite=gscholar&fromopenview=true&sourcetype=Scholarly%20Journals&imgSeq=1
- McLeod S. Research hypothesis in psychology: Types & examples. SimplyPsychology website. Updated December 13, 2023. Accessed April 9, 2024. https://www.simplypsychology.org/what-is-a-hypotheses.html
- Scientific method. Britannica website. Updated March 14, 2024. Accessed April 9, 2024. https://www.britannica.com/science/scientific-method
- The hypothesis in science writing. Accessed April 10, 2024. https://berks.psu.edu/sites/berks/files/campus/HypothesisHandout_Final.pdf
- How to develop a hypothesis (with elements, types, and examples). Indeed.com website. Updated February 3, 2023. Accessed April 10, 2024. https://www.indeed.com/career-advice/career-development/how-to-write-a-hypothesis
- Types of research hypotheses. Excelsior online writing lab. Accessed April 11, 2024. https://owl.excelsior.edu/research/research-hypotheses/types-of-research-hypotheses/
- What is a research hypothesis: how to write it, types, and examples. Researcher.life website. Published February 8, 2023. Accessed April 11, 2024. https://researcher.life/blog/article/how-to-write-a-research-hypothesis-definition-types-examples/
- Developing a hypothesis. Pressbooks website. Accessed April 12, 2024. https://opentext.wsu.edu/carriecuttler/chapter/developing-a-hypothesis/
- What is and how to write a good hypothesis in research. Elsevier author services website. Accessed April 12, 2024. https://scientific-publishing.webshop.elsevier.com/manuscript-preparation/what-how-write-good-hypothesis-research/
- How to write a great hypothesis. Verywellmind website. Updated March 12, 2023. Accessed April 13, 2024. https://www.verywellmind.com/what-is-a-hypothesis-2795239
- 15 Hypothesis examples. Helpfulprofessor.com Published September 8, 2023. Accessed March 14, 2024. https://helpfulprofessor.com/hypothesis-examples/
- Editage insights. What is the interconnectivity between research objectives and hypothesis? Published February 24, 2021. Accessed April 13, 2024. https://www.editage.com/insights/what-is-the-interconnectivity-between-research-objectives-and-hypothesis
- Understanding null hypothesis testing. BCCampus open publishing. Accessed April 16, 2024. https://opentextbc.ca/researchmethods/chapter/understanding-null-hypothesis-testing/#:~:text=In%20null%20hypothesis%20testing%2C%20this,said%20to%20be%20statistically%20significant
Paperpal is a comprehensive AI writing toolkit that helps students and researchers achieve 2x the writing in half the time. It leverages 21+ years of STM experience and insights from millions of research articles to provide in-depth academic writing, language editing, and submission readiness support to help you write better, faster.
Get accurate academic translations, rewriting support, grammar checks, vocabulary suggestions, and generative AI assistance that delivers human precision at machine speed. Try for free or upgrade to Paperpal Prime starting at US$19 a month to access premium features, including consistency, plagiarism, and 30+ submission readiness checks to help you succeed.
Experience the future of academic writing – Sign up to Paperpal and start writing for free!
Related Reads:
- Empirical Research: A Comprehensive Guide for Academics
- How to Write a Scientific Paper in 10 Steps
- What is a Literature Review? How to Write It (with Examples)
- What are Journal Guidelines on Using Generative AI Tools
Measuring Academic Success: Definition & Strategies for Excellence
What are scholarly sources and where can you find them , you may also like, 4 ways paperpal encourages responsible writing with ai, what are scholarly sources and where can you..., what is academic writing: tips for students, why traditional editorial process needs an upgrade, paperpal’s new ai research finder empowers authors to..., what is hedging in academic writing , how to use ai to enhance your college..., ai + human expertise – a paradigm shift..., how to use paperpal to generate emails &....
Non Directional Hypothesis

In the realm of hypothesis formulation, non-directional hypotheses offer a distinct perspective. These hypotheses suggest a relationship between variables without specifying the nature or direction of that relationship. This guide delves into non-directional hypothesis examples across various fields, outlines a step-by-step approach to crafting them, and provides expert tips to ensure your non-directional hypotheses are robust and insightful. Explore the world of Thesis statement hypotheses that explore connections without predetermined expectations.
What is the Non-Directional Hypothesis? – Definition
A non-directional hypothesis, also known as a two tailed hypothesis , is a type of hypothesis that predicts a relationship between variables without specifying the direction of that relationship. Unlike directional hypotheses that predict a specific outcome, non-directional hypotheses simply suggest that a relationship exists without indicating whether one variable will increase or decrease in response to changes in the other variable.
What is an Example of a Non-Directional Hypothesis Statement?

Size: 219 KB
“An increase in exercise frequency is associated with changes in weight.”
In this non-directional hypothesis, the statement suggests that a relationship exists between exercise frequency and weight changes but doesn’t specify whether increased exercise will lead to weight loss or weight gain. It leaves the direction of the relationship open for empirical investigation and data analysis.
100 Non Directional Hypothesis Statement Examples
Non-directional hypotheses explore relationships between variables without predicting the specific outcome. These simple hypothesis offer flexibility, allowing researchers to uncover unforeseen connections. Discover a range of non-directional hypothesis examples that span disciplines, enabling empirical exploration and evidence-based conclusions.
- Impact of Stress on Sleep Quality : Stress levels are related to changes in sleep quality among college students.
- Relationship Between Social Media Use and Loneliness : Social media use is associated with variations in reported feelings of loneliness.
- Connection Between Parenting Styles and Adolescent Self-Esteem : Different parenting styles correlate with differences in adolescent self-esteem levels.
- Effects of Temperature on Productivity : Temperature variations affect productivity levels in office environments.
- Link Between Screen Time and Eye Strain : Screen time is related to variations in reported eye strain among digital device users.
- Influence of Study Techniques on Exam Performance : Study techniques correlate with differences in exam performance among students.
- Relationship Between Classroom Environment and Student Engagement : Classroom environment is associated with variations in student engagement levels.
- Impact of Music Tempo on Heart Rate : Music tempo relates to changes in heart rate during exercise.
- Connection Between Diet and Cholesterol Levels : Dietary choices are related to variations in cholesterol levels among adults.
- Effects of Outdoor Exposure on Mood : Outdoor exposure is associated with changes in reported mood among urban dwellers.
- Relationship Between Personality Traits and Leadership Styles : Personality traits are associated with differences in preferred leadership styles among professionals.
- Impact of Time Management Strategies on Academic Performance : Time management strategies correlate with variations in academic performance among college students.
- Connection Between Cultural Exposure and Empathy Levels : Cultural exposure relates to changes in reported empathy levels among individuals.
- Effects of Nutrition Education on Dietary Choices : Nutrition education is associated with variations in dietary choices among adolescents.
- Link Between Social Support and Stress Levels : Social support is related to differences in reported stress levels among working adults.
- Influence of Exercise Intensity on Mood : Exercise intensity correlates with variations in reported mood among fitness enthusiasts.
- Relationship Between Parental Involvement and Academic Achievement : Parental involvement is associated with differences in academic achievement among schoolchildren.
- Impact of Sleep Duration on Cognitive Function : Sleep duration is related to changes in cognitive function among older adults.
- Connection Between Environmental Factors and Creativity : Environmental factors correlate with variations in reported creative thinking abilities among artists.
- Effects of Communication Styles on Conflict Resolution : Communication styles are associated with differences in conflict resolution outcomes among couples.
- Relationship Between Social Interaction and Life Satisfaction : Social interaction is related to variations in reported life satisfaction among elderly individuals.
- Impact of Classroom Seating Arrangements on Participation : Classroom seating arrangements correlate with differences in student participation levels.
- Connection Between Smartphone Use and Sleep Quality : Smartphone use is associated with changes in reported sleep quality among young adults.
- Effects of Mindfulness Practices on Stress Reduction : Mindfulness practices relate to variations in reported stress levels among participants.
- Link Between Gender and Communication Styles : Gender is related to differences in communication styles among individuals in group discussions.
- Influence of Advertising Exposure on Purchase Decisions : Advertising exposure correlates with variations in reported purchase decisions among consumers.
- Relationship Between Job Satisfaction and Employee Productivity : Job satisfaction is associated with differences in employee productivity levels.
- Impact of Social Support on Coping Mechanisms : Social support relates to variations in reported coping mechanisms among individuals facing challenges.
- Connection Between Classroom Environment and Student Creativity : Classroom environment is related to changes in student creativity levels.
- Effects of Exercise on Mood : Exercise is associated with variations in reported mood levels among participants.
- Relationship Between Music Preferences and Stress Levels : Music preferences are related to variations in reported stress levels among individuals.
- Impact of Nutrition Education on Food Choices : Nutrition education correlates with differences in dietary food choices among adolescents.
- Connection Between Physical Activity and Cognitive Function : Physical activity is associated with changes in cognitive function among older adults.
- Effects of Color Exposure on Mood : Color exposure relates to variations in reported mood levels among participants.
- Link Between Personality Traits and Career Choice : Personality traits are related to differences in career choices among individuals.
- Influence of Outdoor Recreation on Mental Well-being : Outdoor recreation is associated with variations in reported mental well-being among participants.
- Relationship Between Social Media Use and Self-Esteem : Social media use correlates with changes in reported self-esteem levels among young adults.
- Impact of Parenting Styles on Adolescent Risk Behavior : Parenting styles are related to variations in reported risk behaviors among adolescents.
- Connection Between Sleep Quality and Cognitive Performance : Sleep quality relates to changes in cognitive performance among students.
- Effects of Art Exposure on Creativity : Art exposure is associated with differences in reported creative thinking abilities among participants.
- Relationship Between Social Support and Mental Health : Social support is related to variations in reported mental health outcomes among individuals.
- Impact of Technology Use on Interpersonal Communication : Technology use correlates with differences in reported interpersonal communication skills among individuals.
- Connection Between Parental Attachment and Romantic Relationships : Parental attachment is associated with variations in the quality of romantic relationships among adults.
- Effects of Environmental Noise on Concentration : Environmental noise relates to changes in reported concentration levels among students.
- Link Between Music Exposure and Memory Performance : Music exposure is related to differences in memory performance among participants.
- Influence of Nutrition on Physical Fitness : Nutrition choices correlate with variations in reported physical fitness levels among athletes.
- Relationship Between Stress and Health Outcomes : Stress levels are associated with changes in reported health outcomes among individuals.
- Impact of Workplace Environment on Job Satisfaction : Workplace environment relates to differences in reported job satisfaction among employees.
- Connection Between Humor and Stress Reduction : Humor is related to variations in reported stress reduction among participants.
- Effects of Social Interaction on Emotional Well-being : Social interaction correlates with changes in reported emotional well-being among participants.
- Relationship Between Cultural Exposure and Cognitive Flexibility : Cultural exposure is related to variations in reported cognitive flexibility among individuals.
- Impact of Parent-Child Communication on Academic Achievement : Parent-child communication correlates with differences in academic achievement levels among students.
- Connection Between Personality Traits and Prosocial Behavior : Personality traits are associated with variations in reported prosocial behaviors among individuals.
- Effects of Nature Exposure on Stress Reduction : Nature exposure relates to changes in reported stress reduction among participants.
- Link Between Sleep Duration and Cognitive Performance : Sleep duration is related to differences in cognitive performance among participants.
- Influence of Social Media Use on Body Image : Social media use correlates with variations in reported body image satisfaction among young adults.
- Relationship Between Exercise and Mental Well-being : Exercise levels are associated with changes in reported mental well-being among participants.
- Impact of Cultural Competency Training on Patient Care : Cultural competency training relates to differences in patient care outcomes among healthcare professionals.
- Connection Between Perceived Social Support and Resilience : Perceived social support is related to variations in reported resilience levels among individuals.
- Effects of Environmental Factors on Mood : Environmental factors correlate with changes in reported mood levels among participants.
- Relationship Between Cultural Diversity and Team Performance : Cultural diversity is related to variations in reported team performance outcomes among professionals.
- Impact of Parental Involvement on Academic Motivation : Parental involvement correlates with differences in academic motivation levels among schoolchildren.
- Connection Between Mindfulness Practices and Anxiety Reduction : Mindfulness practices are associated with changes in reported anxiety levels among participants.
- Effects of Nutrition Education on Eating Habits : Nutrition education relates to variations in dietary eating habits among adolescents.
- Link Between Personality Traits and Learning Styles : Personality traits are related to differences in preferred learning styles among students.
- Influence of Nature Exposure on Creativity : Nature exposure correlates with variations in reported creative thinking abilities among individuals.
- Relationship Between Extracurricular Activities and Social Skills : Extracurricular activities are associated with changes in reported social skills among adolescents.
- Impact of Cultural Awareness Training on Stereotypes : Cultural awareness training relates to differences in perceived stereotypes among participants.
- Connection Between Sleep Quality and Emotional Regulation : Sleep quality is related to variations in reported emotional regulation skills among individuals.
- Effects of Music Exposure on Mood : Music exposure correlates with changes in reported mood levels among participants.
- Relationship Between Cultural Sensitivity and Cross-Cultural Communication : Cultural sensitivity is related to variations in reported cross-cultural communication skills among professionals.
- Impact of Parent-Child Bonding on Emotional Well-being : Parent-child bonding correlates with differences in reported emotional well-being levels among individuals.
- Connection Between Personality Traits and Conflict Resolution Styles : Personality traits are associated with variations in preferred conflict resolution styles among individuals.
- Effects of Mindfulness Practices on Focus and Concentration : Mindfulness practices relate to changes in reported focus and concentration levels among participants.
- Link Between Gender Identity and Career Aspirations : Gender identity is related to differences in reported career aspirations among individuals.
- Influence of Art Exposure on Emotional Expression : Art exposure correlates with variations in reported emotional expression abilities among participants.
- Relationship Between Peer Influence and Risky Behavior : Peer influence is associated with changes in reported engagement in risky behaviors among adolescents.
- Impact of Diversity Training on Workplace Harmony : Diversity training relates to differences in perceived workplace harmony among employees.
- Connection Between Sleep Patterns and Cognitive Performance : Sleep patterns are related to variations in cognitive performance among students.
- Effects of Exercise on Self-Esteem : Exercise correlates with changes in reported self-esteem levels among participants.
- Relationship Between Social Interaction and Well-being : Social interaction is related to variations in reported well-being levels among individuals.
- Impact of Parenting Styles on Adolescent Peer Relationships : Parenting styles correlate with differences in peer relationship quality among adolescents.
- Connection Between Personality Traits and Communication Effectiveness : Personality traits are associated with variations in communication effectiveness among professionals.
- Effects of Outdoor Activities on Stress Reduction : Outdoor activities relate to changes in reported stress reduction among participants.
- Link Between Music Exposure and Emotional Regulation : Music exposure is related to differences in reported emotional regulation skills among individuals.
- Influence of Family Dynamics on Academic Achievement : Family dynamics correlate with variations in academic achievement levels among students.
- Relationship Between Cultural Engagement and Empathy : Cultural engagement is associated with changes in reported empathy levels among individuals.
- Impact of Conflict Resolution Strategies on Relationship Satisfaction : Conflict resolution strategies relate to differences in reported relationship satisfaction levels among couples.
- Connection Between Sleep Quality and Physical Health : Sleep quality is related to variations in reported physical health outcomes among individuals.
- Effects of Social Support on Coping with Stress : Social support correlates with changes in reported coping strategies for stress among participants.
- Relationship Between Cultural Sensitivity and Patient Care : Cultural sensitivity is related to variations in reported patient care outcomes among healthcare professionals.
- Impact of Family Communication on Adolescent Well-being : Family communication correlates with differences in reported well-being levels among adolescents.
- Connection Between Personality Traits and Leadership Styles : Personality traits are associated with variations in preferred leadership styles among professionals.
- Effects of Nature Exposure on Attention Span : Nature exposure relates to changes in reported attention span among participants.
- Link Between Music Preference and Emotional Expression : Music preference is related to differences in reported emotional expression abilities among individuals.
- Influence of Peer Support on Academic Success : Peer support correlates with variations in reported academic success levels among students.
- Relationship Between Cultural Engagement and Creativity : Cultural engagement is associated with changes in reported creative thinking abilities among individuals.
- Impact of Conflict Resolution Skills on Relationship Satisfaction : Conflict resolution skills relate to differences in reported relationship satisfaction levels among couples.
- Connection Between Sleep Patterns and Stress Levels : Sleep patterns are related to variations in reported stress levels among individuals.
- Effects of Social Interaction on Happiness : Social interaction correlates with changes in reported happiness levels among participants.
Non-Directional Hypothesis Statement Examples for Psychology
These examples pertain to psychological studies and cover various relationships between psychological hypothesis concepts. For instance, the first example suggests that attachment styles might be related to romantic satisfaction, but it doesn’t specify whether attachment styles would increase or decrease satisfaction.
- Relationship Between Attachment Styles and Romantic Satisfaction : Attachment styles are related to variations in reported romantic satisfaction levels among individuals in psychology studies.
- Impact of Personality Traits on Career Success : Personality traits correlate with differences in reported career success outcomes among psychology study participants.
- Connection Between Parenting Styles and Adolescent Self-Esteem : Parenting styles are associated with variations in reported self-esteem levels among adolescents in psychological research.
- Effects of Social Media Use on Body Image : Social media use relates to changes in reported body image satisfaction among young adults in psychology experiments.
- Link Between Sleep Patterns and Emotional Well-being : Sleep patterns are related to differences in reported emotional well-being levels among psychology research participants.
- Influence of Mindfulness Practices on Stress Reduction : Mindfulness practices correlate with variations in reported stress reduction among psychology study participants.
- Relationship Between Social Interaction and Mental Health : Social interaction is associated with changes in reported mental health outcomes among individuals in psychology studies.
- Impact of Parent-Child Bonding on Emotional Resilience : Parent-child bonding relates to differences in reported emotional resilience levels among psychology research participants.
- Connection Between Cultural Sensitivity and Empathy : Cultural sensitivity is related to variations in reported empathy levels among individuals in psychology experiments.
- Effects of Exercise on Mood : Exercise correlates with changes in reported mood levels among psychology study participants.
Non-Directional Hypothesis Statement Examples in Research
These research hypothesis examples focus on research studies in general, covering a wide range of topics and relationships. For instance, the second example suggests that employee training might be related to workplace productivity, without indicating whether the training would lead to higher or lower productivity.
- Relationship Between Time Management and Academic Performance : Time management is related to variations in academic performance levels among research participants.
- Impact of Employee Training on Workplace Productivity : Employee training correlates with differences in reported workplace productivity outcomes among research subjects.
- Connection Between Media Exposure and Political Knowledge : Media exposure is associated with variations in reported political knowledge levels among research participants.
- Effects of Environmental Factors on Children’s Cognitive Development : Environmental factors relate to changes in reported cognitive development among research subjects.
- Link Between Parental Involvement and Student Motivation : Parental involvement is related to differences in reported student motivation levels among research participants.
- Influence of Cultural Immersion on Language Proficiency : Cultural immersion correlates with variations in reported language proficiency levels among research subjects.
- Relationship Between Leadership Styles and Team Performance : Leadership styles are associated with changes in reported team performance outcomes among research participants.
- Impact of Financial Literacy Education on Savings Habits : Financial literacy education relates to differences in reported savings habits among research subjects.
- Connection Between Stress Levels and Physical Health : Stress levels are related to variations in reported physical health outcomes among research participants.
- Effects of Music Exposure on Concentration : Music exposure correlates with changes in reported concentration levels among research subjects.
Non-Directional Hypothesis Statement Examples for Research Methodology
These examples are specific to the methods used in conducting research. The eighth example states that randomization might relate to group equivalence, but it doesn’t specify whether randomization would lead to more equivalent or less equivalent groups.
- Relationship Between Sampling Techniques and Research Validity : Sampling techniques are related to variations in research validity outcomes in studies of research methodology.
- Impact of Data Collection Methods on Data Accuracy : Data collection methods correlate with differences in reported data accuracy in research methodology experiments.
- Connection Between Research Design and Study Reproducibility : Research design is associated with variations in reported study reproducibility in research methodology studies.
- Effects of Questionnaire Format on Response Consistency : Questionnaire format relates to changes in reported response consistency in research methodology research.
- Link Between Ethical Considerations and Research Credibility : Ethical considerations are related to differences in reported research credibility in studies of research methodology.
- Influence of Measurement Scales on Data Precision : Measurement scales correlate with variations in reported data precision in research methodology experiments.
- Relationship Between Experimental Controls and Internal Validity : Experimental controls are associated with changes in internal validity outcomes in research methodology studies.
- Impact of Randomization on Group Equivalence : Randomization relates to differences in reported group equivalence in research methodology research.
- Connection Between Qualitative Data Analysis Methods and Data Richness : Qualitative data analysis methods are related to variations in reported data richness in studies of research methodology.
- Effects of Hypothesis Formulation on Research Focus : Hypothesis formulation correlates with changes in reported research focus in research methodology experiments.
These non-directional hypothesis statement examples offer insights into the diverse array of relationships explored in psychology, research, and research methodology studies, fostering empirical discovery and contributing to the advancement of knowledge across various fields.
Difference between Directional & Non-Directional Hypothesis
Directional and non-directional hypotheses are distinct approaches used in formulating hypotheses for research studies. Understanding the differences between them is essential for researchers to choose the appropriate type of causal hypothesis based on their study’s goals and prior knowledge.
- Direction: Directional hypotheses predict a specific relationship direction, while non-directional hypotheses do not specify a direction.
- Specificity: Directional hypotheses are more specific, while non-directional hypotheses are more general.
- Flexibility: Non-directional hypotheses allow for open-ended exploration, while directional hypotheses focus on confirming or refuting specific expectations.
How to Write a Non-Directional Hypothesis Statement – Step by Step Guide
- Identify Variables: Clearly define the variables you’re investigating—usually, an independent variable (the one manipulated) and a dependent variable (the one measured).
- Indicate Relationship: State that a relationship exists between the variables without predicting a specific direction.
- Use General Language: Craft the statement in a way that encompasses various possible outcomes.
- Avoid Biased Language: Do not include words that suggest a stronger effect or specific outcome for either variable.
- Connect to Research: If applicable, link the hypothesis to existing research or theories that justify exploring the relationship.
Tips for Writing a Non-Directional Hypothesis
- Start with Inquiry: Frame your hypothesis as an answer to a research question.
- Embrace Openness: Non-directional hypotheses are ideal when no strong expectation exists.
- Be Succinct: Keep the hypothesis statement concise and clear.
- Stay Neutral: Avoid implying that one variable will have a stronger impact.
- Allow Exploration: Leave room for various potential outcomes without preconceived notions.
- Tailor to Context: Ensure the hypothesis aligns with your research context and goals.
Non-directional hypotheses are particularly useful in exploratory research, where researchers aim to discover relationships without imposing specific expectations. They allow for unbiased investigation and the potential to uncover unexpected patterns or connections.
Remember that whether you choose a directional or non-directional hypothesis, both play critical roles in shaping the research process, guiding study design, data collection, and analysis. The choice depends on the research’s nature, goals, and existing knowledge in the field. You may also be interested in our science hypothesis .
AI Generator
Text prompt
- Instructive
- Professional
10 Examples of Public speaking
20 Examples of Gas lighting

Directional vs Non-Directional Hypothesis – Collect Feedback More Effectively
To conduct a perfect survey, you should know the basics of good research . That’s why in Startquestion we would like to share with you our knowledge about basic terms connected to online surveys and feedback gathering . Knowing the basis you can create surveys and conduct research in more effective ways and thanks to this get meaningful feedback from your customers, employees, and users. That’s enough for the introduction – let’s get to work. This time we will tell you about the hypothesis .
What is a Hypothesis?
A Hypothesis can be described as a theoretical statement built upon some evidence so that it can be tested as if it is true or false. In other words, a hypothesis is a speculation or an idea, based on insufficient evidence that allows it further analysis and experimentation.
The purpose of a hypothetical statement is to work like a prediction based on studied research and to provide some estimated results before it ha happens in a real position. There can be more than one hypothesis statement involved in a research study, where you need to question and explore different aspects of a proposed research topic. Before putting your research into directional vs non-directional hypotheses, let’s have some basic knowledge.
Most often, a hypothesis describes a relation between two or more variables. It includes:
An Independent variable – One that is controlled by the researcher
Dependent Variable – The variable that the researcher observes in association with the Independent variable.
Try one of the best survey tools for free!
Start trial period without any credit card or subscription. Easily conduct your research and gather feedback via link, social media, email, and more.
Create first survey
No credit card required · Cancel any time · GDRP Compilant
How to write an effective Hypothesis?
To write an effective hypothesis follow these essential steps.
- Inquire a Question
The very first step in writing an effective hypothesis is raising a question. Outline the research question very carefully keeping your research purpose in mind. Build it in a precise and targeted way. Here you must be clear about the research question vs hypothesis. A research question is the very beginning point of writing an effective hypothesis.
Do Literature Review
Once you are done with constructing your research question, you can start the literature review. A literature review is a collection of preliminary research studies done on the same or relevant topics. There is a diversified range of literature reviews. The most common ones are academic journals but it is not confined to that. It can be anything including your research, data collection, and observation.
At this point, you can build a conceptual framework. It can be defined as a visual representation of the estimated relationship between two variables subjected to research.
Frame an Answer
After a collection of literature reviews, you can find ways how to answer the question. Expect this stage as a point where you will be able to make a stand upon what you believe might have the exact outcome of your research. You must formulate this answer statement clearly and concisely.
Build a Hypothesis
At this point, you can firmly build your hypothesis. By now, you knew the answer to your question so make a hypothesis that includes:
- Applicable Variables
- Particular Group being Studied (Who/What)
- Probable Outcome of the Experiment
Remember, your hypothesis is a calculated assumption, it has to be constructed as a sentence, not a question. This is where research question vs hypothesis starts making sense.
Refine a Hypothesis
Make necessary amendments to the constructed hypothesis keeping in mind that it has to be targeted and provable. Moreover, you might encounter certain circumstances where you will be studying the difference between one or more groups. It can be correlational research. In such instances, you must have to testify the relationships that you believe you will find in the subject variables and through this research.
Build Null Hypothesis
Certain research studies require some statistical investigation to perform a data collection. Whenever applying any scientific method to construct a hypothesis, you must have adequate knowledge of the Null Hypothesis and an Alternative hypothesis.
Null Hypothesis:
A null Hypothesis denotes that there is no statistical relationship between the subject variables. It is applicable for a single group of variables or two groups of variables. A Null Hypothesis is denoted as an H0. This is the type of hypothesis that the researcher tries to invalidate. Some of the examples of null hypotheses are:
– Hyperactivity is not associated with eating sugar.
– All roses have an equal amount of petals.
– A person’s preference for a dress is not linked to its color.
Alternative Hypothesis:
An alternative hypothesis is a statement that is simply inverse or opposite of the null hypothesis and denoted as H1. Simply saying, it is an alternative statement for the null hypothesis. The same examples will go this way as an alternative hypothesis:
– Hyperactivity is associated with eating sugar.
– All roses do not have an equal amount of petals.
– A person’s preference for a dress is linked to its color.
Start your research right now: use professional survey templates
- Brand Awareness Survey
- Survey for the thesis
- Website Evaluation Survey
See more templates
Types of Hypothesis
Apart from null and alternative hypotheses, research hypotheses can be categorized into different types. Let’s have a look at them:
Simple Hypothesis:
This type of hypothesis is used to state a relationship between a particular independent variable and only a dependent variable.
Complex Hypothesis:
A statement that states the relationship between two or more independent variables and two or more dependent variables, is termed a complex hypothesis.
Associative and Causal Hypothesis:
This type of hypothesis involves predicting that there is a point of interdependency between two variables. It says that any kind of change in one variable will cause a change in the other one. Similarly, a casual hypothesis says that a change in the dependent variable is due to some variations in the independent variable.
Directional vs non-directional hypothesis
Directional hypothesis:.
A hypothesis that is built upon a certain directional relationship between two variables and constructed upon an already existing theory, is called a directional hypothesis. To understand more about what is directional hypothesis here is an example, Girls perform better than boys (‘better than’ shows the direction predicted)
Non-directional Hypothesis:
It involves an open-ended non-directional hypothesis that predicts that the independent variable will influence the dependent variable; however, the nature or direction of a relationship between two subject variables is not defined or clear.
For Example, there will be a difference in the performance of girls & boys (Not defining what kind of difference)
As a professional, we suggest you apply a non-directional alternative hypothesis when you are not sure of the direction of the relationship. Maybe you’re observing potential gender differences on some psychological test, but you don’t know whether men or women would have the higher ratio. Normally, this would say that you are lacking practical knowledge about the proposed variables. A directional test should be more common for tests.

Author: Ula Kamburov-Niepewna
Updated: 18 November 2022

12 Post Event Survey Questions to Ask
After your meticulously planned event concludes, there’s one crucial step left: gathering feedback. Post-event surveys are invaluable tools for understanding attendee experiences, identifying areas for improvement, and maintaining attendee satisfaction.

Yes or No Questions in Online Surveys
This article will discuss the benefits of using yes or no questions, explore common examples, and provide practical tips for using them effectively in your surveys.

How to Write Good Survey Questions
In this comprehensive guide, we will explore the impact of poorly designed survey questions, offer tips for crafting excellent and unbiased questionnaires, and provide examples of valid survey questions.

- school Campus Bookshelves
- menu_book Bookshelves
- perm_media Learning Objects
- login Login
- how_to_reg Request Instructor Account
- hub Instructor Commons
- Download Page (PDF)
- Download Full Book (PDF)
- Periodic Table
- Physics Constants
- Scientific Calculator
- Reference & Cite
- Tools expand_more
- Readability
selected template will load here
This action is not available.
7.5.1: Critical Values
- Last updated
- Save as PDF
- Page ID 22071

- Michelle Oja
- Taft College
Okay, this whole chapter is full of complex theoretical ideas. Critical values and null hypothesis significance testing is a TOUGH concept to get. Here's another description of critical values, p-values, and significance. Everyone learns differently, so hopefully this slightly different explanation will help understand the prior section.
We understand that we need a research hypothesis that predicts the relationship between two groups on an measured outcome (DV), and that each research hypothesis has a null hypothesis that says that there is no relationship between the two groups on the measured outcome (the means of the DV are similar). If we reject the null hypothesis (which says that the means are similar), we are saying that the means are different; this may or may not be in the direction that we predicted in the research hypothesis so we may or may not support the research hypothesis. If we retain (fail to reject) the null hypothesis, we are saying that the means are similar and then we cannot support the research hypothesis. Got it?
But how do we decide again to retain or reject the null hypothesis? We compare a calculated statistic (there are many, depending on your variables, that we'll cover for the rest of this textbook) to a critical value from a table. The table uses probability (p-values) to tell us what calculated values are so extreme to be absolutely unlikely.
Critical Regions and Critical Values
The critical region of any test corresponds to those values of the test statistic that would lead us to reject null hypothesis (which is why the critical region is also sometimes called the rejection region). How do we find this critical region? Well, let’s consider what we know:
- The test statistic should be very big or very small (extreme) in order to reject the null hypothesis.
- If α=.05 (α is "alpha," and is just another notation for probability; we'll talk about it more in the section on errors), the critical region must cover 5% of a Standard Normal Distribution.
It’s only important to make sure you understand this last point when you are dealing with non-directional hypotheses (which we will only do for Confidence Intervals). The critical region corresponds to those values of the test statistic for which we would reject the null hypothesis, and the Standard Normal Distribution describes the probability that we would obtain a particular value if the null hypothesis (that the means are similar) were actually true. Now, let’s suppose that we chose a critical region that covers 20% of the Standard Normal Distribution, and suppose that the null hypothesis is actually true. What would be the probability of incorrectly rejecting the null (saying that there is a difference between the means when there really isn't a difference)? The answer is 20%. And therefore, we would have built a test that had an α level of 0.2. If we want α=.05, the critical region only covers 5% of the Standard Normal Distribution.
Huh? Let's draw that out. Figure \(\PageIndex{1}\) shows the critical region associated with a non-directional hypothesis test (also called a "two-sided test" because the calculated value might be in either tail of the distribution). Figure \(\PageIndex{1}\) itself shows the sampling distribution of X (the scores we got). The grey bars correspond to those values for which we would retain the null hypothesis. The blue (dark) bars show the critical region: those values for which we would reject the null. In this example, the research hypothesis was non-directional, so the critical region covers both tails of the distribution. To ensure an α level of .05, we need to ensure that each of the two regions encompasses 2.5% of the sampling distribution.

Our critical region consists of the most extreme values , known as the tails of the distribution.
At this point, our hypothesis test is essentially complete: (1) we choose an α level (e.g., α=.05, (2) come up with some test statistic (more on this step later) that does a good job (in some meaningful sense) of comparing the null hypothesis to the research hypothesis, (3) calculate the critical region that produces an appropriate α level, and then (4) calculate the value of the test statistic for the real data and then compare it to the critical values to make our decision. If we reject the null hypothesis, we say that the test has produced a significant result.
A note on statistical “significance”
Like other occult techniques of divination, the statistical method has a private jargon deliberately contrived to obscure its methods from non-practitioners. – Attributed to G. O. Ashley*
A very brief digression is in order at this point, regarding the word “significant”. The concept of statistical significance is actually a very simple one, but has a very unfortunate name. If the data allow us to reject the null hypothesis, we say that “the result is statistically significant ”, which is often shortened to “the result is significant”. This terminology is rather old, and dates back to a time when “significant” just meant something like “indicated”, rather than its modern meaning, which is much closer to “important”. As a result, a lot of modern readers get very confused when they start learning statistics, because they think that a “significant result” must be an important one. It doesn’t mean that at all. All that “statistically significant” means is that the data allowed us to reject a null hypothesis. Whether or not the result is actually important in the real world is a very different question, and depends on all sorts of other things.
Directional and Non-Directional Hypotheses
There’s one more thing to point out about the hypothesis test that we’ve just constructed. In statistical language, this is an example of a non-directional hypothesis, also known as a two-sided test. It’s called this because the alternative hypothesis covers the area on both “sides” of the null hypothesis, and as a consequence the critical region of the test covers both tails of the sampling distribution (2.5% on either side if α=.05), as illustrated earlier in Figure \(\PageIndex{1}\).
However, that’s not the only possibility, and not the situation that we'll be using with our directional research hypotheses (the ones that predict which group will have a higher mean). A directional research hypothesis would only cover the possibility that p>.5, and as a consequence the null hypothesis now becomes p≤.5. When this happens, we have what’s called a one-sided test , and when this happens the critical region only covers one tail of the sampling distribution. This is illustrated in Figure \(\PageIndex{2}\). In this case, we would only reject the null hypothesis for large values of of our test statistic (values that are more extreme but only in one direction). As a consequence, the critical region only covers the upper tail of the sampling distribution; specifically the upper 5% of the distribution. Contrast this to the two-sided version earlier in Figure \(\PageIndex{1}\).

Clear as mud? Let's try one more way to describe how research hypotheses, null hypotheses, p-values, and null hypothesis significance testing work.
*The internet seems fairly convinced that Ashley said this, though I can’t for the life of me find anyone willing to give a source for the claim.
Contributors and Attributions
- Danielle Navarro ( University of New South Wales )
Dr. MO ( Taft College )
IMAGES
VIDEO
COMMENTS
The null hypothesis, positing no effect or relationship, is a foundational contrast to the research hypothesis in scientific inquiry. ... A non-directional hypothesis, also known as a two-tailed hypothesis, predicts that there is a difference or relationship between two variables but does not specify the direction of this relationship.
Null Hypothesis (H 0): The sample data occurs purely from chance. ... This is an example of a non-directional hypothesis because the alternative hypothesis contains the not equal "≠" sign. The professor believes that the studying technique will influence the mean exam score, but doesn't specify whether it will cause the mean score to ...
The null and alternative hypotheses offer competing answers to your research question. When the research question asks "Does the independent variable affect the dependent variable?": The null hypothesis ( H0) answers "No, there's no effect in the population.". The alternative hypothesis ( Ha) answers "Yes, there is an effect in the ...
The directional hypothesis can also state a negative correlation, e.g. the higher the number of face-book friends, the lower the life satisfaction score ". Non-directional hypothesis: A non-directional (or two tailed hypothesis) simply states that there will be a difference between the two groups/conditions but does not say which will be ...
However, a null hypothesis is neither directional nor non-directional. A null hypothesis is a prediction that there will be no change, relationship, or difference between two variables. The directional hypothesis or nondirectional hypothesis would then be considered alternative hypotheses to the null hypothesis.
A non-directional hypothesis simply predicts that there will be a difference, without predicting which direction it will go. For the BMI/activity example, a non-directional null hypothesis would be: H 0: B M I a c t i v e = B M I i n a c t i v e H0: BMI_{active} = BMI_{inactive} and the corresponding non-directional alternative hypothesis would be:
5.2 - Writing Hypotheses. The first step in conducting a hypothesis test is to write the hypothesis statements that are going to be tested. For each test you will have a null hypothesis ( H 0) and an alternative hypothesis ( H a ). When writing hypotheses there are three things that we need to know: (1) the parameter that we are testing (2) the ...
This null hypothesis can be written as: H0: X¯ = μ H 0: X ¯ = μ. For most of this textbook, the null hypothesis is that the means of the two groups are similar. Much later, the null hypothesis will be that there is no relationship between the two groups. Either way, remember that a null hypothesis is always saying that nothing is different.
Directional hypotheses, also known as one-tailed hypotheses, are statements in research that make specific predictions about the direction of a relationship or difference between variables. Unlike non-directional hypotheses, which simply state that there is a relationship or difference without specifying its direction, directional hypotheses ...
The actual test begins by considering two hypotheses.They are called the null hypothesis and the alternative hypothesis.These hypotheses contain opposing viewpoints. \(H_0\): The null hypothesis: It is a statement of no difference between the variables—they are not related. This can often be considered the status quo and as a result if you cannot accept the null it requires some action.
A non-directional hypothesis does not predict the exact direction or nature of the relationship between the two variables. A researcher would utilize this kind of hypothesis if it is not based on theory or when the new research findings contradict the previous research. ... A null hypothesis, denoted by H 0, posits a negative statement to ...
Type of Hypothesis Test: Two-tailed, non-directional: Right-tailed, directional: Left-tailed, directional: ... Given that the null hypothesis is true, the p value is the probability that a randomly selected sample of n would have a sample proportion as different, or more different, than the one in our sample, in the direction of the alternative ...
Non-Directional Hypothesis. A non-directional hypothesis is a two-tailed hypothesis that does not predict the direction of the difference or relationship (e.g. girls and boys are different in terms of helpfulness).
If the findings do support the hypothesis then the hypothesis can be retained (i.e., accepted), but if not, then it must be rejected. Three Different Hypotheses: (1) Directional Hypothesis: states that the IV will have an effect on the DV and what that effect will be (the direction of results). For example, eating smarties will significantly ...
On the other hand, hypotheses may not predict the exact direction and are used in the absence of a theory, or when findings contradict previous studies (non-directional hypothesis).4 In addition, hypotheses can 1) define interdependency between variables (associative hypothesis),4 2) propose an effect on the dependent variable from manipulation ...
A non-directional hypothesis, also known as a two-tailed hypothesis, does not make a specific prediction about the direction of the relationship between variables. Instead, it states that there is a relationship, but without indicating whether it will be positive or negative.
One-tailed hypothesis tests are also known as directional and one-sided tests because you can test for effects in only one direction. When you perform a one-tailed test, the entire significance level percentage goes into the extreme end of one tail of the distribution. In the examples below, I use an alpha of 5%.
Directional vs Non-Directional vs Null Hypotheses. A directional hypothesis is generally contrasted to a non-directional hypothesis.Here's how they compare: Directional hypothesis: A directional hypothesis provides a perspective of the expected relationship between variables, predicting the direction of that relationship (either positive, negative, or a specific difference).
There are seven types of hypotheses—simple, complex, directional, non-directional, associative and causal, null, and alternative. A hypothesis provides a focus and direction for the research to progress. A hypothesis plays an important role in the scientific method by helping to create an appropriate experimental design. Frequently asked ...
Thus, our alternative hypothesis is the mathematical way of stating our research question. If we expect our obtained sample mean to be above or below the null hypothesis value, which we call a directional hypothesis, then our alternative hypothesis takes the form: HA: μ > 7.47 or HA: μ < 7.47 H A: μ > 7.47 or H A: μ < 7.47.
A non-directional experimental hypothesis (also known as two-tailed) does not predict the direction of the change/difference (it is an 'open goal' i.e. anything could happen) A non-directional hypothesis is usually used when there is either no or little previous research which support a particular theory or outcome i.e. what the researcher ...
A non-directional hypothesis, also known as a two tailed hypothesis, is a type of hypothesis that predicts a relationship between variables without specifying the direction of that relationship. Unlike directional hypotheses that predict a specific outcome, non-directional hypotheses simply suggest that a relationship exists without indicating ...
A Null Hypothesis is denoted as an H0. This is the type of hypothesis that the researcher tries to invalidate. Some of the examples of null hypotheses are: - Hyperactivity is not associated with eating sugar. - All roses have an equal amount of petals. - A person's preference for a dress is not linked to its color.
The grey bars correspond to those values for which we would retain the null hypothesis. The blue (dark) bars show the critical region: those values for which we would reject the null. In this example, the research hypothesis was non-directional, so the critical region covers both tails of the distribution.
It involves looking for a significant change or alternative that could lead you to reject the null hypothesis. 3. Directional Hypothesis The directional hypothesis predicts the direction of the relationship between independent and dependent variables. They specify whether the effect will be positive or negative. 4. Non-directional Hypothesis ...