Graduate Careers Australia
Providing information to australian graduates for over forty years.


Postgraduate Research Experience Questionnaire overview
The Postgraduate Research Experience Questionnaire (PREQ) is intended to probe key elements of the university experience relevant to research graduates. In doing so, it obtains data on the quality of the higher education research environment for PhD and masters research students. Development of the PREQ followed the establishment of the CEQ , which is oriented towards coursework graduates.
The PREQ consists of attitudinal statements, each with a corresponding five-point scale ranging from ‘strongly disagree’ to ‘strongly agree’. Respondents are encouraged to indicate their agreement or disagreement with each item.
With the exception of the Overall Satisfaction Indicator (OSI), which is a single-item scale, each statement in the PREQ has at least two other accompanying items (not necessarily appearing in consecutive order). Together these constitute a ‘scale’ that measures an underlying construct. Unlike the equivalent questionnaire for coursework graduates (the CEQ), which allows institutions to select some optional scales, the PREQ always consists of the same set of questions. This is due to the small number of research graduates relative to coursework graduates and the need to maximise response to each scale in order to provide sufficient data for analysis.
Core scales examined by the Postgraduate Research Experience Questionnaire
PREQ Instrument
The PREQ is administered as part of a special AGS questionnaire, appearing alongside a version of the GDS. The PREQ version of the GDS includes a number of extra questions that are specific to research graduates.
MASTER_PREQ-email_April_12
Download this PDF to see the PREQ as it appears for research graduates alongside the GDS (known as the GDS + PREQ). It should be noted that only the left side of page 2 of this PDF is the PREQ.
Written comments about the research experience
Also accompanying the PREQ are two open-ended questions about what the graduate sees as the best aspects of their course and the aspects most in need of improvement. Responses to these questions are not currently analysed at a national level, though they generate signficant constructive feedback at the institutional level. Many institutions are using these responses to improve the university experience for their students.
One popular method of analysing these data is CEQuery, a software package that is specifically designed to analyse the written comments generated by the questions. To read more about CEQuery, click here .
- Undergraduate study
- Find a course
- Open days and visits
- New undergraduates
- Postgraduate study
- Find a programme
- Visits and open days
- New postgraduates
- International students
- Accommodation
- Schools & faculties
- Business & partnerships
- Current students
- Current staff
Academic Quality and Policy Office
- Academic Integrity
- Academic Student Support
- Assessment and Feedback
- Committees and Groups
- Degree Outcomes Statement
- Educational Partnerships
- Guidance for Doctoral Training Entities
- Guidance for PGR supervisors
- PGR examiners' guidance
- Regulations and code of practice for research degree programmes
- Programme and Unit Development and Approval
- Quality Framework
- Student Surveys
- Undergraduate Education
- Unit Evaluation
Related links
- Education and Student Success
- Bristol Institute For Learning and Teaching
- QAA Quality Code
Education and Student Success intranet
University home > Academic Quality and Policy Office > Postgraduate Education > Postgraduate Research Experience Survey
Postgraduate Research Experience Survey
Postgraduate research experience survey (pres).
The Postgraduate Research Experience Survey (PRES) is an annual survey offered by the Higher Education Academy (HEA). Launched in 2007, PRES is a sector-wide survey to gather insight from postgraduate research students about their learning and supervision experience. The survey involves many other UK higher education institutions, including some of the Russell Group.
Survey questions
The survey includes a core set of questions designed and developed by the HEA as well as opportunities for free text responses. It aims to highlight areas of strength and areas where the University could enhance the postgraduate research student experience. Students are asked to agree or disagree (on a scale of one to five) with statements, or indicate how often a learning style or behaviour is encouraged. The statements cover the following areas: supervision, resources, research culture, progress and assessment, responsibilities, research skills, professional development, opportunities and overall experience.
PRES runs in the spring term, exact dates are chosen by individual institutions within February - mid May, it must be open for a minimum of 3 weeks.
Students are emailed and invited to participate in the online survey, non-respondents will receive reminder emails and students may opt out of the survey at any time.
Response rates
For further information contact Paul Spencer in the Bristol Doctoral College: Education Services.
University of Bristol Beacon House Queens Road Bristol, BS8 1QU, UK Tel: +44 (0)117 928 9000 Contact us
Information for
- New students
Connect with us
Study at bristol.
- Students' Union
- Sport, exercise and health
- Find a researcher
- Faculty research
- Impact of our research
- Research quality and assessment
- Engaging with the public
About the University
- Maps and travel
- Tours and visits
- The University on film
- Explore the city of Bristol
- Board of Trustees
Support the University
- Alumni and friends
- Working at Bristol
- Job listings
A–Z of the University
- Terms and conditions
- Accessibility statements
- Privacy and cookie policy
- Modern Slavery statement
- © 2024 University of Bristol
York Graduate Research School

Postgraduate Research Experience Survey
We’re keen to make sure our postgraduate researchers have the best possible experience while at York. To do this, we need to know what you think works well and what we could do better.
We participate in the Postgraduate Research Experience Survey (PRES) every two years. This year’s PRES takes place between Monday 6 March and Friday 28 April 2023 . You’ll receive an email inviting you to take part. It’s your chance to tell us about your experience as a postgraduate researcher at York.
Look out for an email from a JISC address [email protected] asking you to complete the survey.
Your feedback is important
The Postgraduate Research Experience Survey is the only national survey of postgraduate research students and so is the only way for us to compare how we are doing with other institutions and to make changes that will improve your experience in the future.
The more PGRs that take part the better we can do that.
Please take part
The survey opens on Monday 6 March 2023 and it takes around 15 minutes to complete. Your feedback is confidential to the research team and all reporting will be anonymous.
PRES PGR Frequently Asked Questions
Related links
PRES information for staff
Postgraduate Research Experience Questionnaire: reliability and factor structure with Master's in Nursing graduates
Affiliation.
- 1 School of Nursing, Midwifery and Health Systems, University College Dublin, Ireland. [email protected]
- PMID: 18476947
- DOI: 10.1111/j.1365-2648.2008.04619.x
Aim: This paper is a report of a study to measure the psychometric properties of the Postgraduate Experience Questionnaire when used to evaluate the research experience of graduates who had completed Master's in Nursing programmes.
Background: Evidence of standards and outcomes of Master's in Nursing programmes is lacking, despite their continuing growth worldwide. The Postgraduate Research Experience Questionnaire was introduced to evaluate the research experience of graduates. The instrument is a multidimensional measure of graduate students' experiences of research and research supervision. Six constructs that comprise the research experience of graduates are measured: the supervision process, academic climate, goals and expectations, infrastructure, skill development and the dissertation examination process.
Method: A cross-sectional postal survey of graduates from coursework Master's in Nursing programmes in Ireland was undertaken in 2006. The response rate was 71%. Exploratory and confirmatory factor analysis were used to test construct validity, while internal consistency measures were used to test reliability.
Results: Factor analysis identified a six-factor solution, as hypothesized by the instrument's developers. According to oblique rotation and confirmatory factor analysis, the majority of scales that comprise the instrument were relatively robust. Internal consistency measures identified that the six scales were reliable.
Conclusion: The construct validity of Postgraduate Research Experience Questionnaire when psychometrically evaluated with coursework master's graduates differed slightly from the factor structure reported in the literature for the original scale. However, overall, adequate estimates of reliability and validity were found when the instrument was used to evaluate the research experience of graduates who complete a supervised dissertation as part of their degree.
Publication types
- Validation Study
- Cross-Sectional Studies
- Education, Nursing, Graduate / standards*
- Factor Analysis, Statistical
- Middle Aged
- Nursing Research / education*
- Psychometrics*
- Reproducibility of Results
- Surveys and Questionnaires / standards*
- OASIS login
- Curtin home
- Future students
- Research students
- Current students
- Career advisors and teachers
- Teaching & learning
- Scholarships
- Curtin Life
- More on studying
- Education and research
- Working at Curtin
- About research
- Research news
- Projects and expertise
- Institutes and centres
- Industry and partners
- Consulting services
- Research standards
- Postgraduate research
- Student Guild
- John Curtin Gallery
- Curtin Volunteers!
- Giving to Curtin
- Getting here
- Academic calendars
- Fees & charges
- Future Staff
- OASIS Login
- University Statistics
- Strategy, Performance & Market Analysis
- Project Management
- Planning & Quality
- Market & Institutional Research
- Curtin Organisational Units
- Unit and Teaching Surveys
- Graduate Outcomes Survey
- PREQ Scales
- Graduate Outcomes Survey - Longitudinal
- Curtin Graduate Outcomes Survey
- Student Experience Survey
- Curtin Staff Survey
- Conducting Surveys with Students and Staff
- Downloadable Reports
- BI Survey Download Instructions
- Terms and Conditions
- Useful Links

Postgraduate Research Experience Questionnaire (PREQ) Scales
The Postgraduate Research Experience Questionnaire (PREQ) consists of 28 items and comprises the following 7 scales:
- Supervision (6 items)
- Intellectual Climate (5 items)
- Skills Development (5 items)
- Infrastructure (5 items)
- Thesis Examination Process (3 items)
- Clarity of Goals and Expectations (3 items)
- Overall Satisfaction (1 item)
While there are optional scales in the Course Experience Questionnaire, the Postgraduate Research Experience Questionnaire must use all 7 scales to measure the quality of key aspects of research masters and doctorates.
Required 'Core' Scales
Supervision Scale Evaluates the accessibility and quality of research degree supervision. That means this measure whether the student received good guidance in their literature search. (6 items)
Intellectual Climate Scale Measures the learning community and conditions provided by the institution, and whether the graduate felt that their department had made efforts to integrate them into the academic community. (5 items)
Skill Development Scale Assesses the extent of generic analytical and communication skill development. Such skills include the ability to transfer knowledge, apply analytical techniques to new situations, solve problems, plan work, and communicate effectively in writing. (5 items)
Infrastructure Scale Asks the student about the quality of learning infrastructures such as space, and equipment and finance and whether resource requirements were met during their period of research. (5 items)
Thesis Examination Process Scale Evaluates whether the examination process was timely, fair and satisfactory, and how satisfied the student was with thesis examination. (3 items)
Clarity of Goals and Expectations Scale Measures the clarity of learning structure, requirements and standards, and whether supervisors and others frame learning with appropriate pedagogical structures and expectations. (3 items)
Overall Satisfaction Scale Asks the graduate to indicate their level of overall satisfaction with their completed research. Higher scores on this item indicate higher satisfaction levels. (1 item)
- About Curtin
- Telephone enquiries
- Emergency and security numbers
- Privacy statement
- Accessibility
Page last modified: 30 September 2021
University of St Andrews
Current postgraduates.
- Ask a question
« Back to Current Postgraduates
St Leonard's Postgraduate College
- Postgraduate degrees
- Community and events
- Advice and guidance
- Skills and training
Postgraduate Research Experience Survey (PRES)

Monday 6 February to Friday 10 March 2023
Win one of twelve £20 vouchers.
The University is taking part in this year's Postgraduate Research Experience Survey (PRES). It is a national survey conducted by institutions across the UK and globally. The questionnaire takes around 15 minutes to complete.
The Postgraduate Research Experience Survey gives Postgraduate Research students the chance to provide their thoughts about their studies. The results will help the University compare how we are doing with other institutions, to make changes that will improve what we do in future and to keep doing the things that you value.
How will PGR students take part?
The survey will open on Monday 6 February and close on Friday 10 March 2023. To take part in the survey, students will need to follow the individual link sent to them by email by ‘ Postgraduate Student Survey [email protected] ’, as the survey is administered by Jisc .
What does the survey cover?
The survey focuses on the students’ experiences of:
- Supervision
- Resources
- Research community and culture
- Progress and assessment
- Skills and professional development
- Support and Wellbeing
- Covid-19 pandemic
- Overall experience
What happens to the results?
Over one hundred universities and colleges take part in the UK and globally. This means that the University can compare the experience of our PGR students against similar postgraduates at other institutions to see if we are supporting your learning as we should. We use the findings to improve our courses and the learning experience for future students. To see some examples of changes made as a result of student feedback please visit You said, we did!
The survey responses are confidential to the team processing the results and no reporting outside of this team will identify any individual. Any results communicated to teaching staff will be anonymised.
If you have any questions regarding this survey, please contact: [email protected]
Academia.edu no longer supports Internet Explorer.
To browse Academia.edu and the wider internet faster and more securely, please take a few seconds to upgrade your browser .
Enter the email address you signed up with and we'll email you a reset link.
- We're Hiring!
- Help Center

Postgraduate Research Experience Questionnaire: reliability and factor structure with Master's in Nursing graduates

2008, Journal of advanced nursing
Related Papers
William Holzemer
Sustainability
Jaime Fuentes-Balderrama , Guillermo Manuel Chans
Abstract: This research aimed to adapt and validate a measuring scale of perceived research competencies among undergraduate students. Perceived research competencies of undergraduate learning can be measured with a new scale adapted from self-determination theory. We assessed the validity of this new measure applied to 307 participating undergraduates from Lima (Peru). The instrument’s survey items in the perceived competencies scale were first translated from English to Spanish and then adapted to focus on participation in research activities. We obtained evidence for (a) content validity (through item analysis), (b) internal structure with Mokken Scaling Analysis and structural equation modeling to examine the item–construct relationship, differential item functioning, and reliability, and (c) association with external variables. The items were found to function one-dimensionally, with strong item–construct relationships and no differential functioning (academic semester and general self-esteem groups). Theoretically consistent associations were found between study satisfaction and anxiety symptoms (controlling for gender, semester, and social support). We also discussed the theoretical implications and practices of this newly adapted measurement instrument.
Ernest Rakow
Adeola Temitope Aina
A critical analysis of the issues related to the validity and reliability of measurement instruments used in research based on the approach of Kimberlin & Winterstein (2008).
BMC Medical Education
Rebekah Jenkin
Background Research activities undertaken during University studies contribute to preparation of medical students for practice of evidence-based medicine. This study aimed to understand medical students’ experiences, perceived research skills development and satisfaction associated with completion of mandatory research projects. Methods An online survey was sent to five cohorts of students (n = 1375) from years 2017–2021 at the completion of their research projects. Univariate analysis was conducted to understand students’ perception of research skills development, followed by linear regression modeling to explore factors influencing satisfaction with their research project. Manifest content analysis employing a framework approach was used to analyse qualitative data from responses to open ended questions. Results Response rate was 42%, with 513 (89%) returned surveys being complete and included in analysis. Whilst 37% of students felt they had requisite research skills before under...
IJAEDU- International E-Journal of Advances in Education
Nowreen Yasmin
Paula Myatt
Higher Education
Kayle B De Waal
In D. Halliday & G. Clarke (Eds.), 2nd International Conference on Developments in Doctoral Education & Training: Conference Proceedings. Staffordshire, UK: UK Council for Graduate Education (UKCGE).
Nigel Palmer
Research degree completions are used as an indicator of performance, a measure of quality and a driver for funding. They could be said to be the benchmark for benchmarks in doctoral policy and practice internationally. But are degree completion statistics as reliable as they seem? Are they a valid indication of quality? In practice, ‘completions’ can be far from definitive and may be premised on any of a series of enrolment events in what could be regarded as a ‘completions process’. Degree completions by themselves are currently neither a valid nor a reliable indication of quality in doctoral degree programs. Problems with inter-method reliability confound degree completions as the basis for making reliable comparisons. Different approaches to measuring degree completion rates and times provide different answers to the same questions and provide an unequal basis for comparison. Even if these issues were resolved, problems with validity would still remain. The focus of this paper is primarily on questions around reliability, outlining an analysis of means for establishing reliable benchmarks for doctoral degree completion rates and times. Pathways to good practice in this area include greater transparency around the methods used and the use of a broader range of standard variables through which events in the completions process may be described and compared. The paper concludes with some perspectives on different measures for, and uses of, completion statistics for doctoral candidates, their use as indicators of quality and performance, and their ability to support comparisons both within and between educational systems.
Journal of Advanced Nursing
Michael Traynor
RELATED PAPERS
patrizia argenti
Journal of Agricultural …
Keshav Bhattarai
Journal of Surgical Oncology
Ming-Huei Cheng
Rachel Davidson
Magdalena Kuran
Andrea Bernardini
2015 Moratuwa Engineering Research Conference (MERCon)
Inoka Manthilake
Communications and Networking in Education
Matti Sinko
Peter Petros
Human Immunology
Amado Puentes
ALVIMBY BENTAR RAHMADTULLAH
Instalasi Listrik
Odontología Sanmarquina
Maria Ines Valera Lizarraga
Journal of Community Psychology
Doreen Stewart
British Journal of Pharmacology
ARNULFO MATUK
The Journal of Emergency Medicine
john cronan
Journal of Experimental Child Psychology
Nelson Cowan
zaid mohamad
Engenharia Agrícola
Carlos Eduardo Angeli Furlani
The Israel Medical Association journal : IMAJ
BCGBD CBGCV
Alexandria Hernandez542
Florin Timofte
IFIP Advances in Information and Communication Technology
Theodoropoulou Eleni
Joana Isabel de Brito Paulino
RELATED TOPICS
- We're Hiring!
- Help Center
- Find new research papers in:
- Health Sciences
- Earth Sciences
- Cognitive Science
- Mathematics
- Computer Science
- Academia ©2024
Postgraduate Research Experience Survey 2022
Advance HE's Postgraduate Research Experience Survey (PRES) is the largest of its kind in UK higher education. In 2022 nearly 14,000 postgraduate research students from 62 higher education institutions took part in PRES, which provides the opportunity for postgraduate research students to give feedback about their learning experience, supervision and research environment, informing activity to enhance their experience.
Some of the key findings from the 2022 survey are:
Overall satisfaction rises slightly from 79% to 80%, stemming the small but consistent fall over the past three years.
Satisfaction rates are higher and have increased in 2022 among non-uk nationals while satisfaction for uk domiciled postgraduate research students has fallen slightly. , postgraduate researchers with a declared disability experience significantly lower – and declining – levels of satisfaction. .
The 2022 Postgraduate Research Experience Survey report is available to all and can be downloaded below:

©Advance HE 2020. Company limited by guarantee registered in England and Wales no. 04931031 | Company limited by guarantee registered in Ireland no. 703150 | Registered charity, England and Wales 1101607 | Registered charity, Scotland SC043946 | VAT Registered number GB 152 1219 50. Registered UK Address: Advance HE, Innovation Way, York Science Park, Heslington, York, YO10 5BR, United Kingdom | Registered Ireland Address: Advance HE, First Floor, Penrose 1, Penrose Dock, Cork, T23 Kw81, Ireland.
Numbers, Facts and Trends Shaping Your World
Read our research on:
Full Topic List
Regions & Countries
- Publications
- Our Methods
- Short Reads
- Tools & Resources
Read Our Research On:
Writing Survey Questions
Perhaps the most important part of the survey process is the creation of questions that accurately measure the opinions, experiences and behaviors of the public. Accurate random sampling will be wasted if the information gathered is built on a shaky foundation of ambiguous or biased questions. Creating good measures involves both writing good questions and organizing them to form the questionnaire.
Questionnaire design is a multistage process that requires attention to many details at once. Designing the questionnaire is complicated because surveys can ask about topics in varying degrees of detail, questions can be asked in different ways, and questions asked earlier in a survey may influence how people respond to later questions. Researchers are also often interested in measuring change over time and therefore must be attentive to how opinions or behaviors have been measured in prior surveys.
Surveyors may conduct pilot tests or focus groups in the early stages of questionnaire development in order to better understand how people think about an issue or comprehend a question. Pretesting a survey is an essential step in the questionnaire design process to evaluate how people respond to the overall questionnaire and specific questions, especially when questions are being introduced for the first time.
For many years, surveyors approached questionnaire design as an art, but substantial research over the past forty years has demonstrated that there is a lot of science involved in crafting a good survey questionnaire. Here, we discuss the pitfalls and best practices of designing questionnaires.
Question development
There are several steps involved in developing a survey questionnaire. The first is identifying what topics will be covered in the survey. For Pew Research Center surveys, this involves thinking about what is happening in our nation and the world and what will be relevant to the public, policymakers and the media. We also track opinion on a variety of issues over time so we often ensure that we update these trends on a regular basis to better understand whether people’s opinions are changing.
At Pew Research Center, questionnaire development is a collaborative and iterative process where staff meet to discuss drafts of the questionnaire several times over the course of its development. We frequently test new survey questions ahead of time through qualitative research methods such as focus groups , cognitive interviews, pretesting (often using an online, opt-in sample ), or a combination of these approaches. Researchers use insights from this testing to refine questions before they are asked in a production survey, such as on the ATP.
Measuring change over time
Many surveyors want to track changes over time in people’s attitudes, opinions and behaviors. To measure change, questions are asked at two or more points in time. A cross-sectional design surveys different people in the same population at multiple points in time. A panel, such as the ATP, surveys the same people over time. However, it is common for the set of people in survey panels to change over time as new panelists are added and some prior panelists drop out. Many of the questions in Pew Research Center surveys have been asked in prior polls. Asking the same questions at different points in time allows us to report on changes in the overall views of the general public (or a subset of the public, such as registered voters, men or Black Americans), or what we call “trending the data”.
When measuring change over time, it is important to use the same question wording and to be sensitive to where the question is asked in the questionnaire to maintain a similar context as when the question was asked previously (see question wording and question order for further information). All of our survey reports include a topline questionnaire that provides the exact question wording and sequencing, along with results from the current survey and previous surveys in which we asked the question.
The Center’s transition from conducting U.S. surveys by live telephone interviewing to an online panel (around 2014 to 2020) complicated some opinion trends, but not others. Opinion trends that ask about sensitive topics (e.g., personal finances or attending religious services ) or that elicited volunteered answers (e.g., “neither” or “don’t know”) over the phone tended to show larger differences than other trends when shifting from phone polls to the online ATP. The Center adopted several strategies for coping with changes to data trends that may be related to this change in methodology. If there is evidence suggesting that a change in a trend stems from switching from phone to online measurement, Center reports flag that possibility for readers to try to head off confusion or erroneous conclusions.
Open- and closed-ended questions
One of the most significant decisions that can affect how people answer questions is whether the question is posed as an open-ended question, where respondents provide a response in their own words, or a closed-ended question, where they are asked to choose from a list of answer choices.
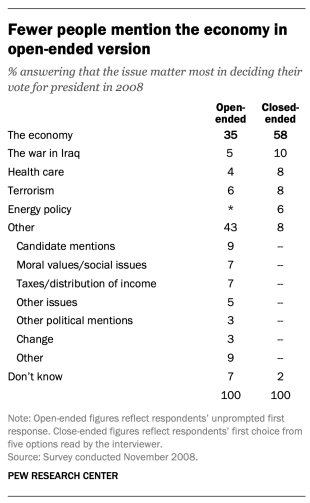
For example, in a poll conducted after the 2008 presidential election, people responded very differently to two versions of the question: “What one issue mattered most to you in deciding how you voted for president?” One was closed-ended and the other open-ended. In the closed-ended version, respondents were provided five options and could volunteer an option not on the list.
When explicitly offered the economy as a response, more than half of respondents (58%) chose this answer; only 35% of those who responded to the open-ended version volunteered the economy. Moreover, among those asked the closed-ended version, fewer than one-in-ten (8%) provided a response other than the five they were read. By contrast, fully 43% of those asked the open-ended version provided a response not listed in the closed-ended version of the question. All of the other issues were chosen at least slightly more often when explicitly offered in the closed-ended version than in the open-ended version. (Also see “High Marks for the Campaign, a High Bar for Obama” for more information.)
Researchers will sometimes conduct a pilot study using open-ended questions to discover which answers are most common. They will then develop closed-ended questions based off that pilot study that include the most common responses as answer choices. In this way, the questions may better reflect what the public is thinking, how they view a particular issue, or bring certain issues to light that the researchers may not have been aware of.
When asking closed-ended questions, the choice of options provided, how each option is described, the number of response options offered, and the order in which options are read can all influence how people respond. One example of the impact of how categories are defined can be found in a Pew Research Center poll conducted in January 2002. When half of the sample was asked whether it was “more important for President Bush to focus on domestic policy or foreign policy,” 52% chose domestic policy while only 34% said foreign policy. When the category “foreign policy” was narrowed to a specific aspect – “the war on terrorism” – far more people chose it; only 33% chose domestic policy while 52% chose the war on terrorism.
In most circumstances, the number of answer choices should be kept to a relatively small number – just four or perhaps five at most – especially in telephone surveys. Psychological research indicates that people have a hard time keeping more than this number of choices in mind at one time. When the question is asking about an objective fact and/or demographics, such as the religious affiliation of the respondent, more categories can be used. In fact, they are encouraged to ensure inclusivity. For example, Pew Research Center’s standard religion questions include more than 12 different categories, beginning with the most common affiliations (Protestant and Catholic). Most respondents have no trouble with this question because they can expect to see their religious group within that list in a self-administered survey.
In addition to the number and choice of response options offered, the order of answer categories can influence how people respond to closed-ended questions. Research suggests that in telephone surveys respondents more frequently choose items heard later in a list (a “recency effect”), and in self-administered surveys, they tend to choose items at the top of the list (a “primacy” effect).
Because of concerns about the effects of category order on responses to closed-ended questions, many sets of response options in Pew Research Center’s surveys are programmed to be randomized to ensure that the options are not asked in the same order for each respondent. Rotating or randomizing means that questions or items in a list are not asked in the same order to each respondent. Answers to questions are sometimes affected by questions that precede them. By presenting questions in a different order to each respondent, we ensure that each question gets asked in the same context as every other question the same number of times (e.g., first, last or any position in between). This does not eliminate the potential impact of previous questions on the current question, but it does ensure that this bias is spread randomly across all of the questions or items in the list. For instance, in the example discussed above about what issue mattered most in people’s vote, the order of the five issues in the closed-ended version of the question was randomized so that no one issue appeared early or late in the list for all respondents. Randomization of response items does not eliminate order effects, but it does ensure that this type of bias is spread randomly.
Questions with ordinal response categories – those with an underlying order (e.g., excellent, good, only fair, poor OR very favorable, mostly favorable, mostly unfavorable, very unfavorable) – are generally not randomized because the order of the categories conveys important information to help respondents answer the question. Generally, these types of scales should be presented in order so respondents can easily place their responses along the continuum, but the order can be reversed for some respondents. For example, in one of Pew Research Center’s questions about abortion, half of the sample is asked whether abortion should be “legal in all cases, legal in most cases, illegal in most cases, illegal in all cases,” while the other half of the sample is asked the same question with the response categories read in reverse order, starting with “illegal in all cases.” Again, reversing the order does not eliminate the recency effect but distributes it randomly across the population.
Question wording
The choice of words and phrases in a question is critical in expressing the meaning and intent of the question to the respondent and ensuring that all respondents interpret the question the same way. Even small wording differences can substantially affect the answers people provide.
[View more Methods 101 Videos ]
An example of a wording difference that had a significant impact on responses comes from a January 2003 Pew Research Center survey. When people were asked whether they would “favor or oppose taking military action in Iraq to end Saddam Hussein’s rule,” 68% said they favored military action while 25% said they opposed military action. However, when asked whether they would “favor or oppose taking military action in Iraq to end Saddam Hussein’s rule even if it meant that U.S. forces might suffer thousands of casualties, ” responses were dramatically different; only 43% said they favored military action, while 48% said they opposed it. The introduction of U.S. casualties altered the context of the question and influenced whether people favored or opposed military action in Iraq.
There has been a substantial amount of research to gauge the impact of different ways of asking questions and how to minimize differences in the way respondents interpret what is being asked. The issues related to question wording are more numerous than can be treated adequately in this short space, but below are a few of the important things to consider:
First, it is important to ask questions that are clear and specific and that each respondent will be able to answer. If a question is open-ended, it should be evident to respondents that they can answer in their own words and what type of response they should provide (an issue or problem, a month, number of days, etc.). Closed-ended questions should include all reasonable responses (i.e., the list of options is exhaustive) and the response categories should not overlap (i.e., response options should be mutually exclusive). Further, it is important to discern when it is best to use forced-choice close-ended questions (often denoted with a radio button in online surveys) versus “select-all-that-apply” lists (or check-all boxes). A 2019 Center study found that forced-choice questions tend to yield more accurate responses, especially for sensitive questions. Based on that research, the Center generally avoids using select-all-that-apply questions.
It is also important to ask only one question at a time. Questions that ask respondents to evaluate more than one concept (known as double-barreled questions) – such as “How much confidence do you have in President Obama to handle domestic and foreign policy?” – are difficult for respondents to answer and often lead to responses that are difficult to interpret. In this example, it would be more effective to ask two separate questions, one about domestic policy and another about foreign policy.
In general, questions that use simple and concrete language are more easily understood by respondents. It is especially important to consider the education level of the survey population when thinking about how easy it will be for respondents to interpret and answer a question. Double negatives (e.g., do you favor or oppose not allowing gays and lesbians to legally marry) or unfamiliar abbreviations or jargon (e.g., ANWR instead of Arctic National Wildlife Refuge) can result in respondent confusion and should be avoided.
Similarly, it is important to consider whether certain words may be viewed as biased or potentially offensive to some respondents, as well as the emotional reaction that some words may provoke. For example, in a 2005 Pew Research Center survey, 51% of respondents said they favored “making it legal for doctors to give terminally ill patients the means to end their lives,” but only 44% said they favored “making it legal for doctors to assist terminally ill patients in committing suicide.” Although both versions of the question are asking about the same thing, the reaction of respondents was different. In another example, respondents have reacted differently to questions using the word “welfare” as opposed to the more generic “assistance to the poor.” Several experiments have shown that there is much greater public support for expanding “assistance to the poor” than for expanding “welfare.”
We often write two versions of a question and ask half of the survey sample one version of the question and the other half the second version. Thus, we say we have two forms of the questionnaire. Respondents are assigned randomly to receive either form, so we can assume that the two groups of respondents are essentially identical. On questions where two versions are used, significant differences in the answers between the two forms tell us that the difference is a result of the way we worded the two versions.
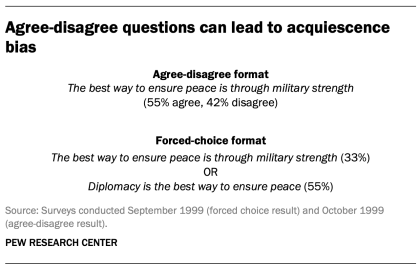
One of the most common formats used in survey questions is the “agree-disagree” format. In this type of question, respondents are asked whether they agree or disagree with a particular statement. Research has shown that, compared with the better educated and better informed, less educated and less informed respondents have a greater tendency to agree with such statements. This is sometimes called an “acquiescence bias” (since some kinds of respondents are more likely to acquiesce to the assertion than are others). This behavior is even more pronounced when there’s an interviewer present, rather than when the survey is self-administered. A better practice is to offer respondents a choice between alternative statements. A Pew Research Center experiment with one of its routinely asked values questions illustrates the difference that question format can make. Not only does the forced choice format yield a very different result overall from the agree-disagree format, but the pattern of answers between respondents with more or less formal education also tends to be very different.
One other challenge in developing questionnaires is what is called “social desirability bias.” People have a natural tendency to want to be accepted and liked, and this may lead people to provide inaccurate answers to questions that deal with sensitive subjects. Research has shown that respondents understate alcohol and drug use, tax evasion and racial bias. They also may overstate church attendance, charitable contributions and the likelihood that they will vote in an election. Researchers attempt to account for this potential bias in crafting questions about these topics. For instance, when Pew Research Center surveys ask about past voting behavior, it is important to note that circumstances may have prevented the respondent from voting: “In the 2012 presidential election between Barack Obama and Mitt Romney, did things come up that kept you from voting, or did you happen to vote?” The choice of response options can also make it easier for people to be honest. For example, a question about church attendance might include three of six response options that indicate infrequent attendance. Research has also shown that social desirability bias can be greater when an interviewer is present (e.g., telephone and face-to-face surveys) than when respondents complete the survey themselves (e.g., paper and web surveys).
Lastly, because slight modifications in question wording can affect responses, identical question wording should be used when the intention is to compare results to those from earlier surveys. Similarly, because question wording and responses can vary based on the mode used to survey respondents, researchers should carefully evaluate the likely effects on trend measurements if a different survey mode will be used to assess change in opinion over time.
Question order
Once the survey questions are developed, particular attention should be paid to how they are ordered in the questionnaire. Surveyors must be attentive to how questions early in a questionnaire may have unintended effects on how respondents answer subsequent questions. Researchers have demonstrated that the order in which questions are asked can influence how people respond; earlier questions can unintentionally provide context for the questions that follow (these effects are called “order effects”).
One kind of order effect can be seen in responses to open-ended questions. Pew Research Center surveys generally ask open-ended questions about national problems, opinions about leaders and similar topics near the beginning of the questionnaire. If closed-ended questions that relate to the topic are placed before the open-ended question, respondents are much more likely to mention concepts or considerations raised in those earlier questions when responding to the open-ended question.
For closed-ended opinion questions, there are two main types of order effects: contrast effects ( where the order results in greater differences in responses), and assimilation effects (where responses are more similar as a result of their order).

An example of a contrast effect can be seen in a Pew Research Center poll conducted in October 2003, a dozen years before same-sex marriage was legalized in the U.S. That poll found that people were more likely to favor allowing gays and lesbians to enter into legal agreements that give them the same rights as married couples when this question was asked after one about whether they favored or opposed allowing gays and lesbians to marry (45% favored legal agreements when asked after the marriage question, but 37% favored legal agreements without the immediate preceding context of a question about same-sex marriage). Responses to the question about same-sex marriage, meanwhile, were not significantly affected by its placement before or after the legal agreements question.

Another experiment embedded in a December 2008 Pew Research Center poll also resulted in a contrast effect. When people were asked “All in all, are you satisfied or dissatisfied with the way things are going in this country today?” immediately after having been asked “Do you approve or disapprove of the way George W. Bush is handling his job as president?”; 88% said they were dissatisfied, compared with only 78% without the context of the prior question.
Responses to presidential approval remained relatively unchanged whether national satisfaction was asked before or after it. A similar finding occurred in December 2004 when both satisfaction and presidential approval were much higher (57% were dissatisfied when Bush approval was asked first vs. 51% when general satisfaction was asked first).
Several studies also have shown that asking a more specific question before a more general question (e.g., asking about happiness with one’s marriage before asking about one’s overall happiness) can result in a contrast effect. Although some exceptions have been found, people tend to avoid redundancy by excluding the more specific question from the general rating.
Assimilation effects occur when responses to two questions are more consistent or closer together because of their placement in the questionnaire. We found an example of an assimilation effect in a Pew Research Center poll conducted in November 2008 when we asked whether Republican leaders should work with Obama or stand up to him on important issues and whether Democratic leaders should work with Republican leaders or stand up to them on important issues. People were more likely to say that Republican leaders should work with Obama when the question was preceded by the one asking what Democratic leaders should do in working with Republican leaders (81% vs. 66%). However, when people were first asked about Republican leaders working with Obama, fewer said that Democratic leaders should work with Republican leaders (71% vs. 82%).
The order questions are asked is of particular importance when tracking trends over time. As a result, care should be taken to ensure that the context is similar each time a question is asked. Modifying the context of the question could call into question any observed changes over time (see measuring change over time for more information).
A questionnaire, like a conversation, should be grouped by topic and unfold in a logical order. It is often helpful to begin the survey with simple questions that respondents will find interesting and engaging. Throughout the survey, an effort should be made to keep the survey interesting and not overburden respondents with several difficult questions right after one another. Demographic questions such as income, education or age should not be asked near the beginning of a survey unless they are needed to determine eligibility for the survey or for routing respondents through particular sections of the questionnaire. Even then, it is best to precede such items with more interesting and engaging questions. One virtue of survey panels like the ATP is that demographic questions usually only need to be asked once a year, not in each survey.
U.S. Surveys
Other research methods, sign up for our weekly newsletter.
Fresh data delivered Saturday mornings
1615 L St. NW, Suite 800 Washington, DC 20036 USA (+1) 202-419-4300 | Main (+1) 202-857-8562 | Fax (+1) 202-419-4372 | Media Inquiries
Research Topics
- Age & Generations
- Coronavirus (COVID-19)
- Economy & Work
- Family & Relationships
- Gender & LGBTQ
- Immigration & Migration
- International Affairs
- Internet & Technology
- Methodological Research
- News Habits & Media
- Non-U.S. Governments
- Other Topics
- Politics & Policy
- Race & Ethnicity
- Email Newsletters
ABOUT PEW RESEARCH CENTER Pew Research Center is a nonpartisan fact tank that informs the public about the issues, attitudes and trends shaping the world. It conducts public opinion polling, demographic research, media content analysis and other empirical social science research. Pew Research Center does not take policy positions. It is a subsidiary of The Pew Charitable Trusts .
Copyright 2024 Pew Research Center
Terms & Conditions
Privacy Policy
Cookie Settings
Reprints, Permissions & Use Policy
IMAGES
VIDEO
COMMENTS
The Postgraduate Research Experience Survey (PRES) enables you to gather information about the experience of any research student on a doctoral or research master's course. PRES has been developed in consultation with the sector and has been robustly tested across many disciplines, in several institutions and with students to ensure it ...
Postgraduate Research Experience Questionnaire (PREQ) This component of the Graduate Outcomes Survey (GOS), formerly the Australian Graduate Survey (AGS), collects information from students who recently graduated from their research masters or doctoral degree. Respondents are asked to express their degree of agreement or disagreement on ...
The 2023 Postgraduate Research Experience Survey report is available to all and can be downloaded below. For the first time, we have also created a summary report detailing the findings from Australian institutions. The report is also available below. Published On: 22/11/2023.
The questionnaire should take around fifteen minutes to complete. Where "programme" is used in the questionnaire, this refers to your whole programme of study at your institution, for example MRes in Sociology, PhD in Physics, etc. After each section you will be asked for any further comments on the topics covered, to enable staff to gain a ...
The Postgraduate Research Experience Questionnaire (PREQ) is intended to probe key elements of the university experience relevant to research graduates. In doing so, it obtains data on the quality of the higher education research environment for PhD and masters research students. Development of the PREQ followed the establishment of the CEQ ...
Welcome. This survey invites you to share your experiences of your postgraduate research degree programme. The survey should only take around 15 minutes to complete. Please know that your participation is greatly appreciated. Your feedback will be combined with those of others to help improve the experience of postgraduate researchers like you.
Title. Postgraduate Research Experience Questionnaire: reliability and factor structure with Master's in Nursing graduates. Aim. This paper is a report of a study to measure the psychometric properties of the Postgraduate Experience Questionnaire when used to evaluate the research experience of graduates who had completed Master's in Nursing programmes.
The Postgraduate Research Experience Survey (PRES) is an annual survey offered by the Higher Education Academy (HEA). Launched in 2007, PRES is a sector-wide survey to gather insight from postgraduate research students about their learning and supervision experience. The survey involves many other UK higher education institutions, including ...
This survey asks about your experiences of your postgraduate research programme. Your responses will be combined with those of others to help inform your institution about the experience of postgraduate researchers, helping to improve future support. The results are also used nationally to help advise policy and improve the postgraduate ...
We participate in the Postgraduate Research Experience Survey (PRES) every two years. This year's PRES takes place between Monday 6 March and Friday 28 April 2023. You'll receive an email inviting you to take part. It's your chance to tell us about your experience as a postgraduate researcher at York. Look out for an email from a JISC ...
The Postgraduate Research Experience Survey is a national survey of postgraduate research students conducted by institutions across the UK and globally. The survey takes around 15 minutes to complete. The Postgraduate Research Experience Survey is your chance to tell us your thoughts about your course. The results help us compare how we are ...
This survey invites you to share your experiences of your postgraduate research degree programme. The survey should only take around 15 minutes to complete. Please know that your participation is greatly appreciated. Your feedback will be combined with those of others to help improve the experience of postgraduate researchers like you.
The Postgraduate Research Experience Survey (PRES) 2021, is the largest survey of its kind, exploring the views of almost 40,000 postgraduate researchers from 94 institutions. Some of the findings include: Support for PGR mental health and wellbeing is clear priority for sector. Overall satisfaction remains high but falls slightly.
Aim: This paper is a report of a study to measure the psychometric properties of the Postgraduate Experience Questionnaire when used to evaluate the research experience of graduates who had completed Master's in Nursing programmes. Background: Evidence of standards and outcomes of Master's in Nursing programmes is lacking, despite their continuing growth worldwide.
PRES 2021. Find out more about the 2021 Postgraduate Research Experience Survey and the university's results. Click here to return to our Quality Assurance page.
The construct validity of Postgraduate Research Experience Questionnaire when psychometrically evaluated with coursework master's graduates differed slightly from the factor structure reported in the literature for the original scale, however, adequate estimates of reliability and validity were found. AIM This paper is a report of a study to measure the psychometric properties of the ...
The Postgraduate Research Experience Questionnaire (PREQ) consists of 28 items and comprises the following 7 scales: While there are optional scales in the Course Experience Questionnaire, the Postgraduate Research Experience Questionnaire must use all 7 scales to measure the quality of key aspects of research masters and doctorates.
The Postgraduate Research Experience Questionnaire was introduced to evaluate the research experience of graduates. The instrument is a multidimensional measure of graduate students' experiences ...
Survey, which includes the Postgraduate Research Experience Questionnaire (PREQ). The principal authors were Dr Daniel Edwards and Dr Hamish Coates (Australian Council for Educational Research (ACER)). They were assisted by Mr Bruce Guthrie (GCA) and Ms Ali Radloff (ACER). Graduate Careers Australia managed the PREQ, and worked with
Title. Postgraduate Research Experience Questionnaire: reliability and factor structure with Master's in Nursing graduates. Aim. This paper is a report of a study to measure the psychometric properties of the Postgraduate Experience Questionnaire when used to evaluate the research experience of graduates who had completed Master's in Nursing programmes.
Postgraduate Research Experience Survey (PRES) Monday 6 February to Friday 10 March 2023 Win one of twelve £20 vouchers! The University is taking part in this year's Postgraduate Research Experience Survey (PRES). It is a national survey conducted by institutions across the UK and globally. The questionnaire takes around 15 minutes to complete.
Postgraduate Research Experience Questionnaire The PREQ was introduced by the Australian Department of Employment, Education, Training and Youth Affairs against a background of increased attention on quality and accountability in the Australian higher education sector (ACER 2000).
Advance HE's Postgraduate Research Experience Survey (PRES) is the largest of its kind in UK higher education. In 2022 nearly 14,000 postgraduate research students from 62 higher education institutions took part in PRES, which provides the opportunity for postgraduate research students to give feedback about their learning experience, supervision and research environment, informing activity to ...
Writing Survey Questions. Perhaps the most important part of the survey process is the creation of questions that accurately measure the opinions, experiences and behaviors of the public. Accurate random sampling will be wasted if the information gathered is built on a shaky foundation of ambiguous or biased questions.