World Population: What Helps Explain the Explosion?
Key takeaways.
- Past discussion about world overpopulation centered on birth rates, but data for India and the U.S. show death rates also have a significant effect on population dynamics.
- A steep decline in India’s death rate starting in 1950 allowed population growth to remain steady despite a falling birth rate, substantially impacting global population.
- Death rates fell relatively more for an older segment of the population in the U.S. than in India, leading to a median age of 27 in India in 2019 versus 37 in the U.S.
The world population reached 1 billion in 1803. It took 125 years, until 1928, for the world population to hit 2 billion. A mere 32 years later, in 1960, the world population reached 3 billion. Current world population is now approaching 8 billion. These population statistics are from Our World in Data .
A 1968 book titled The Population Bomb famously sounded the alarm on global overpopulation. The book contended that overpopulation leads to “hellish” conditions. See Paul R. Ehrlich’s The Population Bomb , Ballantine Books, New York, 1968. In 1972, a Club of Rome report called The Limits to Growth predicted societal collapse as a consequence of overpopulation. See Donella H. Meadows, Dennis L. Meadows, Jorgen Randers and William W. Behrens III’s The Limits to Growth , Potomac Associates, Washington, D.C., 1972. Garrett Hardin, known for his article “The Tragedy of the Commons,” described population growth as disastrous. See Garrett Hardin’s December 1968 article, “ The Tragedy of the Commons ,” in the journal Science . In May 2008, then-President George W. Bush described the 2007-08 rise in world food prices as resulting from the size of India’s population. See the White House’s May 2008 press release “ President Bush Discusses Economy, Trade .”
The Population Bomb asserted that the U.S. must help low-income countries lower their high birth rates to solve the overpopulation problem. This was echoed by the World Bank’s 1984 World Development Report . It argued that low-income countries must decrease population growth, which “means to reduce the number of children in an average family.” See the World Bank’s 1984 World Development Report . During this period, the International Planned Parenthood Federation, the Population Council, the United Nations Population Fund and other organizations promoted and funded programs to reduce fertility in low-income countries. See Charles C. Mann's January 2018 article, “ The Book That Incited a Worldwide Fear of Overpopulation ,” in Smithsonian Magazine.

Population Growth Is Determined by Birth and Death Rates
This overpopulation discussion focused mostly on births. In this article, we investigate the role of deaths in population dynamics using data for India and the U.S. To understand the focus on birth rates in the discussion of population, it helps to know how births and deaths affect population over time.
Population growth rate—the annual rate at which population increases—offers a useful way to think about this relationship. It equals the birth rate (the number of births divided by the number of people) minus the death rate (the number of deaths divided by the number of people). This can be written as the following:
Population Growth Rate=Birth Rate – Death Rate
It is easy to see from the equation that, just as the 1984 World Development Report suggested, the population would grow less if the birth rate declined. As the following figure illustrates, the birth rate in India decreased from 44 per thousand people in 1950 to 32 per thousand people in 1990. (The birth rate in India declined further to 17 per thousand people by 2019, almost converging with the birth rate in the U.S., which was about 11 per thousand people.)
Crude Birth Rates in the U.S. and India, 1950-2019

SOURCE: United Nations, World Population Prospects 2022 .
NOTE: Crude birth rate is the number of live births per 1,000 people.
Despite the decline in birth rate, however, the population growth rate stayed the same, around 2.25%, from 1950 to 1990. So, why the discrepancy?
India’s population growth rate stayed the same despite the falling birth rate because of the dynamics of its death rate. The following figure illustrates the steep decline in death rates in India, from 22 deaths per thousand people in 1950 to 10.7 deaths per thousand people in 1990. India’s death rate fell further to 6.7 per thousand people in 2019 . Over this period, death rates in the U.S. decreased by only 1.3 deaths per thousand people—from 9.6 to 8.3. In 2019, the death rate in India was lower than that in the U.S. While the earlier overpopulation discussion emphasized the role of birth rates, it failed to account for how the decline in death rates affects population growth.
Crude Death Rates in the U.S. and India, 1950-2019

NOTE: Crude death rate is the number of deaths per 1,000 people.
The Decline in India’s Death Rate Substantially Impacted Current Global Population Levels
To assess the quantitative impact of the decline in death rates, we ran a counterfactual exercise and calculated what India’s population would have been if we held India’s death rate fixed at the 1950 level. That is, we calculated India’s population each year starting in 1950 using the year’s actual birth rate and the 1950 death rate instead of the year’s particular death rate.
The actual population in India increased from 360 million in 1950 to nearly 1.4 billion in 2019; whereas, in the counterfactual example, India’s population increased from 360 million to only 760 million in 2019. That’s a difference of about 640 million fewer people.
World population increased by 5.34 billion people from 1950 to 2019. India accounted for 20% of this increase. If India’s death rate over this period had remained the same as in 1950, the world population would have increased by only 4.7 billion, with just 8.5% attributable to India. That is, the world population also would have been smaller by 640 million people.
Death Rate Affects Age Composition
A decline in the death rate has implications for the age composition of the population, depending upon whether the decline occurred among younger or older age groups. For instance, if the decline in death rate is predominantly in the 0-4 age group, then the population will get relatively younger; if the decline is predominantly in the 70-74 age group, then the population will get relatively older.
In India, there were roughly 81 deaths per thousand people in 1950 in the 0-4 age group; this number declined more than 90% to fewer than seven deaths per thousand people in this age group in 2019. In contrast, the death rate in the 70-74 age group declined by less than 45%, from 79 per thousand people to 44 per thousand people. The median age in India in 2019 was 27; in absolute terms, the number of people 27 and younger in India was more than twice the entire population of the U.S.
In the U.S., the decline in the death rate in the 0-4 age group was about 84% during this period, but the decline in the 70-74 age group was about 58%. The relative decrease in death rates in the older age group was larger in the U.S. than in India. Consequently, the median age in the U.S. in 2019 was 37; two-thirds of India’s population in 2019 was below this age.
- These population statistics are from Our World in Data .
- See Paul R. Ehrlich’s The Population Bomb , Ballantine Books, New York, 1968.
- See Donella H. Meadows, Dennis L. Meadows, Jorgen Randers and William W. Behrens III’s The Limits to Growth , Potomac Associates, Washington, D.C., 1972.
- See Garrett Hardin’s December 1968 article, “ The Tragedy of the Commons ,” in the journal Science .
- See the White House’s May 2008 press release “ President Bush Discusses Economy, Trade .”
- See the World Bank’s 1984 World Development Report .
- See Charles C. Mann's January 2018 article, “ The Book That Incited a Worldwide Fear of Overpopulation ,” in Smithsonian Magazine.

B. Ravikumar is senior vice president and deputy director of research at the St. Louis Fed. Read more about the author’s research .

Iris Arbogast is a research associate at the Federal Reserve Bank of St. Louis.
Related Topics
Views expressed in Regional Economist are not necessarily those of the St. Louis Fed or Federal Reserve System.
For the latest insights from our economists and other St. Louis Fed experts, visit On the Economy and subscribe .
Media questions

An official website of the United States government
The .gov means it’s official. Federal government websites often end in .gov or .mil. Before sharing sensitive information, make sure you’re on a federal government site.
The site is secure. The https:// ensures that you are connecting to the official website and that any information you provide is encrypted and transmitted securely.
- Publications
- Account settings
Preview improvements coming to the PMC website in October 2024. Learn More or Try it out now .
- Advanced Search
- Journal List
- Eur J Popul
- v.35(2); 2019 May
The Effect of Population Growth on the Environment: Evidence from European Regions
Hannes weber.
1 Department of Sociology, University of Mannheim, A5, 6, 68159 Mannheim, Germany
Jennifer Dabbs Sciubba
2 Department of International Studies, Rhodes College, 2000 North Parkway, Memphis, TN 38112 USA
There is a long-standing dispute on the extent to which population growth causes environmental degradation. Most studies on this link have so far analyzed cross-country data, finding contradictory results. However, these country-level analyses suffer from the high level of dissimilarity between world regions and strong collinearity of population growth, income, and other factors. We argue that regional-level analyses can provide more robust evidence, isolating the population effect from national particularities such as policies or culture. We compile a dataset of 1062 regions within 22 European countries and analyze the effect from population growth on carbon dioxide (CO 2 ) emissions and urban land use change between 1990 and 2006. Data are analyzed using panel regressions, spatial econometric models, and propensity score matching where regions with high population growth are matched to otherwise highly similar regions exhibiting significantly less growth. We find a considerable effect from regional population growth on carbon dioxide (CO 2 ) emissions and urban land use increase in Western Europe. By contrast, in the new member states in the East, other factors appear more important.
Introduction
Somewhere around 1990, the mood in Europe turned against limiting population growth. By the turn of the millennium, the dominant narrative had shifted from worries over “too many people” to worries over “too few people,” highlighting the global divergence between negative European population trends and those of less developed states still experiencing significant growth. In 1983, a majority of 52% of Italians considered the recent dramatic drop in the total fertility rate to 1.4 children per women in their country to be “a good thing” (Palomba et al. 1998 ). Only 15% thought the Italian population should increase, while a large majority preferred either a decreasing (29%) or a stationary population (52%) (see ibid.). By 1995, this picture had changed considerably. According to Eurobarometer survey data, 40% of Italians now wanted their nation to grow, with less than 20% supporting a population decline (European Commission 1995 ). In the year 2000, according to the second wave of the “Population Policy Acceptance Study,” only 8% of the respondents in 12 European countries preferred their respective populations to decrease, compared to 49% who favored an increase (Höhn et al. 2008 ). Rapid and intense population aging—and in many cases, shrinking—is partly responsible for this shift in European viewpoints on optimal population trends. Viewed in the context of Europe’s environmental plans, however, desires for population increase might contradict those states’ ambitious climate goals.
Primarily because of concerns over economic strains, the EU is scrambling to institute policies that soften the economic effects of population aging and decline on the size of the workforce (European Commission 2015 ). Yet, by 2020 the EU aims to reduce CO 2 emissions by 20% and achieve no new net urban land by 2050 (European Commission 2011 ). Can these population and environmental goals exist side by side? Has fear of “overpopulation” damaging the environment rightly been dismissed in Europe? To answer these questions we estimate the effect of population growth on two dimensions of environmental degradation in Europe, greenhouse gas (CO 2 ) emissions and urban land use, for 1062 European NUTS-3 regions. 1 We analyze CO 2 emissions and urban growth as outcomes in this paper since these factors are recognized as drivers of adverse climate change by both environmental research and EU policies. CO 2 emissions directly affect world climate, while urban growth can have (among other consequences) an additional effect on air pollution and carbon stock in soil and vegetation by soil sealing and increased vehicular traffic (see, e.g., De Ridder et al. 2008 ; Schulp et al. 2008 ).
Our results demonstrate that net population growth in Europe will undermine ambitious climate goals. While some cities and regions have been able to experience high or medium population growth and still reduce emissions, particularly in Western Europe, many regions have not. Reducing emissions of a growing population requires significant planning and investment. Contemporary population policies within EU member states are usually concerned with stimulating growth. Possible benefits for the environment accompanying low or negative population growth are rarely discussed in official documents (see, e.g., European Commission 2014 ).
In the European Union, fertility rates have been at or below replacement level for two or more decades in most countries and projections by the United Nations and others routinely expect Europe to shrink—the UN ( 2015 ) estimates Europe to lose 32,000 people by 2050. By contrast, Bijak et al. ( 2007 ) project the EU-27’s population to remain constant by 2052 in their “base” scenario, while higher immigration rates could lead to an increase to 563 million people by mid-century, up from 504 million in 2015 and 482 million in 2000. Migration is incredibly difficult to predict, but we do know that migrants will conform to the general consumption behavior of where they move to, rather than retaining consumption patterns from where they came. And if we consider density instead of just total population, “depopulation” is not imminent for the EU. After all, with around 116 people per km 2 , the EU’s population density is more than twice the world’s average and by far greater than the USA’s (35/km 2 ), Africa’s (36/km 2 ) and also Asia’s (87/km 2 ). Despite a lower per capita consumption of natural resources than the USA, Canada, or Australia, densely populated European countries such as the Netherlands, Belgium, the UK, or Germany have a high ecological footprint, i.e., they consume a multitude of renewable resources compared to what their lands produce (Wackernagel and Rees 1996 ).
Theoretical Accounts on the Population–Environment Link
The relation between population and environmental degradation is often considered straightforward: More people should have a greater impact on the environment, if all other factors (such as per capita consumption) remain unchanged. As Laurie Mazur ( 2012 , p. 2) writes, “if we increase by 30% by 2050, we must swiftly reduce our collective impact by a third just to maintain the disastrous status quo.” The formal expression of this idea is the famous IPAT decomposition (Holdren and Ehrlich 1974 ), where humans’ environmental impact ( I ) is conceived to be a product of population size ( P ), per capita affluence ( A ), and technology ( T ) per unit of affluence. IPAT is still frequently referred to in the scientific debate, in particular by critics of population–environment (P–E) studies (e.g., Angus and Butler 2011 ). However, researchers in this field have long acknowledged the limits of IPAT for empirical research. In many applications, T is simply a ratio of I and A , and thus, the relative impact of population growth cannot be empirically assessed (see, e.g., York et al. 2003 ). In addition, in its simplest form, IPAT neglects possible interactions between the right-hand side variables.
Problems with IPAT are less acute in its stochastic version known as STIRPAT (Dietz and Rosa 1997 ) which allows for over- or underproportional weights of the factors in the equation determined by empirical data. Unobserved variables or interactions lead to a large error term which informs the researcher that the model only partly captures what is going on in the real world. There are many mechanisms of environmental degradation that do not involve population size or growth (see, e.g., de Sherbinin et al. 2007 for an overview). In the following, we review theoretical arguments on the link between population and the two outcomes of interest in this paper: urban land use change and CO 2 emissions.
With regard to urban growth, Lambin et al. ( 2003 , p. 224) list five “high-level causes” of land use change, only one of which specifically involves population growth. The other causal pathways focus on, among other factors, changing economic opportunities, policy interventions, and cultural change. In recent decades, cities such as Liverpool (the UK) or Leipzig (Germany) have experienced urban sprawl during periods of population decline (Couch et al. 2005 ). Many mechanisms driving urbanization of previously undeveloped land exist in the absence of population growth: Investors seek to build out-of-center retail facilities on cheaper building sites, and many families prefer detached houses in the “green” periphery (ibid.). This is particularly the case if income levels rise and households can afford larger homes (Patacchini et al. 2009 ). Commuting costs and public transport infrastructure in and around cities are also obvious determinants of how and where urban growth occurs (ibid.). Historical trajectories, local policies, and cultural preferences affect how compact or dispersed residential areas are built. For instance, European cities such as Barcelona are often contrasted against North American cities with a comparable population size, but a much larger urban area (e.g., Catalán et al. 2008 ). As an example of a more complex mechanism, urban growth into formerly suburban or rural areas can depend on whether socially deprived areas with high crime rates are more prominent in city centers (as is typical for North America) or in suburbs (as in many European cities, see Patacchini et al. 2009 ). Nevertheless, urban growth should ceteris paribus be stronger in the case of rapid population growth as compared with a stagnant population scenario. More people lead to a greater demand for accommodations and traffic—the question is whether this direct effect is empirically suppressed by other mechanisms as outlined above. Research mostly finds that population growth fosters urban land cover change, but there are geographical differences. In their meta-analysis, Seto et al. ( 2011 ) find that urban land expansion in India and Africa is mainly driven by population growth, while in China, North America, and Europe the main factor is GDP growth.
With regard to CO 2 emissions, there are also conflicting expectations in the literature. In general, few seem to doubt that a causal effect from human activity on the level of CO 2 emissions exists, mostly as a result of fossil energy combustion for purposes such as residential heating or transportation (e.g., de Sherbinin et al. 2007 ). Even though there are considerable differences in per capita consumption of energy, more humans ceteris paribus emit more CO 2 . As O’Neill et al. ( 2012 , p. 159) emphasize, if all other determinants of emissions and all relevant causal pathways are accounted for in a statistical model, “population can only act as a scale factor and its elasticity should therefore be 1.” However, the indirect effect of population growth via interactions and feedbacks with other variables remains often unclear. For instance, Simon ( 1993 , 1994 ) famously assumed that while population growth might create shortages of resources, rising prices for goods made with those resources will motivate technological innovations (which are more likely to occur in large populations) and therefore, in the long run, “more people equals (…) a healthier environment” (Simon 1994 , p. 22). Similar to the view put forward by Boserup ( 1965 ), technology is seen as endogenous to population growth (and positively affected by it). On the other hand, recent research suggests that more efficient technologies are paradoxically accompanied by an increase in energy consumption and thus emissions rise despite technological progress (York and McGee 2016 ). Empirically, most research finds that population growth is positively associated with CO 2 emissions increase (Bongaarts 1992 ; MacKellar et al. 1995 ; Dietz and Rosa 1997 ; Shi 2003 ; York et al. 2003 ; O’Neill et al. 2012 ; Liddle 2013 ). Against this body of research, critics point out that the bivariate correlation between population growth and emissions growth on the level of countries is zero or even negative (Satterthwaite 2009 ): Many countries marked by rapid population growth have low levels and low growth rates in emissions, and vice versa. This perspective suggests that differences in consumption levels caused by economic inequality, rather than population size or growth, are responsible for CO 2 emissions increase.
The biggest theoretical challenges to P–E research arguably lie in the insufficient knowledge about interactions and feedbacks between population, environment, and other factors. Most notably, population growth can interact with affluence. It is well established that fertility rates vary with factors such as socioeconomic modernity (e.g., Lutz and Qiang 2002 ), especially education (Schultz 1993 ), and human capital (Becker et al. 1990 ). According to the theory of demographic transition (Caldwell 1976 ; Dyson 2010 ), lower infant and child mortality rates (offset by higher affluence levels) are the primary cause of fertility decline (because humans have fewer children if they can expect more of them to survive). Due to a delay between the onsets of mortality and fertility decline, a population grows rapidly for a certain period and then stabilizes at a higher level. After fertility levels have dropped, a country can enjoy the “demographic dividend” (Bloom et al. 2003 ), as many young adults enter the workforce, but have fewer children to take care of. This change in age structure can also be accompanied by changing aspirations and preferences for accommodation (e.g., larger living space) and consumption, as has happened, for instance, in China in recent decades (Zhu and Peng 2012 ). Thus, in terms of IPAT, a decrease in P (or delta P) can cause an increase in A (and vice versa) and therefore halting population growth could possibly result in more environmental degradation rather than less.
In sum, most scholars agree that population size and growth have a direct effect on urban land cover and CO 2 emissions if all other factors are held constant. However, some authors argue that indirect effects—e.g., interactions and feedback processes with income or technology—typically compensate or even reverse the direct effect from population over time. We cannot solve this controversy in this paper. Instead, our research objective is to assess the total effect (i.e., direct and indirect effects) from population growth on the environment in Europe. The goal is to come to reasonable assumptions about what would happen if Europe’s population grew more or less rapidly. As described above, we use two operationalizations for environmental degradation: urban land use growth and CO 2 emissions.
Methodological Issues and Research Design
Contemporary P–E studies typically follow one of three types of approaches. The first approach focuses on an in-depth understanding of the causal pathway from P to E, including interactions and feedback with other factors. This approach often involves qualitative research, e.g., in the form of case studies of a particular country or region (e.g., Lutz et al. 2002 ; Gorrenflo et al. 2011 ). These studies can provide valuable insight for quantitative research with regard to how to model these direct and indirect effects. Yet, it is often difficult to generalize these qualitative findings on how population, policies, culture, and the economy interact in a specific setting to other countries or regions. The second approach quantitatively analyzes large (mostly cross-country) datasets with various statistical methods (for recent reviews see Hummel et al. 2013 ; Liddle 2014 ). These include linear regressions (Shi 2003 ; York et al. 2003 ) or more advanced econometric techniques for the analysis of panel data (Liddle 2013 ). They seek to attain generalizable knowledge of how P and E are usually correlated. Yet, different model specifications (with regard to how to deal with endogeneity or interaction effects) have produced different results in the past. Finally, a third approach uses simulations to arrive at different scenarios and predictions for future trends under varying assumptions. Simulations can either be done with macro-level models (e.g., Bongaarts 1992 ; O’Neill et al. 2010 ) or with bottom-up agent-based simulations, where household decisions, policy reactions, and feedback processes are modeled to study the emergent macro-level outcome (e.g., An et al. 2005 ). The validity of these predictions depends on how well the set of assumptions calibrating the simulations reflects reality, and they are commonly critiqued for excluding relevant variables and oversimplifying with regard to indirect effects and interactions. For instance, O’Neill et al. ( 2010 ) do not explicitly model any feedback effects from affluence or environment on population growth, which is why Angus and Butler ( 2011 ) refer to their models as “Malthus in, Malthus out.”
One of the biggest methodological problems in global cross-country research is the high level of collinearity usually found for many socioeconomic, political, and other variables (Schrodt 2014 ). Many comparative studies in P–E research suffer from the dissimilarity of the observed cases with regard to nearly anything that might affect population, environment, or both. For instance, emission levels have increased considerably in developed countries such as France over the past century, whereas this increase has been only modest in developing countries such as Ethiopia. The opposite is true for population growth. Thus, the observed correlation between population growth and emissions change is negative, as pointed out by Satterthwaite ( 2009 ) and others. However, this can hardly lead to the conclusion that France’s low population growth was causally responsible for the increase in emissions and a much higher population growth rate would have benefitted the environment. This is because France and Ethiopia also differ with regard to previous levels of population density and state of the environment as well as many other economic, technological, and other factors. A better approach could be to match France to a similar country that has experienced notably higher (or lower) rates of population growth and compare emission levels between the two countries. This could certainly provide a better foundation for a counterfactual scenario to determine what would happen if France’s population grew more or less rapidly. There might just not be many countries that meet the requirements for such a design to provide us with a sample sufficiently large to conduct quantitative analyses.
We argue that a good way to find appropriate cases is to examine the sub-national level (as in, e.g., Cramer 2002 ). Regions within one country are affected by the same national policies and are usually highly similar with regard to many potentially relevant factors such as climate, culture, or technological standards. For instance, Siedentop and Fina ( 2012 ) find that country-specific drivers of urban land use are important beyond demographic and economic variables; this distinction cannot be made in global country-level analyses. We avoid a large number of potential fallacies if we compare population growth and environmental trends in two French regions as opposed to comparing France to Ethiopia.
It might seem counterintuitive to select contemporary Europe as the location to examine the effects of population growth. As is well known, Europe is the world region with by far the lowest growth rate. Empirical studies usually find a much stronger detrimental population effect on the environment on other continents (e.g., Seto et al. 2011 ; Liddle 2013 ). However, net population growth—whether through natural increase or migration—in higher-income European areas potentially has greater detrimental effects on the environment than does growth in a lower-income area because the average European inhabitant has such high consumption. Additionally, from a methodological perspective, European regions provide a good sample to study the effect of population change on greenhouse gas emissions and urban land use because population is growing in some European regions, while in others is stationary or declining. Europe also includes considerable variation with regard to changes in emissions and land use. At the same time, the broader demographic, socioeconomic, and political context is held constant to some extent—our sample includes only upper-middle-income countries so we can move beyond emphasis on consumption patterns that dominate discussions of population and environment at the global level, and can isolate population growth to see if it is still a relevant issue for environmental discussions in developed states. By contrast, previous studies have often compared countries at various stages of the demographic transition that are embedded in different socioeconomic and political contexts. This wide sample poses some serious methodological issues as well as a risk of misinterpreting the data. By analyzing sub-national regions, we can also achieve greater statistical power through a larger sample size.
All European countries have already completed the demographic transition, and fertility rates are at or below replacement level. Variation in population growth is therefore not rooted in different levels of human development or broad cultural values, factors that could also affect the environment. Even differences in fertility rates between urban and rural regions, which were prominent until the mid-twentieth century, have almost disappeared. For instance, in 1960, the total fertility rate (TFR) in Switzerland was below 2 in urban areas such as Geneva compared with 3.5 or more children per woman in several rural cantons; today in all cantons the TFR falls somewhere between 1.2 and 1.7 (Basten et al. 2012 ). Population growth in Europe today mainly depends on internal and external migration. Net migration into a region partly varies with economic factors, such as employment opportunities, as in, say, south–north movements within Italy. On the other hand, international migration, especially, is path dependent and networks often lead to spatial variation in inflows long after the original cause of the first migration wave is gone (see, e.g., Mayda 2010 ). Consider, for instance, that many immigrants in Europe came as workers in the 1960s and 1970s and clustered into industrial areas. Later, new immigrants continued to prefer these cities over other destinations because family members or other co-ethnics already live there, despite the decline in the heavy industry in cities such as Lille (France), Duisburg (Germany), or Malmö (Sweden), where employment or income levels are similar or even worse compared with other regions hosting fewer immigrants. It also seems reasonable to assume that migrants do not target specific cities or regions primarily due to their environmental quality. Thus, we can argue that population growth in European regions is at least partly exogenous to the other variables in the equation and therefore issues of endogeneity or unobserved interactions should be much smaller compared with global cross-country analyses.
Data and Statistical Models
Our dataset encompasses 1062 NUTS-3 regions within 22 countries where data were available for our main variables of interest. 2 All countries are EU member states. We analyze changes between two time points with regard to urban growth and CO 2 emissions. Data for urban growth come from the CORINE Land Cover (CLC) project, a satellite-based classification of land surface by the European Environmental Agency ( 2007 ), distributed by the European Spatial Planning Observation Network (ESPON 2012 ). We use the first and the third releases of CLC with reference years 1990 and 2006, respectively, and calculate the change in the proportion of land in a NUTS-3 region that is classified as “artificial surfaces” (CLC-1), i.e., urban fabric, industrial areas, transport, etc., between these years. For greenhouse gas emissions we use data from the Emission Database for Global Atmospheric Research (EDGAR), aggregated for European NUTS regions as part of the “Greener Economy” project by ESPON ( 2014 ). The dataset contains estimates for total CO 2 emissions from fossil fuel combustion (excluding emissions from organic carbon, large-scale biomass burning, aviation, and shipping, as these cannot be directly attributed to human activity within the region) for the years 2000 and 2008. Average annual population growth within the same time period is calculated using data from Eurostat ( 2015a ). 3 We include regional data for per capita GDP and GDP growth (from Eurostat 2015b ) in our models. A list of all variables with descriptive statistics is given in “ Appendix .”
How are trends in population growth, emissions, and urban land use connected to one another? In a first step, we use the total sample of regions. We specify a dynamic model where changes in environmental impact Δ y i (representing either urban land use or CO 2 emissions) in region i = 1, …, N are regressed on their level at the time of the previous observation ( y i , t - 1 ). 4 Using changes rather than levels in the dependent variable reduces the problem of non-stationarity that likely exists when analyzing time-series data of autoregressive phenomena such as land use cover. This is relevant because non-stationary processes imply the risk of finding spurious correlations (Granger and Newbold 1974 ). In addition, the lagged dependent variable (LDV) y i , t - 1 captures the unobserved time-constant causes that led to differences between regions in the first place and also controls for a “Matthew effect.” (Urban land cover change occurs more often in areas that are already highly urbanized.) Note that observations are not yearly, but refer to first and last years of the observed period (thus T = 2) due to data availability. For both population ( p ) and per capita GDP ( a ), we include lagged level as well as change over the observed time period. Total population and per capita GDP are log-transformed to account for skewed distributions. A squared term of GDP to test for an environmental Kuznets curve (see, e.g., Carson 2010 ) was tested, but dropped from the final models since there was no evidence for such a pattern in Europe. As an additional control, we include a dummy for coastal location ( c ) of a region. The regression parameters are denoted by β 0 to β 6 , while ε i is the regional-level error term. Model 1 reports an ordinary least squares (OLS) estimation based on the following equation:
In a second model, we consider spatial autocorrelation: Regions are likely influenced by neighboring areas because of, e.g., commuter networks between regions, leading to a correlation in error terms among nearby regions. For instance, we can expect a rural region close to a city to develop differently in terms of urban land change and CO 2 emissions compared to an otherwise similar but remote rural region. These expectations are in line with previous research showing that, e.g., urban expansion is affected by surrounding land use (Huang et al. 2009 ). In our data, a test for spatial autocorrelation reveals significant amounts of spatial interdependence: Moran’s I is .31 for urban land use change and .46 for CO 2 emissions change in our sample. Neighboring regions are defined by contiguity here, and a binary weight matrix is applied, where the value is 1 if regions are contiguous and 0 otherwise. We estimate a spatial lag model (see Ward and Gleditsch 2008 ; LeSage and Pace 2009 ), where a spatially lagged dependent variable is added to the model. In Eq. ( 2 ), the term W y denotes the spatially lagged dependent variable together with weight matrix W .
As a robustness test, we also use a distance-based concept of neighborhood since this might better capture some drivers of spatial dependence in our dependent variables (such as commuting flows). In addition to the spatial lag model, we also estimate a spatial error model and a spatial lag model where the independent variables are lagged as well. These models can be found in “ Appendix .”
Next, we add a country-specific error term α j which is allowed to correlate with the other predictors (equivalent to a set of M-1 dummy variables for country j = 1, …, M ). 5 These country fixed effects control for unobserved country-specific influences such as national environmental policies. The equation for Model 3 can accordingly be written as:
Since regions in formerly communist Central-Eastern European countries may be more similar to each other than to Western European regions, we run the same analysis as in Model 3 separately in subsamples of only Western (Model 4) and only Eastern (Model 5) regions. We used base R for OLS regressions (R Core Team 2013 ) and the spdep package (Bivand and Piras 2015 ) for spatial models.
Finally, we preprocess the data using different matching algorithms (see, e.g., Ho et al. 2007 ). The idea is that for every region with high population growth, we find a region with a considerably lower growth rate, but otherwise highly similar characteristics. This type of “most similar case” design results in a more balanced sample and arguably gets us as close to identifying the population growth effect as it can get with this quasi-experimental study design. Around 10% of all regions ( N = 96) in the sample have experienced population growth rates of 1% or more per year on average during the study period. These regions represent the “treatment” group. As reported below, this “treatment” is only weakly correlated with other predictor variables in the data and therefore issues of endogeneity appear to be of low salience. The control group consists of regions with less than 0.5% growth per year ( N = 815). This cutoff value is chosen arbitrarily, though the results do not change significantly if we use a somewhat different threshold. We perform one-to-one nearest neighbor matching with a propensity score matching algorithm (Ho et al. 2007 ). 6
The result leaves us with a sample of 96 high-growth and 96 most similar low-growth regions. We then compare the distributions of urban growth and change in CO 2 emissions between “treatment” and control cases. To deal with missing values we used multiple imputation, creating ten multiply imputed datasets with Amelia II software (Honaker et al. 2011 ). Matching and model estimation are performed in each of the datasets, and the results are averaged with Rubin’s ( 1987 ) rules. (Note that 1029 out of 1062 cases have complete information, so missingness is not a major issue in our data.) An acceptable balance between the distributions of the variables in the two groups can be achieved with the algorithm. In the matched dataset for urban growth, both the high and the low population growth groups consist of predominantly Western European regions (93 vs. 91%), around half of them with a coastline (compared with 22% in the total sample). Per capita GDP averages at 27,500 Euros in the treatment group and 27,300 Euros in the control group (compared with 23,000 Euros in the total sample). Mean GDP growth rates are 4.0% over the observed period of time in both groups; only in terms of initial population size (652,000 vs. 548,000) the average values differ somewhat. For CO 2 emissions, balance is equally acceptable. Initial level of emissions (4400 tons vs. 4200 tons), per capita GDP (27,500 Euros vs. 27,600 Euros), GDP growth (4.0 vs. 4.1%), coastal location (49 vs. 52%), and location in Western Europe (93 vs. 91%) are very similar among the high and the low population growth groups. Again, initial population size (652,000 vs. 571,000) slightly differs. Some examples from the match tables: Madrid, Spain (high population growth), was matched with Rome, Italy (low population growth). The Irish South-East (high growth) was paired with South Jylland, Denmark (low growth). Dutch city of Utrecht (high growth) was matched with Salzburg, Austria (low growth), while the fast-growing Algarve in southern Portugal was paired with French department of Yvelines, where population growth was low.
Figures 1 , ,2, 2 , and and3 3 show the regional variation in population growth, CO 2 emissions, and urban land use between the regions in our dataset. Population growth was highest in Spain and Ireland in the 2000s, as these two countries witnessed the largest increase in their immigrant populations (in percentage points), followed by Italy (see Fig. 1 ). For Germany and France, the 2000s was a decade of low net immigration, but France’s major urban agglomerations still increased. Many Central-Eastern European countries had a net population loss, although not all regions; several populations in metro areas around cities such as Budapest, Prague, or Poznan increased. Urban growth, as Fig. 2 shows, is clearly related to the level of urbanization that was already present in a region. Artificial land use increased strongest in the already highly densely populated regions in the Netherlands and West Germany, along the Spanish, Portuguese, and French coastlines and in their respective capital regions, around the Irish and Danish capitals, in the tourist hotspots of Tyrol and in the industrial centers of northern Italy and Polish Silesia and capital region. The amount of soil sealing (destruction of soil due to urbanization construction, such as buildings) of farmland, pasture, or forests was rather low in many rural regions, in the Baltics and Balkans, or in inland France and Spain, apart from their capitals. There are observable differences in CO 2 emissions between countries and regions, too (see Fig. 3 ). Emissions grew strongly in the Baltic countries and in many parts of Ireland, Spain, and Bulgaria. By contrast, Denmark, Germany, and the Czech Republic largely reduced the emission of CO 2 .

Population growth in 20 European countries, 2000–2008, average annual rate

Urban land use change in 20 European countries, 1990–2006

CO2 emissions change in 19 European countries, 2000–2008
Tables 1 and and2 2 show the regression results using the full dataset with urban land change (Table 1 ) and CO 2 emissions change (Table 2 ) as the respective dependent variables. Table 1 confirms that population growth is positively correlated with urban growth. This effect holds when spatial autocorrelation (Model 2) and country-level fixed effects (Model 3) are taken into account, while the effect of GDP vanishes. When East and West are differentiated, a fairly strong positive effect for population growth is shown to exist in the West, while this effect is insignificant in the East. By contrast, urban growth is strongly determined by regional per capita GDP in the formerly communist countries, while affluence has no impact in the West.
Table 1
Predictors of urban growth as a percentage of total land use (logit-transformed) in 1062 European NUTS-3 regions between 1990 and 2006, all regions and by location in Eastern or Western Europe
Cells show unstandardized coefficients with standard errors in parentheses. * p < .05 ** p < .01 *** p < .001
Table 2
Predictors of change in CO 2 emissions (in kilotons) in 1033 European NUTS-3 regions between 2000 and 2008, all regions and by location in Eastern or Western Europe
The pattern is similar for CO 2 emissions (see Table 2 ). One additional percentage point of annual population growth is associated with 2.5 additional kilotons CO 2 emitted between 2000 and 2008 in Western Europe. In the East, however, there is no significant correlation between population and emissions change. Rather, the interesting finding here is that the lagged value of CO 2 emissions is negatively related to its increase. This finding means emissions grow stronger in Eastern regions where the level has previously been low, indicating that these regions seem to “catch up” in terms of CO 2 emissions. These emissions are not related to economic activity, however, since the coefficient for GDP growth is negative in all models where country-specific differences are controlled for.
Our data lend some support for the argument that population growth in European regions is partly exogenous to other variables in question, where on the level of Western European regions, population growth between 2000 and 2008 is only weakly correlated with per capita GDP in 2000 ( r = .10) and even negatively with GDP growth ( r = − .19) for the observed period. Note, however, that in Eastern Europe, the correlation between regional per capita GDP in 2000 and population growth between 2000 and 2008 is considerably stronger ( r = .41) than in the West (while for GDP growth, the coefficient is also weak and negative (− .18)). This might indicate that in Eastern Europe, population growth is endogenous to wealth to some extent, probably as a result of intra-national (e.g., rural–urban) migration, as international migration only played a minor role in most Eastern countries during the period under study.
It is also instructive to compare the effect of per capita GDP between models with (Model 3) and without (Models 1 and 2) country-specific errors in Table 2 . Judging from Model 1, we would assume a strong negative relationship between GDP and CO 2 emissions in Europe. This could be interpreted as showing that European regions are beyond the turning point on an environmental Kuznets curve, and the higher the affluence, the cleaner the regions with regard to emissions. These differences can entirely be attributed to the country level, however, and disappear once the country level is included. Thus, it seems as if the more affluent countries have made greater efforts to reduce emissions, but within countries there is no such relationship. These differences point to a possible interaction between socioeconomic prosperity and country-level policies, while dismissing a direct negative effect from affluence on emissions. A research design restricted to cross-country comparison likely fails to differentiate the effects of this sort.
Finally, results from the preprocessed sample using propensity score matching are shown in Figs. 4 and and5. 5 . Figure 4 displays differences in urban land take between regions with high population growth compared with a control group of otherwise most similar regions but where population growth was small or zero. Again, high population growth regions show a significantly larger increase in urban fabric compared with regions of similar size, affluence, and income growth, but with lower population growth. Urban land use increased at a mean rate which was more than twice as high in the high population growth regions compared with the control group. With regard to CO 2 emissions, the differences are similarly large (see Fig. 5 ). While regions with low to medium population growth have on average kept their level between 2000 and 2008, similar regions with higher population growth increased emissions by more than 10%. The significant population effect remains if we run multivariate models on this reduced sample where the other covariates are taken into account.

Urban land use change in European regions with high population growth and matched control group with low growth (red mark = mean).
Note Thick black lines denote the median, box limits are 25th and 75th percentile, respectively, red marks are mean values, and jitter points are regions ( N = 96 in high population growth group and N = 96 in control group). (Color figure online)

CO2 emissions change in European regions with high population growth and matched control group with low growth (red mark = mean).
So how are some European regions with high population growth able to achieve low CO 2 emissions? The city of Brussels, which put ambitious climate policies in place in 2004, provides one such example. The city set a specific target to reduce CO 2 emissions by 40% per capita by 2025, partly through high energy and air quality standards. Although population is growing, the city aims to improve air quality by encouraging public transportation and reducing car traffic by 20% from 2001 to 2018 (European Union 2016 ).
East Jylland provides another example. East Jylland forms the eastern portion of the continental portion of Denmark, north of Germany. The largest city in East Jylland is Arhus, which is considered the economic, trading, and cultural hub of both Jylland and Denmark (outside of Copenhagen). In 2008 and 2009, Arhus was named one of the six “Eco Cities” by the Danish Ministry of Climate and Energy—a scheme “developed in order to acknowledge cutting-edge cities and to inspire other local authorities to make increased efforts in the field of climate and energy” (Rasmussen and Christensen 2010 , p. 217). As a “cutting-edge” city in developing clean energy alternatives and fighting global warming, local officials in Arhus in 2007 committed the city to being CO 2 neutral by 2030 (ibid.). Arhus was also the first city to monitor and map its CO 2 emissions and to develop a “CO 2 calculator,” which is now used across Europe. The city’s current eco plan “consists of several generations of climate plans reaching towards 2030” (City of Aarhus 2016 ). The primary legs of these plans consist of: developing an extensive and efficient light rail, committing public funds to increasing the size of local forests and wetlands, improving biking accessibility and safety, improving the municipality’s heating system (which is derived from the local incineration plant), planning and implementing flood prevention plans, increasing public knowledge of and funding for housing energy efficiency, and finally, increasing public knowledge and public–private partnerships. In direct public spending on these goals, local authorities have committed over 72 million Euros. However, the actual sum is much larger when you take into account government subsidies for energy efficiency improvements, investments in current energy infrastructure, and public–private partnerships. These investments are paying off. For example, improvements to the city’s incinerator/zero-carbon energy producer have decreased CO 2 output by 60,000 tons per year, while investments into reforestation will begin absorbing nearly 14 tons of CO 2 annually (City of Aarhus 2016 ).
Hamburg, in northern Germany, is a case of low population growth and low emissions. With around 1.7 million inhabitants, Hamburg is one of the European Union’s largest cities and its population grew at a modest 0.48% per annum during the study period. The city won the European Union’s award for “Europe’s Green Capital” in 2011. Rather than expanding outwards, Hamburg is focusing on redeveloping formerly industrial areas (brownfields), such as HafenCity, Hamburg, which sits on 388 acres and is slated to add 5500 homes, commercial areas, green space, offices, schools—including a university—and daycare, all following the city’s green building standards. Hamburg’s “urban densification” efforts, as opposed to urban sprawl, prevent the city’s ecological footprint from spreading outward, potentially converting rural lands into suburban areas (Benfield 2011 ). Hamburg’s city leaders have made raising awareness about air quality among its residents a priority and have “ambitious climate protection goals” that aim to reduce Hamburg’s CO 2 emissions by 40% by 2020 and by 80% by 2050. Investments in energy-saving measures in public buildings are partly responsible for reducing the per capita emissions by 15% against 1990 (European Commission 2009 ).
Finally, Dublin, which has similar characteristics to Hamburg in terms of per capita income and other variables in our dataset, illustrates the environmental consequences possible with high population growth (1.51% during the period of study). With a growing population and growing emissions, Dublin, Ireland, does not represent the typical trend in European environmental standards. Between 1990 and 2006, Dublin’s annual emissions increased by almost 15,000 kilotons (CO 2 ). The majority of that increase in emissions came from the rapidly increasing transport and residential sectors as a result of the transportation and housing demands of Dublin’s burgeoning population. In fact, the transport sector has shown an increase of 165% from 1990 to 2006 (Environmental Protection Agency 2006 ). In addition, the Environmental Protection Agency projects Ireland will fail to meet its obligations under the EU emissions reduction agreement by 2020 (ibid). As a solution to Dublin’s growing population and rising emissions, the Dublin City Council’s 2016 –2022 Development Plan proposes redeveloping “vacant, derelict, and under-used lands with a focus on areas close to public transport corridors as well as areas of under-utilized physical and social infrastructure.” The city council also recognizes the importance of green infrastructure and has identified it as significantly contributing “in the areas of development management, climate change and environmental risk management” (Dublin City Council 2016 ).
Conclusion and Discussion
Bookchin ( 1996 , p. 30) suggests that “[t]he ‘population problem’ has a Phoenix-like existence: it rises from the ashes at least every generation and sometimes every decade or so.” But this is also true about the “depopulation problem,” which has recurred periodically over the last centuries (see Teitelbaum and Winter 1985 ). Both Malthusian (abundance of population is bad) and “cornucopian” (abundance of population is good) ideas are found in writings throughout recorded history (see, e.g., Schumpeter 1954 , pp. 250–251; Spengler 1998 , pp .4–5). Today, worries about “too few” instead of “too many people” seem to dominate the European discourse (Coole 2013 ). Trends in public discourse may or may not reflect empirical evidence on the topic. The question of whether population growth is harmful for the environment cannot be solved by solely looking at the discourse. The fact alone that people (perhaps unfoundedly) warned of “overpopulation” at times when world population was 0.2 billion (Plato), 1.0 billion (Malthus) or 3.5 billion (Ehrlich 1968 ) does not prove that any further increases from today’s 7 billion will necessarily come without further adverse consequences.
Population growth affects the environment in Europe: This is what our regional-level analysis of changes in urban land growth and CO 2 emissions indicates. However, we find significant differences between Western and Eastern Europe. In the West, regions with population growth are clearly experiencing both more urban growth as well as a greater increase in CO 2 emissions compared with stationary or shrinking regions. This suggests that population acts as a scale factor for environmental degradation in the West, as proponents of IPAT have argued. In the East, however, where population is mostly decreasing, there is no such correlation. Instead, urban growth in Eastern Europe seems to have more to do with affluence, and emissions have grown strongest in those regions where they have previously been low.
Many Western European regions are expected to experience population growth in the coming decades, mostly due to internal population shifts and international immigration. Immigration from non-European countries has clearly been one of the most salient political topics in recent years and will likely continue to be in the near future. However, it is also a strongly polarizing topic that has triggered schisms among many environmentalists (Huang 2012 ). Some have pointed out that, on a global level, migration is a zero-sum game and therefore world population growth matters, not changes in its spatial distribution (e.g., Mazur 2012 ). Others have shown that an individual’s environmental footprint grows after moving to a developed country (e.g., Conca et al. 2002 ). This argument obviously only holds if the unequal distribution of wealth and pollutants is assumed to persist. In any case, there are no reasons to believe that for a specific ecosystem under pressure from human population growth, it matters whether the additional people were born within some specific borders or somewhere else. And global environmental problems can certainly not be solved by limiting immigration to Europe. However, the empirical evidence suggests that future population growth as a result of immigration will make it harder for the European Union to achieve its climate goals.
See Tables 3 , ,4, 4 , and and5 5 .
Table 3
Descriptive statistics
Table 4
Determinants of urban land growth in European NUTS-3 regions (additional spatial model specifications)
Table 5
Determinants of CO 2 emission change in European NUTS-3 regions (additional spatial model specifications)
Compliance with Ethical Standards
Conflict of interest.
The authors declare that they have no conflict of interest.
1 The EU classifies its territory into four layers according to the Nomenclature des Unités Territoriales Statistiques (NUTS). The lowest level consists of NUTS-3 regions, designed to usually host between 150,000 and 800,000 people. France, for instance, consists of 100 NUTS-3 regions (départements), 20 NUTS-2 regions (régions), 8 NUTS-1 regions (groups of régions), and one NUTS-0 region (metropolitan France).
2 These countries are Austria, Belgium, Bulgaria, Croatia, Czech Republic, Denmark, Estonia, France, Germany, Hungary, Italy, Ireland, Latvia, Lithuania, Luxembourg, Netherlands, Poland, Portugal, Romania, Slovakia, Slovenia, and Spain. For CO 2 emissions, no data were available for Croatia. As a result of a reform of regional boundaries in the German state of Saxony, most regions in Saxony are missing from the analysis (note the white area on the maps).
3 For the models explaining urban growth which is measured between 1990 and 2006, population growth is averaged for this period. However, population data are not available for all regions since 1990 in the source dataset; for these regions the values refer to average population growth between the earliest available year since 1990 and 2008. Figure 1 displays average annual population growth rates between 2000 and 2008 for all regions.
4 Since urban land use is measured as a percentage of total land use and therefore 0–1 bounded, we use the logit transformation on this variable.
5 A random effects model was initially considered (providing similar results to the fixed effects model), but a Hausman test suggested superiority of the fixed effects estimator. Since we are not interested in estimating country-level predictors, we went without random effects (or multilevel) models.
6 Optimal matching and genetic matching were used as alternative algorithms. Since the results do not differ substantially, we only report the findings from propensity score matching here.
Contributor Information
Hannes Weber, Phone: +49 621 181-2816, Email: [email protected] .
Jennifer Dabbs Sciubba, Phone: +1 901 843-3571, Email: ude.sedohr@jabbuics .
- An L, Lindermann M, Qi J, Shortdridge A, Liu J. Exploring complexity in a human-environment system: An agent-based spatial model for multidisciplinary and multiscale integration. Annals of the Association of American Geographers. 2005; 95 (1):54–79. doi: 10.1111/j.1467-8306.2005.00450.x. [ CrossRef ] [ Google Scholar ]
- Angus I, Butler S. Too many people? Population, immigration, and the environmental crisis. Chicago, IL: Haymarket; 2011. [ Google Scholar ]
- Basten S, Huinink J, Klüsener S. Spatial variation of sub-national fertility trends in Austria, Germany and Switzerland. Comparative Population Studies. 2012; 36 (2–3):615–660. [ Google Scholar ]
- Becker GS, Murphy KM, Tamura R. Human capital, fertility, and economic growth. Journal of Political Economy. 1990; 98 (5):S12–S37. doi: 10.1086/261723. [ CrossRef ] [ Google Scholar ]
- Benfield, K. (2011). How Hamburg became Europe’s Greenest City. Citylab. Accessed 1 Apr 2016.
- Bijak J, Kupiszewska D, Kupiszewski M, Saczuk K, Kicinger A. Population and labour force projections for 27 European countries, 2002–2052: Impact of international migration on population ageing. European Journal of Population. 2007; 23 :1–31. doi: 10.1007/s10680-006-9110-6. [ PMC free article ] [ PubMed ] [ CrossRef ] [ Google Scholar ]
- Bivand R, Piras G. Comparing implementations of estimation methods for spatial econometrics. Journal of Statistical Software. 2015; 63 (18):1–36. doi: 10.18637/jss.v063.i18. [ CrossRef ] [ Google Scholar ]
- Bloom DE, Canning D, Sevilla J. The demographic dividend. A New Perspective on the Economic Consequences of Population Change. Santa Monica: RAND; 2003. [ Google Scholar ]
- Bongaarts J. Population growth and global warming. Population and Development Review. 1992; 18 (2):299–319. doi: 10.2307/1973681. [ CrossRef ] [ Google Scholar ]
- Bookchin M. Which way for the ecology movement? San Francisco, CA: AK Press; 1996. [ Google Scholar ]
- Boserup E. The condition of agricultural growth. London: Allen & Unwin; 1965. [ Google Scholar ]
- Caldwell JC. Toward a restatement of demographic transition theory. Population and Development Review. 1976; 2 (3/4):312–366. doi: 10.2307/1971615. [ CrossRef ] [ Google Scholar ]
- Carson RT. The environmental Kuznets curve: Seeking empirical regularity and theoretical structure. Review of Environmental Economics and Policy. 2010; 4 (1):3–23. doi: 10.1093/reep/rep021. [ CrossRef ] [ Google Scholar ]
- Catalán B, Saurí D, Serra P. Urban sprawl in the Mediterranean? Patterns of growth and change in the Barcelona Metropolitan Region 1993–2000. Landscape and Urban Planning. 2008; 85 (3):174–184. doi: 10.1016/j.landurbplan.2007.11.004. [ CrossRef ] [ Google Scholar ]
- City of Aarhus (2016). Aarhus CO 2 neutral in 2030. https://stateofgreen.com/files/download/135 . Cited 1 April 2016.
- Conca K, Princen T, Maniates MF. Confronting consumption. Cambridge, MA: The MIT Press; 2002. [ Google Scholar ]
- Coole D. Too many bodies? The return and disavowal of the population question. Environmental Politics. 2013; 22 (2):195–215. doi: 10.1080/09644016.2012.730268. [ CrossRef ] [ Google Scholar ]
- Couch C, Karecha J, Nuissl H, Rink D. Decline and sprawl: An evolving type of urban development–observed in Liverpool and Leipzig. European Planning Studies. 2005; 13 (1):117–136. doi: 10.1080/0965431042000312433. [ CrossRef ] [ Google Scholar ]
- Cramer J. Population growth and local air pollution: Methods, models, and results. Population and Development Review. 2002; 28 (Supplement):22–52. [ Google Scholar ]
- De Ridder K, Lefebre F, Adriaensen A, Arnold U, Beckroege W, Bronner C, et al. Simulating the impact of urban sprawl on air quality and population exposure in the German Ruhr area. Part II: Development and evaluation of an urban growth scenario. Atmospheric Environment. 2008; 42 :7070–7077. doi: 10.1016/j.atmosenv.2008.06.044. [ CrossRef ] [ Google Scholar ]
- De Sherbinin A, Carr D, Cassels S, Jiang L. Population and Environment. The Annual Review of Environment and Resources. 2007; 32 :5. doi: 10.1146/annurev.energy.32.041306.100243. [ PMC free article ] [ PubMed ] [ CrossRef ] [ Google Scholar ]
- Dietz T, Rosa EA. Effects of population and affluence on CO 2 emissions. Proceedings of the National Academy of Sciences of the USA. 1997; 94 :175–179. doi: 10.1073/pnas.94.1.175. [ PMC free article ] [ PubMed ] [ CrossRef ] [ Google Scholar ]
- Dublin City Council . Dublin City development plan 2016–2022 written statement. Dublin: Dublin City Council; 2016. [ Google Scholar ]
- Dyson T. Population and development: The demographic Transition. London/New York: Zed Books; 2010. [ Google Scholar ]
- Ehrlich PR. The population bomb. New York: Sierra Club/Ballantine Books; 1968. [ Google Scholar ]
- Environmental Protection Agency (2006). Ireland’s Greenhouse Gas Emissions in 2006. Count Wexford: Environmental Protection Agency.
- European Commission (1995). Eurobarometer 44.0. INRA, Brussels. GESIS Data Archive, Cologne. ZA2689 Data file Version 1.0.1. 10.4232/1.10916.
- European Commission (2009). Environment: Stockholm and Hamburg win first European Green Capital awards. Brussels, European Commission 23 Feb.
- European Commission . Roadmap to a resource efficient Europe, Communication COM (2011) 571 of 20 September 2011. Brussels: European Commission; 2011. [ Google Scholar ]
- European Commission . The 2015 ageing report: Economic and budgetary projections for the 28 EU Member States (2013–2060) Brussels: European Commission; 2015. [ Google Scholar ]
- European Environmental Agency . CLC2006 technical guidelines. EEA Technical report No 17/ 2007. Luxembourg: Office for Official Publications of the European Communities; 2007. [ Google Scholar ]
- European Spatial Planning Observation Network (2012). Corine land cover, third level of the nomenclature (CLC_AGG3). http://database.espon.eu/db2 . Cited 9 March 2015.
- European Spatial Planning Observation Network (2014). CO 2 emissions from ground transport. http://database.espon.eu/db2 . Cited 11 March 2015.
- European Union (2016). Brussels. http://ec.europa.eu/environment/europeangreencapital/winning-cities/previous-finalists/brussels/index.html . Cited 1 April 2016.
- Eurostat (2015a). Population on 1 January by broad age group, sex and NUTS 3 region (demo_r_pjanaggr3). http://appsso.eurostat.ec.europa.eu/nui/show.do?dataset=demo_r_pjanaggr3&lang=en . Cited 17 March 2015.
- Eurostat (2015b). Gross domestic product (GDP) at current market prices by NUTS 3 regions (nama_r_e3gdp). http://appsso.eurostat.ec.europa.eu/nui/show.do?dataset=nama_r_e3gdp&lang=en . Cited 13 March 2015.
- Gorrenflo LJ, Corson C, Chomitz KM, Harper G, Honzák M, Özler B. Exploring the association between people and deforestation in Madagascar. In: Cincotta RP, Gorenflo LJ, editors. Human population: Its influences on biological diversity. Berlin/ Heidelberg: Springer; 2011. [ Google Scholar ]
- Granger CW, Newbold P. Spurious regressions in econometrics. Journal of Econometrics. 1974; 2 (2):111–120. doi: 10.1016/0304-4076(74)90034-7. [ CrossRef ] [ Google Scholar ]
- Ho DE, Imai K, King G, Stuart EA. Matching as nonparametric preprocessing for reducing model dependence in parametric causal inference. Political Analysis. 2007; 15 (3):199–236. doi: 10.1093/pan/mpl013. [ CrossRef ] [ Google Scholar ]
- Höhn C, Avramov D, Kotowska IE, editors. People, Population Change and Policies. Lessons from the Population Policy Acceptance Study: Demographic knowledge—gender—ageing. Data CD-ROM. Berlin: Springer; 2008. [ Google Scholar ]
- Holdren JP, Ehrlich PR. Human population and the global environment: Population growth, rising per capita material consumption, and disruptive technologies have made civilization a global ecological force. American Scientist. 1974; 62 (3):282–292. [ PubMed ] [ Google Scholar ]
- Honaker J, King G, Blackwell M. Amelia II: A program for missing data. Journal of Statistical Software. 2011; 45 (7):1–47. doi: 10.18637/jss.v045.i07. [ CrossRef ] [ Google Scholar ]
- Huang P. Over-breeders and the population bomb. the reemergence of nativism and population control in anti-immigration policies. In: Mazur L, editor. A pivotal moment. Population, justice, and the environmental challenge. Washington, D.C./Covelo (CA): Island Press; 2012. [ Google Scholar ]
- Huang B, Zhang L, Wu B. Spatiotemporal analysis of rural–urban land conversion. International Journal of Geographical Information Science. 2009; 23 (3):379–398. doi: 10.1080/13658810802119685. [ CrossRef ] [ Google Scholar ]
- Hummel D, Adamo S, de Sherbinin A, Murphy L, Aggarwal R, Zulu L, et al. Inter-and transdisciplinary approaches to population–environment research for sustainability aims: A review and appraisal. Population and Environment. 2013; 34 (4):481–509. doi: 10.1007/s11111-012-0176-2. [ CrossRef ] [ Google Scholar ]
- Lambin EF, Geist HJ, Lepers E. Dynamics of land-use and land-cover change in tropical regions. Annual Review of Environment and Resources. 2003; 28 (1):205–241. doi: 10.1146/annurev.energy.28.050302.105459. [ CrossRef ] [ Google Scholar ]
- LeSage P, Pace R. Introduction to spatial econometrics. London/New York: CRC Press; 2009. [ Google Scholar ]
- Liddle B. Population, affluence, and environmental impact across development: evidence from panel cointegration modeling. Environmental Modelling and Software. 2013; 40 :255–266. doi: 10.1016/j.envsoft.2012.10.002. [ CrossRef ] [ Google Scholar ]
- Liddle B. Impact of population, age structure, and urbanization on carbon emissions/energy consumption: evidence from macro-level, cross-country analyses. Population and Environment. 2014; 35 (3):286–304. doi: 10.1007/s11111-013-0198-4. [ CrossRef ] [ Google Scholar ]
- Lutz W, Qiang R. Determinants of human population growth. Philosophical Transactions of the Royal Society of London B: Biological Sciences. 2002; 357 (1425):1197–1210. doi: 10.1098/rstb.2002.1121. [ PMC free article ] [ PubMed ] [ CrossRef ] [ Google Scholar ]
- Lutz W, Scherbov S, Prskawetz A, Dworak M, Feichtinger G. Population, natural resources, and food security: Lessons from comparing full and reduced-form models. Population and Development Review. 2002; 28 :199–224. [ Google Scholar ]
- MacKellar FL, Lutz W, Prinz C, Goujon A. Population, households, and CO 2 emissions. Population and Development Review. 1995; 21 (4):849–865. doi: 10.2307/2137777. [ CrossRef ] [ Google Scholar ]
- Mayda AM. International migration: A panel data analysis of the determinants of bilateral flows. Journal of Population Economics. 2010; 23 :1249–1274. doi: 10.1007/s00148-009-0251-x. [ CrossRef ] [ Google Scholar ]
- Mazur L. Introduction. In: Mazur L, editor. A pivotal moment. Population, justice, and the environmental challenge. Washington, D.C./Covelo (CA): Island Press; 2012. [ Google Scholar ]
- O’Neill BC, Dalton M, Fuchs R, Jiang L, Pachauri S, Zigova K. Global demographic trends and future carbon emissions. Proceedings of the National Academy of Sciences. 2010; 107 (41):17521–17526. doi: 10.1073/pnas.1004581107. [ PMC free article ] [ PubMed ] [ CrossRef ] [ Google Scholar ]
- O’Neill BC, Liddle B, Jiang L, Smith KR, Pachauri S, Dalton M, et al. Demographic change and carbon dioxide emissions. The Lancet. 2012; 380 (9837):157–164. doi: 10.1016/S0140-6736(12)60958-1. [ PubMed ] [ CrossRef ] [ Google Scholar ]
- Palomba R, Menniti A, Mussino A. Attitudes towards demographic trends and policy. European Journal of Population. 1998; 4 :297–313. doi: 10.1007/BF01797131. [ CrossRef ] [ Google Scholar ]
- Patacchini, E., Zenou, Y., Henderson, J. V., & Epple, D. (2009). Urban sprawl in Europe. Brookings-Wharton Papers on Urban Affairs (pp. 125–149).
- R Core Team (2013). R: A language and environment for statistical computing. R Foundation for Statistical Computing, Vienna, Austria. http://www.R-project.org . Cited 30 September 2013.
- Rasmussen, U.V. & Christensen, A.M.H. (2010). Danish EcoCities: Six cutting-edge climate and energy cities. In 2010 aceee summer study on energy efficiency in buildings . http://aceee.org/files/proceedings/2010/data/papers/2264.pdf . Cited 1 April 2016.
- Rubin DB. Multiple Imputation for Nonresponse in Surveys. Hoboken, NJ: Wiley; 1987. [ Google Scholar ]
- Satterthwaite D. The implications of population growth and urbanization for climate change. Environment and Urbanization. 2009; 21 (2):545–567. doi: 10.1177/0956247809344361. [ CrossRef ] [ Google Scholar ]
- Schrodt PA. Seven deadly sins of contemporary quantitative political analysis. Journal of Peace Research. 2014; 51 (2):287–300. doi: 10.1177/0022343313499597. [ CrossRef ] [ Google Scholar ]
- Schulp CJ, Nabuurs GJ, Verburg PH. Future carbon sequestration in Europe—effects of land use change. Agriculture, Ecosystems & Environment. 2008; 127 (3):251–264. doi: 10.1016/j.agee.2008.04.010. [ CrossRef ] [ Google Scholar ]
- Schultz TP. Returns to women’s education. In: King EM, Hill MA, editors. Women’s education in developing countries: Barriers, benefits, and policies. Baltimore, MD: Johns Hopkins University Press; 1993. [ Google Scholar ]
- Schumpeter, J. A. (1994 [1954]). History of economic analysis. London/New York: Routledge.
- Seto KC, Fragkias M, Güneralp B, Reilly MK. A meta-analysis of global urban land expansion. PLoS ONE. 2011; 6 (8):e23777. doi: 10.1371/journal.pone.0023777. [ PMC free article ] [ PubMed ] [ CrossRef ] [ Google Scholar ]
- Shi A. The impact of population pressure on global carbon dioxide emissions, 1975–1996: evidence from pooled cross-country data. Ecological Economics. 2003; 44 (1):29–42. doi: 10.1016/S0921-8009(02)00223-9. [ CrossRef ] [ Google Scholar ]
- Siedentop S, Fina S. Who sprawls most? Exploring the patterns of urban growth across 26 European countries. Environment and Planning A. 2012; 44 (11):2765–2784. doi: 10.1068/a4580. [ CrossRef ] [ Google Scholar ]
- Simon JL. Economic thought about population consequences: Some reflections. Journal of Population Economics. 1993; 6 (2):137–152. doi: 10.1007/BF00178558. [ PubMed ] [ CrossRef ] [ Google Scholar ]
- Simon JL. More people, greater wealth, more resources, healthier environment. Economic Affairs. 1994; 14 (3):22–29. doi: 10.1111/j.1468-0270.1994.tb00191.x. [ CrossRef ] [ Google Scholar ]
- Spengler JJ. History of population theories. In: Simon JL, editor. The economics of population: Classic writings. New Brunswick, NJ: Transaction Publishers; 1998. pp. 3–15. [ Google Scholar ]
- Teitelbaum MS, Winter LM. The fear of population decline. New York: Academic Press; 1985. [ Google Scholar ]
- United Nations (2015). World Population Projections. The 2015 Revision. Volume I: Comprehensive Tables. New York: United Nations.
- Wackernagel M, Rees W. Our ecological footprint: Reducing human impact on the earth. Gabriola Island, BC: New Society Publishers; 1996. [ Google Scholar ]
- Ward MD, Gleditsch KS. Spatial regression models. Los Angeles: Sage; 2008. [ Google Scholar ]
- York R, McGee JA. Understanding the Jevons Paradox. Environmental. Sociology. 2016; 2 (1):77–87. [ Google Scholar ]
- York R, Rosa EA, Dietz T. STIRPAT, IPAT and ImPACT: Analytic tools for unpacking the driving forces of environmental impacts. Ecological Economics. 2003; 46 (3):351–365. doi: 10.1016/S0921-8009(03)00188-5. [ CrossRef ] [ Google Scholar ]
- Zhu Q, Peng X. The impacts of population change on carbon emissions in China during 1978–2008. Environmental Impact Assessment Review. 2012; 36 :1–8. doi: 10.1016/j.eiar.2012.03.003. [ CrossRef ] [ Google Scholar ]
Advertisement
The Impact of Population Growth on Natural Resources and Farmers’ Capacity to Adapt to Climate Change in Low-Income Countries
- Review Article
- Published: 16 March 2021
- Volume 5 , pages 271–283, ( 2021 )
Cite this article
- Mengistu M. Maja ORCID: orcid.org/0000-0003-2612-9243 1 &
- Samuel F. Ayano 1
8822 Accesses
141 Citations
Explore all metrics
Population growth and natural resources are intricately linked and play role in climate disruption and farmers’ ability to adapt to climate change especially in developing countries with rapid demographic changes and economies mostly dependent on natural resources. Although literature exists on population issues, emphasis was given to positive roles of population growth providing only incomplete picture for stakeholders and policy makers. This constrained climate change adaptation and mitigation strategies, improving food security and attaining sustainable development goals. We reviewed publications on low-income countries with emphasis on sub-Saharan Africa and Southeast Asia. This review will bring forth often sidelined issue of population growth for decision-makers and future research in the context of achieving sustainable development goals of the United Nations for 2015–2030. Therefore, this review was initiated to reveal the impacts of population growth on natural resources and to uncover farmers’ capacity to adapt to climate change in low-income countries. Rapid population growth continues to be a major underlying force of environmental degradation and a threat to sustainable use of natural resources. It reduces the quality and quantity of natural resources through overexploitation, intensive farming and land fragmentation. Regions with high population pressure face scarcity of arable land, which leads to shortened/removed fallow period, declining soil fertility and farm income due to farm subdivision. Furthermore, landless individuals or those who operate small farms resettle or cultivate marginal lands, encroach on natural forests in search of more vacant land, which alters carbon source sink dynamics of the environment. Low farm income from small farms not only exacerbates food insecurity of farmers but also constrains their ability to adopt certain climate change adaptation technologies. All stakeholders should take swift actions to address challenges of rapid population growth and alter the dynamics between population, natural resources and climate change and its adaptation.
This is a preview of subscription content, log in via an institution to check access.
Access this article
Price includes VAT (Russian Federation)
Instant access to the full article PDF.
Rent this article via DeepDyve
Institutional subscriptions
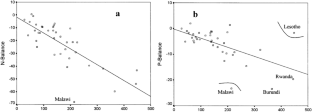
modified from Crist et al. 2017 )
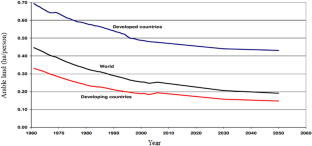
Impact of climate change on biodiversity and food security: a global perspective—a review article
Melese Genete Muluneh
Climate change impacts in Sub-Saharan Africa: from physical changes to their social repercussions
Olivia Serdeczny, Sophie Adams, … Julia Reinhardt

A comprehensive review of climate change impacts, adaptation, and mitigation on environmental and natural calamities in Pakistan
Mudassar Hussain, Abdul Rahman Butt, … Balal Yousaf
Abdul-Razak M, Kruse S (2017) The adaptive capacity of smallholder farmers to climate change in the Northern Region of Ghana. Clim Risk Manag 17:104–122
Article Google Scholar
Acemoglu D, Fergusson L, Johnson S (2020) Population and conflict. Rev Econ Stud 87:1565–1604
Adamopoulos T, Restuccia D (2014) The size distribution of farms and international productivity differences. Am Econ Rev 104(6):1667–1697
Ahrends A, Burgess ND, Milledge SA, Bulling MT, Fisher B, Smart JC, Lewis SL (2010) Predictable waves of sequential forest degradation and biodiversity loss spreading from an African city. Proc Natl Acad Sci 107:14556–14561
Aizen MA, Aguiar S, Biesmeijer JC, Garibaldi LA, Inouye DW, Jung C, Pauw A (2019) Global agricultural productivity is threatened by increasing pollinator dependence without a parallel increase in crop diversification. Glob Change Biol 25:3516–3527
Albert JS, Destouni G, Duke-Sylvester SM, Magurran AE, Oberdorff T, Reis RE, Ripple WJ (2020) Scientists’ warning to humanity on the freshwater biodiversity crisis. Ambio 2021 50:85–94
Alemu GT, Berhanie Ayele Z, Abelieneh Berhanu A (2017) Effects of land fragmentation on productivity in Northwestern Ethiopia. Adva Agric
Ali A, Erenstein O (2017) Assessing farmer use of climate change adaptation practices and impacts on food security and poverty in Pakistan. Clim Risk Manag 16:183–194
Almer C, Laurent-Lucchetti J, Oechslin M (2017) Water scarcity and rioting: Disaggregated evidence from Sub-Saharan Africa. J Environ Econ Manag 86:193–209
Althor G, Watson JE, Fuller RA (2016) Global mismatch between greenhouse gas emissions and the burden of climate change. Sci Rep 6:20281
Amsalu A, De Graaff J (2007) Determinants of adoption and continued use of stone terraces for soil and water conservation in an Ethiopian highland watershed. Ecol Econ 61:294–302
Andersson JA (1999) The politics of land scarcity: land disputes in Save Communal Area, Zimbabwe. J S Afr Stud 25:553–578
Antwi-Agyei P, Stringer LC, Dougill AJ (2014) Livelihood adaptations to climate variability: insights from farming households in Ghana. Reg Environ Change 14:1615–1626
Antwi-Agyei P, Dougill AJ, Stringer LC (2015) Barriers to climate change adaptation: Evidence from northeast Ghana in the context of a systematic literature review. Clim Dev 7:297–309
Arsiso BK, Tsidu GM, Stoffberg GH, Tadesse T (2017) Climate change and population growth impacts on surface water supply and demand of Addis Ababa, Ethiopia. Clim Risk Manag 18:21–33
Aye GC, Edoja PE (2017) Effect of economic growth on CO 2 emission in developing countries: Evidence from a dynamic panel threshold model. Cogent EconFinance 5:1379239
Banerjee S, Walder F, Büchi L, Meyer M, Held AY, Gattinger A, Van Der Heijden MG (2019) Agricultural intensification reduces microbial network complexity and the abundance of keystone taxa in roots. ISME J 13:1722–1736
Barbier EB, Hochard JP (2018) Poverty, rural population distribution and climate change. Environ Dev Econ 23:234–256
Bedasa NA, Hussein JW (2018) Challenges in Managing Land-Related Conflicts in East Hararghe Zone of Oromia Regional State, Ethiopia. Soc Nat Resour 31:351–366
Belay A, Recha JW, Woldeamanuel T, Morton JF (2017) Smallholder farmers’ adaptation to climate change and determinants of their adaptation decisions in the Central Rift Valley of Ethiopia. AgricFood Secur 6:24
Bezu S, Holden S (2014) Are rural youth in Ethiopia abandoning agriculture? World Dev 64:259–272
Bizimana C, Nieuwoudt WL, Ferrer SR (2004) Farm size, land fragmentation and economic efficiency in southern Rwanda. Agrekon 43:244–262
Blanco-Canqui H (2013) Crop residue removal for bioenergy reduces soil carbon pools: how can we offset carbon losses? Bioenergy Res 6:358–371
Bongaarts J, Casterline J (2013) Fertility transition: is sub-Saharan Africa different? Popul Dev Rev 38:153–168
Bongaarts J, O’Neill BC (2018) Global warming policy: Is population left out in the cold? Science 361:650–652
Bonsch M, Popp A, Biewald A, Rolinski S, Schmitz C, Weindl I, Dietrich JP (2015) Environmental flow provision: Implications for agricultural water and land-use at the global scale. Glob Environ Change 30:113–132
Brandt M, Rasmussen K, Peñuelas J, Tian F, Schurgers G, Verger A, Fensholt R (2017) Human population growth offsets climate-driven increase in woody vegetation in sub-Saharan Africa. Nat Ecol Evol 1:1–6
Brink AB, Eva HD (2009) Monitoring 25 years of land cover change dynamics in Africa: A sample based remote sensing approach. Appl Geogr 29:501–512
Brockerhoff EG, Barbaro L, Castagneyrol B et al (2017) Forest biodiversity, ecosystem functioning and the provision of ecosystem services. Biodivers Conserv 26:3005–3035
Brown ME, Funk C, Pedreros D, Korecha D, Lemma M, Rowland J, Verdin J (2017) A climate trend analysis of Ethiopia: examining subseasonal climate impacts on crops and pasture conditions. Clim Change 142:169–182
Bruinsma J (2009) The resource outlook to 2050: by how much do land, water and crop yields need to increase by 2050. In: Expert meeting on how to feed the world, pp. 24–26
Bryan E, Deressa TT, Gbetibouo GA, Ringler C (2009) Adaptation to climate change in Ethiopia and South Africa: Options and constraints. Environ Sci Policy 12:413–426
Bryan E, Ringler C, Okoba B, Roncoli C, Silvestri S, Herrero M (2013) Adapting agriculture to climate change in Kenya: Household strategies and determinants. J Environ Manag 114:26–35
Bryant L, Carver L, Butler CD, Anage A (2009) Climate change and family planning: least-developed countries define the agenda. Bull World Health Organ 87:852–857
Castellanos-Navarrete A, Tittonell P, Rufino MC, Giller KE (2015) Feeding, crop residue and manure management for integrated soil fertility management—a case study from Kenya. Agric Syst 134:24–35
Chamberlin J, Jayne TS, Headey D (2014) Scarcity amidst abundance?Reassessing the potential for cropland expansion in Africa. Food Policy 48:51–65
Chen G, Li X, Liu X, Chen Y, Liang X, Leng J, Huang K (2020) Global projections of future urban land expansion under shared socioeconomic pathways. Nat Commun 11:1–12
Google Scholar
Chidumayo EN, Gumbo DJ (2013) The environmental impacts of charcoal production in tropical ecosystems of the world: a synthesis. EnergySustain Dev 17:86–94
Cohen JE (2010) Population and climate change. Proc Am Philos Soc 154:158–182
Cramb RA, Garcia JNM, Gerrits RV, Saguiguit GC (1999) Smallholder adoption of soil conservation technologies: evidence from upland projects in the Philippines. Land Degrad Dev 10:405–423
Crist E, Mora C, Engelman R (2017) The interaction of human population, food production, and biodiversity protection. Science 356:260–264
d’Amour CB, Reitsma F, Baiocchi G, Barthel S, Güneralp B, Erb KH, Seto KC (2017) Future urban land expansion and implications for global croplands. Proc Natl Acad Sci 114(34):8939–8944
Dang HL, Li E, Nuberg I, Bruwer J (2019) Factors influencing the adaptation of farmers in response to climate change: a review. Clim Dev 11:765–774
de Vries FT, Thébault E, Liiri M, Birkhofer K, Tsiafouli MA, Bjørnlund L, Bardgett RD (2013) Soil food web properties explain ecosystem services across European land use systems. Proc Natl Acad Sci 110:14296–14301
DeFries RS, Rudel T, Uriarte M, Hansen M (2010) Deforestation driven by urban population growth and agricultural trade in the twenty-first century. Nat Geosci 3:178–181
deGraaff MA, Hornslein N, Throop HL, Kardol P, van Diepen LT (2019) Effects of agricultural intensification on soil biodiversity and implications for ecosystem functioning: a meta-analysis. Adv Agron 155:1–44
Dejen E, Anteneh W, Vijverberg J (2017) The decline of the Lake Tana (Ethiopia) fisheries: causes and possible solutions. Land Degrad Dev 28:1842–1851
Deressa TT, Hassan RM, Ringler C, Alemu T, Yesuf M (2009) Determinants of farmers’ choice of adaptation methods to climate change in the Nile Basin of Ethiopia. Glob Environ Change 19:248–255
DESA U (2019) World population prospects 2019: highlights. United Nations Department for Economic and Social Affairs
D’Odorico P, Davis KF, Rosa L, Carr JA, Chiarelli D, Dell’Angelo J et al (2018) The global food-energy-water nexus. Rev Geophys 56:456–531
Dodson JC, Dérer P, Cafaro P, Götmark F (2020) Population growth and climate change: addressing the overlooked threat multiplier. Sci Total Environ 748:141346
Döös BR (2002) Population growth and loss of arable land. Glob Environ Chang 12:303–311
Drechsel P, Kunze D, De Vries FP (2001) Soil nutrient depletion and population growth in sub-Saharan Africa: a Malthusian nexus? Popul Environ 22:411–423
Duncan AJ, Bachewe F, Mekonnen K, Valbuena D, Rachier G, Lule D, Erenstein O (2016) Crop residue allocation to livestock feed, soil improvement and other uses along a productivity gradient in Eastern Africa. Agr Ecosyst Environ 228:101–110
Ehrlich PR, Parnell DR, Silbowitz A (1971) The population bomb, vol 68. Ballantine Books
Evans SG, Ge S, Voss CI, Molotch NP (2018) The role of frozen soil in groundwater discharge predictions for warming alpine watersheds. Water Resour Res 54:1599–1615
Fadina AMR, Barjolle D (2018) Farmers’ adaptation strategies to climate change and their implications in the Zou department of South Benin. Environments 5:15
FAO (2010) Global forest resources assessment: progress towards sustainable forest management. FAO
Foley JA, DeFries R, Asner GP, Barford C, Bonan G, Carpenter SR, Helkowski JH (2005) Global consequences of land use. Science 309:570–574
Foley JA, Ramankutty N, Brauman KA, Cassidy ES, Gerber JS, Johnston M, Balzer C (2011) Solutions for a cultivated planet. Nature 478:337–342
Ford JD, Berrang-Ford L, Bunce A, McKay C, Irwin M, Pearce T (2015) The status of climate change adaptation in Africa and Asia. Reg Environ Change 15:801–814
Froese R, Schilling J (2019) The nexus of climate change, land use, and conflicts. Curr Clim Change Rep 5:24–35
Gebere SB, Alamirew T, Merkel BJ, Melesse AM (2016) Land use and land cover change impact on groundwater recharge: the case of lake haramaya watershed, Ethiopia. In: Melesse A, Abitew W (eds) Landscape dynamics, soils and hydrological processes in varied climates. Springer, Cham, pp 93–110
Gebremedhin B, Swinton SM (2003) Investment in soil conservation in northern Ethiopia: the role of land tenure security and public programs. Agric Econ 29:69–84
Geissler S, Hagauer D, Horst A, Krause M, Sutcliffe P (2013) Biomass energy strategy Ethiopia. AMBERO Consult GesellschaftmbH Immanuel-Kant-Str 41:61476
Gezie A, Assefa WW, Getnet B, Anteneh W, Dejen E, Mereta ST (2018) Potential impacts of water hyacinth invasion and management on water quality and human health in Lake Tana watershed, Northwest Ethiopia. Biol Invasions 20:2517–2534
Gill RJ, Baldock KC, Brown MJ, Cresswell JE, Dicks LV, Fountain MT, Ollerton J (2016) Protecting an ecosystem service: approaches to understanding and mitigating threats to wild insect pollinators. Adv Ecol Res 54:135–206
Gleeson T, VanderSteen J, Sophocleous MA, Taniguchi M, Alley WM, Allen DM, Zhou Y (2010) Groundwater sustainability strategies. Nat Geosci 3:378–379
Gliessman SR (2014) Agroecology: the ecology of sustainable food systems. CRC Press
Book Google Scholar
Godfray HCJ, Beddington JR, Crute IR, Haddad L, Lawrence D, Muir JF et al (2010) Food security: the challenge of feeding 9 billion people. Science 327:812–818
Gomiero T (2016) Soil degradation, land scarcity and food security: Reviewing a complex challenge. Sustainability 8(3):281
Grassini P, Eskridge KM, Cassman KG (2013) Distinguishing between yield advances and yield plateaus in historical crop production trends. Nat Commun 4:2918
Güneralp B, Lwasa S, Masundire H, Parnell S, Seto KC (2017) Urbanization in Africa: challenges and opportunities for conservation. Environ Res Lett 13(1):015002
Headey DD, Jayne TS (2014) Adaptation to land constraints: Is Africa different? Food Policy 48:18–33
United Nations, Department of Economic and Social Affairs, Population Division (2019) World Population Prospects 2019: Highlights (ST/ESA/SER.A/423)
Huang CW, McDonald RI, Seto KC (2018) The importance of land governance for biodiversity conservation in an era of global urban expansion. Landsc Urban Plan 173:44–50
Hütsch BW, Schubert S (2018) Maize harvest index and water use efficiency can be improved by inhibition of gibberellin biosynthesis. J Agron Crop Sci 204:209–218
Jha S, Bawa KS (2006) Population growth, human development, and deforestation in biodiversity hotspots. Conserv Biol 20:906–912
Jiang L, Hardee K (2011) How do recent population trends matter to climate change? Popul Res Policy Rev 30:287–312
Jinji N (2006) International trade and terrestrial open-access renewable resources in a small open economy. Can J Econ/Revue canadienne d’économique 39(3):790–808
Jones DL, Cross P, Withers PJ, DeLuca TH, Robinson DA, Quilliam RS, Edwards-Jones G (2013) Nutrient stripping: the global disparity between food security and soil nutrient stocks. J Appl Ecol 50:851–862
Josephson AL, Ricker-Gilbert J, Florax RJ (2014) How does population density influence agricultural intensification and productivity? Evidence from Ethiopia. Food Policy 48:142–152
Kah HK (2017) ‘Boko Haram is losing, but so is food production’: conflict and food insecurity in Nigeria and Cameroon. Afr Dev 42:177–196
Kastner T, Erb KH, Haberl H (2014) Rapid growth in agricultural trade: effects on global area efficiency and the role of management. Environ Res Lett 9(3):034015
Kehoe L, Romero-Muñoz A, Polaina E, Estes L, Kreft H, Kuemmerle T (2017) Biodiversity at risk under future cropland expansion and intensification. Nat Ecol Evol 1:1129–1135
Khan MN, Mohammad F (2014) Eutrophication: challenges and solutions. In: Ansari A, Gill S (eds) Eutrophication: causes, consequences and control. Springer, Dordrecht pp 1–15
Kopittke PM, Menzies NW, Wang P, McKenna BA, Lombi E (2019) Soil and the intensification of agriculture for global food security. Environ Int 132:105078
Lal R (2004) Soil carbon sequestration impacts on global climate change and food security. Science 304:1623–1627
Latruffe L, Piet L (2014) Does land fragmentation affect farm performance? A case study from Brittany, France. Agric Syst 129:68–80
Laurance WF, Sayer J, Cassman KG (2014) Agricultural expansion and its impacts on tropical nature. Trends Ecol Evol 29:107–116
Leichenko R, Silva JA (2014) Climate change and poverty: vulnerability, impacts, and alleviation strategies. Wiley Interdiscipl Rev Clim Change 5:539–556
Li X, Panke-Buisse K, Yao X, Coleman-Derr D, Ding C, Wang X, Ruan H (2020) Peanut plant growth was altered by monocropping-associated microbial enrichment of rhizospheremicrobiome. Plant Soil 446:655–669
Liao H, Cao HS (2013) How does carbon dioxide emission change with the economic development? Statistical experiences from 132 countries. Glob Environ Change 23:1073–1082
Liverpool-Tasie LSO, Omonona BT, Sanou A, Ogunleye WO (2017) Is increasing inorganic fertilizer use for maize production in SSA a profitable proposition? Evidence from Nigeria. Food Policy 67:41–51
Liyanage CP, Yamada K (2017) Impact of population growth on the water quality of natural water bodies. Sustainability 9:1405
López-Carr D, Burgdorfer J (2013) Deforestation drivers: population, migration, and tropical land use. Environ Sci Policy Sustain Dev 55:3–11
Maguza-Tembo F, Mangison J, Edris AK, Kenamu E (2017) Determinants of adoption of multiple climate change adaptation strategies in Southern Malawi: an ordered probit analysis. J Dev Agric Econ 9:1–7
McCann JC (1997) The plow and the forest: narratives of deforestation in Ethiopia, 1840–1992. Environ Hist 2:138–159
Mekuriaw A, Heinimann A, Zeleke G, Hurni H (2018) Factors influencing the adoption of physical soil and water conservation practices in the Ethiopian Highlands. Int Soil Water Conserv Res 6:23–30
Mertz O, Ravnborg HM, Lövei GL, Nielsen I, Konijnendijk CC (2007) Ecosystem services and biodiversity in developing countries. Biodivers Conserv 16:2729–2737
Molotoks A, Stehfest E, Doelman J, Albanito F, Fitton N, Dawson TP, Smith P (2018) Global projections of future cropland expansion to 2050 and direct impacts on biodiversity and carbon storage. Glob Change Biol 24:5895–5908
Mueller ND, Gerber JS, Johnston M, Ray DK, Ramankutty N et al (2012) Closing yield gaps: nutrient and water management to boost crop production. Nature 490:254–257
Mugizi FM, Matsumoto T (2020) Population pressure and soil quality in Sub-Saharan Africa: Panel evidence from Kenya. Land Use Policy 94:104499
Mugizi FM, Matsumoto T (2021) A curse or a blessing? Population pressure and soil quality in Sub-Saharan Africa: Evidence from rural Uganda. Ecol Econ 179:106851
Murtaugh PA, Schlax MG (2009) Reproduction and the carbon legacies of individuals. Glob Environl Change 19:14–20
Nagayets, O. (2005). Small farms: current status and key trends. The future of small farms, 355
Nguyen TM, Bressac C, Chevrier C (2013) Heat stress affects male reproduction in a parasitoid wasp. J Insect Physiol 59:248–254
Ngwira S, Watanabe T (2019) An analysis of the causes of deforestation in Malawi: a case of Mwazisi. Land 8(3):48
Niroula GS, Thapa GB (2005) Impacts and causes of land fragmentation, and lessons learned from land consolidation in South Asia. Land use policy 22:358–372
Noack F, Larsen A (2019) The contrasting effects of farm size on farm incomes and food production. Environ Res Lett 14(8):084024
Okello C, Tomasello B, Greggio N, Wambiji N, Antonellini M (2015) Impact of population growth and climate change on the freshwater resources of Lamu Island, Kenya. Water 7:1264–1290
Olivier JG, Schure KM, Peters JAHW (2017) Trends in global CO2 and total greenhouse gas emissions. PBL Netherlands Environmental Assessment Agency, p 5
Ordway EM, Asner GP, Lambin EF (2017) Deforestation risk due to commodity crop expansion in sub-Saharan Africa. Environ Res Lett 12(4):044015
Osman KT (2018) Management of soil problems. Springer
Oyetunji PO, Ibitoye OS, Akinyemi GO, Fadele OA, Oyediji OT (2020) The Effects of Population Growth on Deforestation in Nigeria: 1991–2016. J Appl Sci Environ Manag 24:1329–1334
Paul M, waGĩthĩnji M (2017) Small farms, smaller plots: land size, fragmentation, and productivity in Ethiopia. J Peasant Stud 45:757–775
Pearson TR, Brown S, Murray L, Sidman G (2017) Greenhouse gas emissions from tropical forest degradation: an underestimated source. Carbon Balance Manag 12:3
Perrings C, Halkos G (2015) Agriculture and the threat to biodiversity in sub-saharan Africa. Environ Res Lett 10:095015
Plusquellec H (2009) Modernization of large-scale irrigation systems: Is it an achievable objective or a lost cause. Irrig Drain 58:104–120
Rahman S, Rahman M (2009) Impact of land fragmentation and resource ownership on productivity and efficiency: The case of rice producers in Bangladesh. Land Use Policy 26:95–103
Rapsomanikis G (2015) The economic lives of smallholder farmers: An analysis based on household data from nine countries. Food and Agriculture Organization of the United Nations
Ray DK, Mueller ND, West PC, Foley JA (2013) Yield trends are insufficient to double global crop production by 2050. PLoS ONE 8:e66428
Reardon T, Vosti SA (1995) Links between rural poverty and the environment in developing countries: asset categories and investment poverty. World Dev 23:1495–1506
Reddy SRC, Chakravarty SP (1999) Forest dependence and income distribution in a subsistence economy: evidence from India. World Dev 27:1141–1149
Rudel TK (2013) The national determinants of deforestation in sub-Saharan Africa. Philos Trans R Soc Lond B Biol Sci 368(1625):20120405
Sanchez PA, Shepherd KD, Soule MJ, Place FM, Buresh RJ, Izac AMN, Woomer PL (1997) Soil fertility replenishment in Africa: an investment in natural resource capital. Repl Soil Fertil Afr 51:1–46
Seto KC, Güneralp B, Hutyra LR (2012) Global forecasts of urban expansion to 2030 and direct impacts on biodiversity and carbon pools. Proc Natl Acad Sci 109:16083–16088
Smith P, Gregory PJ, Van Vuuren D, Obersteiner M, Havlík P, Rounsevell M, Bellarby J (2010) Competition for land. Philos Trans R Soc Lond B Biol Sci 365:2941–2957
Smith P, House JI, Bustamante M, Sobocká J, Harper R, Pan G, andPaustian, K. (2016) Global change pressures on soils from land use and management. Glob Change Biol 22:1008–1028
Snyder H (2019) Literature review as a research methodology: An overview and guidelines. J Bus Res 104:333–339
Stephenson J, Newman K, Mayhew S (2010) Population dynamics and climate change: what are the links? J Public Health 32:150–156
Surya B, Syafri S, Sahban H, Sakti HH (2020) Natural Resource conservation based on community economic empowerment: perspectives on watershed management and slum settlements in Makassar City, South Sulawesi. Indonesia Land 9(4):104
Tilman D, Balzer C, Hill J, Befort BL (2011) Global food demand and the sustainable intensification of agriculture. Proc Natl Acad Sci 108:20260–20264
Tole L (1998) Sources of deforestation in tropical developing countries. Environ Manag 22:19–33
Toth G, Szigeti C (2016) The historical ecological footprint: From over-population to over-consumption. Ecol Ind 60:283–291
Tran TQ, Van Vu H (2019) Land fragmentation and household income: First evidence from rural Vietnam. Land Use Policy 89:104247
Tritsch I, Le Tourneau FM (2016) Population densities and deforestation in the Brazilian Amazon: New insights on the current human settlement patterns. Appl Geogr 76:163–172
Trivedi P, Delgado-Baquerizo M, Anderson IC, Singh BK (2016) Response of soil properties and microbial communities to agriculture: implications for primary productivity and soil health indicators. Front Plant Sci 7:990
Tscharntke T, Clough Y, Wanger TC, Jackson L, Motzke I, Perfecto I, Whitbread A (2012) Global food security, biodiversity conservation and the future of agricultural intensification. Biol Cons 151:53–59
United Nations Educational Scientific and Cultural Organization (UNESCO) (2003) Water for People, Water for Life: The United Nations World Water Development Report
Urdal H (2008) Population, resources, and political violence: A subnational study of India, 1956–2002. J Conflict Resolut 52:590–617
Van Ittersum MK, Van Bussel LG, Wolf J, Grassini P, Van Wart J, Guilpart N, Yang H (2016) Can sub-Saharan Africa feed itself? Proc Natl Acad Sci 113:14964–14969
Vanlauwe B, Six J, Sanginga N, Adesina AA (2015) Soil fertility decline at the base of rural poverty in sub-Saharan Africa. Nat Plants 1:1–1
Verma P, Raghubanshi AS (2019) Rural development and land use land cover change in a rapidly developing agrarian South Asian landscape. Remote Sens ApplSoc Environ 14:138–147
Vesco P, Dasgupta S, De Cian E, Carraro C (2020) Natural resources and conflict: A meta-analysis of the empirical literature. Ecol Econ 172:106633
Walie SD (2015) Perception of farmers toward physical soil and water conservation structures in Wyebla Watershed, Northwest Ethiopia. Acad J Plant Sci 7:34–40
Walsh BS, Parratt SR, Hoffmann AA, Atkinson D, Snook RR, Bretman A, Price TA (2019) The impact of climate change on fertility. Trends Ecol Evol 34:249–259
Wetzel WC, Kharouba HM, Robinson M, Holyoak M, andKarban, R. (2016) Variability in plant nutrients reduces insect herbivore performance. Nature 539:425–427
Win ZC, Mizoue N, Ota T, Kajisa T, Yoshida S (2018) Consumption rates and use patterns of firewood and charcoal in urban and rural communities in Yedashe Township. Myanmar For 9:429
Wong G, Greenhalgh T, Westhorp G, Buckingham J, Pawson R (2013) RAMESES publication standards: Meta-narrative reviews. J Adv Nurs 69(5):987–1004
WWF (2018) Living planet report-2018. In: Grooten M, Almond REA (eds) Aiming higher. WWF
Yadav DS, Sood P, Sharma LK, Sharma K (2018) Smart farming secures livelihood: a case study of small farm from Himachal Pradesh. Int J Farm Sci 8:94–99
Yonas B, Beyene F, Negatu L, Abdeta A (2013) Influence of resettlement on pastoral land use and local livelihoods in southwest Ethiopia. Trop Subtrop Agroecosyst 16(1):103–117
Zegeye H (2017) Major drivers and consequences of deforestation in Ethiopia: implications for forest conservation. Asian J Sci Technol 8:5166–5175
Zhao ZH, Hui C, He DH, Li BL (2015) Effects of agricultural intensification on ability of natural enemies to control aphids. Sci Rep 5:8024
Zilverberg C, Kreuter U, Conner R (2009) Population growth and fertilizer use: ecological and economic consequences in Santa Cruz del Quiché, Guatemala. Soc Nat Resour 23:1–13
Download references
Author information
Authors and affiliations.
School of Natural Resource Management and Environmental Sciences, College of Agriculture and Environmental Sciences, Haramaya University, Haramaya, Ethiopia
Mengistu M. Maja & Samuel F. Ayano
You can also search for this author in PubMed Google Scholar
Corresponding author
Correspondence to Mengistu M. Maja .
Ethics declarations
Conflict of interest.
No conflict of interest.
Rights and permissions
Reprints and permissions
About this article
Maja, M.M., Ayano, S.F. The Impact of Population Growth on Natural Resources and Farmers’ Capacity to Adapt to Climate Change in Low-Income Countries. Earth Syst Environ 5 , 271–283 (2021). https://doi.org/10.1007/s41748-021-00209-6
Download citation
Received : 10 October 2020
Accepted : 08 March 2021
Published : 16 March 2021
Issue Date : June 2021
DOI : https://doi.org/10.1007/s41748-021-00209-6
Share this article
Anyone you share the following link with will be able to read this content:
Sorry, a shareable link is not currently available for this article.
Provided by the Springer Nature SharedIt content-sharing initiative
- Developing countries
- Population growth
- Natural resources
- Sustainability
- Find a journal
- Publish with us
- Track your research
Population explosion demands thoughtful response
With the world’s population projected to reach a staggering 9.3 billion by 2050, it’s imperative that there be a thoughtful and vigorous response to the challenges posed by such demographic upheaval, says David Bloom , HSPH professor of economics and demography and chair of the Department of Global Health and Population .
In a syndicated commentary, Bloom writes that the world is likely to boost its population by almost as many people as populated the entire planet in 1950. Developing countries will suffer most, he predicts. Massive unemployment or underemployment could lead to suffering and catastrophe. Cross-country income inequality could deter international cooperation. The depletion of environmental resources could be accelerated.
Rich countries face their own set of problems, such as a surging proportion of elderly people in their populations, Bloom writes.
The challenges posed by the coming population explosion are surmountable, he says, but cautions, “It would be irresponsible to neglect those challenges and submit humankind, unnecessarily, to the great perils that we can already reliably foresee.”
Read the commentary on CNN
World Population to Surpass 7 Billion in 2011 (HSPH release)
Academia.edu no longer supports Internet Explorer.
To browse Academia.edu and the wider internet faster and more securely, please take a few seconds to upgrade your browser .
Enter the email address you signed up with and we'll email you a reset link.
- We're Hiring!
- Help Center

POPULATION EXPLOSION AND ITS IMPACT ON DEVELOPMENT: A SOCIOLOGICAL STUDY

It is well quoted that “ati sarvatra varyet” that means excess of anything is bad. As in this present scenario also excessive growth and increment in population will eventually going to led bad consequences. And every action has reaction so this action of uncontrolled population will be going to led unlimited social problems. Since, social change refers to the transformation of culture, behavior, social institutions, and social structure over time. This problem of population explosion is going to led drastic social changes like whole societal structure will be going to be affected. So, population explosion is basically sudden or uncontrolled increase in growth of population. In this whole world this sociological phenomenon was majorly started after world war II and in India it get more prominent and highlighted issue after independence era . As corpus of modern demography was focused on this topic of doomsday scenario of population explosion. The question considered here is as follows- • How population explosion does is quite focused phenomena in demography? • How does different factors like economic growth, human welfare and the natural environment are affected by it? • What are the factors responsible for this drastic change bringing phenomenon? • What are the factors responsible for this population explosion problem? • What can be different solution for this problem? In conclusion I can say that “middle range” research on tractable research questions might led to a more productive and cumulative research literature.
Related Papers
International Research Journal Commerce arts science
Rapid growth of population is one of the most significant problems that modern world faces today, though Malthus warned of it in 1798. The consequences of this problem have not remained confined to economic sphere but extended equally to the political and social aspects of life. Worldwide interest in the problems emerging from rapid population growth has been taken by two major considerations: an increasing concern about the relation between population growth and available resources and growing awareness that unrestricted population growth tends to impose a strong constraint on the standard of living and even survival of mankind. To quote Gunnar Myrdal " no other factor-nor even that of peace or war – is so tremendously fatal for the long time destinies of democracies as the factor of population ". 1 Population as a human problem appears in various forms in different parts of the world depending on the size of population, density, state of industrialization, availability of resources, distribution of community resources and several other factors in various cultures. But, looking at it " s nature and dimensions with a view of taking action, it stands as a matter of equal concern everywhere. Infact, the problemof population explosion is alarming almost everywhere in the less-developed parts of the world. Due to this problem, most of these countries are faced with the crucial problems of living standards, social, economical and educational concern. Inspite of the efforts by many nations to control their population, it has been steadily going up. Whatever little progress is made by these countries is almost negated by the growing population. Interest in such questions is widespread but only interest is not enough. This serious problem cannot be answered by merely counting up the number of births and deaths in successive years and different countries but we have to take concrete steps and have to share joint responsibility in order to control the unprecedented growth of population. In context of the above, during the last few decadesscholars belonging to various disciplines all over the world have devoted much time and energy in investigating the various aspects of population problem, in finding its impact on human welfare and in projecting it " s implications for human survival on this planet. A large number of surveys and research studies have been conducted on the subject in different parts of the world. National governments and international agencies are showing great concern over the problem of population explosion and with their help national and international conferences have been frequently organized. All this is done to work out a strategy to prevent the impending crisis. The answer of the population problem lies in
Zohair Ahmed
Uttara Maity
THE PAPER IS ABOUT HOW SIZE OF GLOBAL POPULATION CREATING DAMAGE TO THE NATURAL ENVIRONMENT & HOW DEVELOPMENT IS BEING HAMPERED.
Tanima Choudhuri
Marthy John Dizon
Biswajit Ghosh
Indus Foundation International Journals UGC Approved
Persons are resources as well as split ends of economic development. They are an asset if in ample strength and prove to be a burden if excess in strength. Population has traversed the optimal limit in India and has grown to be a liability. Overpopulation has been major dilemma in India. The efforts to remove the nuisance of population problem have only been partially effective. In significance the rate of population increase has gone down, but the sense of balance between the optimum population growth and a healthy nation is far to be attained. Unhealthy living, lack of knowledge, illiteracy, and lack of appropriate recreation have remained the basis of population trouble in India. The chief endeavor of this effort is to stumble on the effects of hasty population growth on economic development of India. This is very important because India is second most populated country in the world and many studies show that India will leave behind china soon based on the population growth rate in both of these countries. So the study of relationship between these variables may help the government to think about the effect of population growth on their policies in upcoming or future.
Science Activities: Classroom Projects and Curriculum Ideas
Egyptian STEM schools
Mina Eskandar
Over-population is a great Problem for many countries. This research looks into all possible solutions for this problem. World population has jumped from about 2.5 billion in 1951 to 7.8 billion in April 2020 , 212% increase. Over-population has been an issue for many countries especially in Africa, as Africa has the highest fertility rate ,children per woman, and Africans are low on resources especially for those who live in the middle of Africa ,in other words, near the equator, Because of its hot weather and being low on water, it is optimum environment for spreading diseases and droughts which its direct relation to overpopulation was later discovered resulting in lack of resources and slowness of economy development. Human Resources management has important terminology which need to be understood before getting into our main topic: fertility rate is the average children per woman, birth rate is the average number of children born per year and death rate is the number of deaths per year, natural change is the birth rate minus the death rate . Social Scientists have many theories on what causes over-population, Some suggest that poverty is the main cause of over-population as it is seen in most poor countries like in Africa unlike rich countries in Europe. They suggest that families try to overcome their poor condition by having more children. But other scientists argue that it can be correlation and something else is causing both of them. They suggest that it is a high death rates. Also, through comparing between poor Countries and rich Countries, it can be notice that in poor countries, death rates are high as of that most families give birth to many children. There are other suggested causes like lack of education and child labor. Over-population can cause many serious problems especially for poor countries. For example, It can cause lack of water in developing countries because as the population grow, water consumption increases. For countries that do not have a fresh stable water source, This can lead to droughts and lower life expectancy. Also, population growth could cause Extinction of wild life and pollution because forests and natural environments for various animals are cut down to free more space for buildings and cities. green house effect was learned in (CH.2.11) about and learned In (ES.2.10) about the role of plants in stabilizing the carbon dioxide percentage and the role of forest in keeping biodiversity in (BI.2.12). For These reasons, Countries tried to solve this issue, because of its significant impact on the economy and the productivity. Some of these solutions were the “one-child-policy” and “two-child-policy” tried by China to control population growth using the law. The Results of them were very fast. Other places tried to control over-population by focusing on education especially for girls like in Europe in the 19 th century. To conclude, This research will focus on these prior solutions and others and discuss why they work.
Miguel Dos Santos
Is rapid global population growth a cause for alarm? In this essay I will show that global population growth is not a cause for alarm, but just another challenge that must be faced in the development of human thinking, creativity and society.
RELATED PAPERS
Filip Madalin
Journal of Fluids Engineering
James J Riley
Indian Journal of Chemical Technology
Suresh Nath
Rádios Comunitárias em Tempos Digitais
Bruno C Vianna
Biology Letters
Michael Lattorff
Journal of Social Policy
Tony Bovaird
Cahiers de géographie du Québec
Joana SEGUI PONS
Biomedicines
Irina Nazarenko
Nature genetics
Journal of Nuclear Materials
Erdin Bozkurt
Journal of Intelligent Material Systems and Structures
Igor Zeidis
Clemente de Jesús García Avila
International journal of nursing studies
Frances Lin
Journal of the American Chemical Society
Mrinmoy Nag
Kesit akademi dergisi
Anton Didikin
Preventive medicine
Sherri Gorin
Jean-marc Simon
Learning Disability Quarterly
Cevriye Ergul
rtytrewer htytrer
Journal of Food Science and Technology
Ramón Moreira
Nazir Khan Mohammadi
Andrew G Norman
See More Documents Like This
- We're Hiring!
- Help Center
- Find new research papers in:
- Health Sciences
- Earth Sciences
- Cognitive Science
- Mathematics
- Computer Science
- Academia ©2024
Europe PMC requires Javascript to function effectively.
Either your web browser doesn't support Javascript or it is currently turned off. In the latter case, please turn on Javascript support in your web browser and reload this page.
Search life-sciences literature (43,868,772 articles, preprints and more)
- Free full text
- Citations & impact
- Similar Articles
The world population explosion: causes, backgrounds and -projections for the future.
Author information, affiliations.
- Van Bavel J 1
Facts, Views & Vision in Obgyn , 01 Jan 2013 , 5(4): 281-291 PMID: 24753956 PMCID: PMC3987379
Abstract
Free full text , the world population explosion: causes, backgrounds and projections for the future, j. van bavel.
Centre for Sociological Research / Family & Population Studies (FaPOS), Faculty of Social Sciences, University of Leuven, Parkstraat 45 bus 3601, 3000 Leuven, Belgium.
At the beginning of the nineteenth century, the total world population crossed the threshold of 1 billion people for the first time in the history of the homo sapiens sapiens. Since then, growth rates have been increasing exponentially, reaching staggeringly high peaks in the 20th century and slowing down a bit thereafter. Total world population reached 7 billion just after 2010 and is expected to count 9 billion by 2045. This paper first charts the differences in population growth between the world regions. Next, the mechanisms behind unprecedented population growth are explained and plausible scenarios for future developments are discussed. Crucial for the long term trend will be the rate of decline of the number of births per woman, called total fertility. Improvements in education, reproductive health and child survival will be needed to speed up the decline of total fertility, particularly in Africa. But in all scenarios, world population will continue to grow for some time due to population momentum. Finally, the paper outlines the debate about the consequences of the population explosion, involving poverty and food security, the impact on the natural environment, and migration flows.
Key words: Fertility, family planning, world population, population growth, demographic transition, urbanization, population momentum, population projections.
- Introduction
In the year 1900, Belgium and the Philippines had more or less the same population, around 7 million people. By the year 2000, the population of the Western European monarchy had grown to 10 million citizens, while the South East Asian republic at the turn of the century already counted 76 million citizens. The population of Belgium has since then exceeded 11 million citizens, but it is unlikely that this number will rise to 12 million by the year 2050. The population of the Philippines on the other hand will continue to grow to a staggering 127 million citizens by 2050, according to the demographic projections of the United Nations (UN 2013).
The demographic growth rate of the Philippines around the turn of the century (2% a year) has already created enormous challenges and is clearly unsustainable in the long term: such growth implies a doubling of the population every 35 years as a consequence of which there would be 152 million people by 2035, 304 million by 2070, and so on. Nobody expects such a growth to actually occur. This contribution will discuss the more realistic scenarios for the future.
Even the rather modest Belgian demographic growth rate around the turn of this century (0.46%) is not sustainable in the long term. In any case, it exceeds by far the average growth rate of the human species (homo sapiens sapiens) that arose in Africa some 200.000 years ago. Today, earth is inhabited by some 7 billion people. To achieve this number in 200.000 years, the average yearly growth rate over this term should have been around 0.011% annually (so 11 extra human beings per 1.000 human beings already living on earth). The current Belgian growth rate would imply that our country would have grown to 7 billion in less than 1500 years.
The point of this story is that the current growth numbers are historically very exceptional and untenable in the long term. The demographic growth rates are indeed on the decline worldwide and this paper will attempt to explain some of the mechanisms behind that process. That doesn’t change the fact, however, that the growth remains extraordinarily high and the decline in some regions very slow. This is especially the case in Sub Saharan Africa. In absolute numbers, the world population will continue to grow anyway for quite some time as a result of demographic inertia. This too will be further clarified in this paper.
- The evolution of the world population in numbers
In order to be sustainable, the long term growth rate of the population should not differ much from 0%. That is because a growth rate exceeding 0% has exponential implications. In simple terms: if a combination of birth and growth figures only appears to cause a modest population growth initially, then this seems to imply an explosive growth in the longer term.
Thomas R. Malthus already acquired this point of view by the end of the 18th century. In his famous “Essay on the Principle of Population” (first edition in 1789), Malthus argues justly that in time the growth of the population will inevitably slow down, either by an increase of the death rate or by a decrease of the birth rate. On a local scale, migration also plays an important role.
It is no coincidence that Malthus’ essay appeared in England at the end of the 18th century. After all, the population there had started to grow at a historically unseen rate. More specifically the proletariat had grown immensely and that worried the intellectuals and the elite. Year after year, new demographic growth records were recorded.
At the beginning of the 19th century, the number of 1 billion people was exceeded for the first time in history. Subsequently growth accelerated and the number of 2 billion people was already surpassed around 1920. By 1960, another billion had been added, in 40 instead of 120 years time. And it continued to go even faster: 4 billion by 1974, 5 billion by 1987, 6 billion by 1999 and 7 billion in 2011 ( Fig. 1 ).

This will certainly not stop at the current 7 billion. According to the most recent projections by the United Nations, the number of 8 billion will probably be exceeded by 2025, and around 2045 there will be more than 9 billion people 1 . The further one looks into the future, the more uncertain these figures become, and with demography on a world scale one must always take into account a margin of error of a couple of tens of millions. But according to all plausible scenarios, the number of 9 billion will be exceeded by 2050.
Demographic growth was and is not equally distributed around the globe. The population explosion first occurred on a small scale and with a relatively moderate intensity in Europe and America, more or less between 1750 and 1950. From 1950 on, a much more substantial and intensive population explosion started to take place in Asia, Latin America and Africa ( Fig. 2 ). Asia already represented over 55% of the world population in 1950 with its 1.4 billion citizens and by the year 2010 this had increased to 4.2 billion people or 60%. Of those people, more than 1.3 billion live in China and 1.2 billion in India, together accounting for more than one third of the world population.

In the future, the proportion of Asia will come down and that of Africa will increase. Africa was populated by some 230 million people around 1950, or 9% of the world population. In 2010 there were already more than 1 billion Africans or 15% of the world population. According to UN projections, Africa will continue to grow at a spectacular rate up to 2.2 billion inhabitants in 2050 or 24% of the world population. The proportion of Europe, on the other hand, is evolving in the opposite direction: from 22% of the world population in 1950, over 11% in 2010 to an expected mere 8% in 2050. The population of Latin America has grown and is growing rapidly in absolute terms, but because of the strong growth in Asia and especially Africa, the relative proportion of the Latin American population is hardly increasing (at most from 6 to 8%). The proportion of the population in North America, finally, has decreased slightly from 7 to 5% of the world population.
What these figures mainly come down to in practice is that the population size in especially the poor countries is increasing at an unprecedented rate. At the moment, more than 5.7 billion people, or more than 80% of humanity, are living in what the UN categorise as a developing country. By 2050, that number would – according to the projections – have increased to 8 billion people or 86% of the world population. Within this group of developing countries, the group of least developed countries, the poorest countries so to speak, is growing strongly: from 830 million now, up to an expected 1.7 billion in 2050. This comprises very poor countries such as Somalia, Sudan, Liberia, Niger or Togo in Africa; Afghanistan, Bangladesh or Myanmar in Asia; and Haiti in the Caribbean.
The growth of the world population goes hand in hand with global urbanisation: while around the year 1950 less than 30% of people lived in the cities, this proportion has increased to more than 50%. It is expected that this proportion will continue to grow to two thirds around 2050. Latin America is the most urbanised continent (84%), closely followed by North America (82%) and at a distance by Europe (73%). The population density has increased intensely especially in the poorest countries: from 9 people per square km in 1950 to 40 people per square km in 2010 (an increase by 330%) in the poorest countries, while this figure in the rich countries increased from 15 to 23 people per square km (a 50% growth). In Belgium, population density is 358 people per square km and in the Netherlands 400 people per square km; in Rwanda this number is 411, in the Palestinian regions 666 and in Bangladesh an astonishing 1050.
Although the world population will continue to grow in absolute figures for some time – a following paragraph will explain why – the growth rate in percentages in all large world regions is decreasing. In the richer countries, the yearly growth rate has already declined to below 0.3%. On a global scale, the yearly growth rate of more than 2% at the peak around 1965 decreased to around 1% now. A further decline to less than 0.5% by 2050 is expected. In the world’s poorest countries, the demographic growth is still largest: at present around 2.2%. For these countries, a considerable decrease is expected, but the projected growth rate would not fall below 1.5% before 2050. This means, as mentioned above, a massive growth of the population in absolute figures in the world’s poorest countries.
- Causes of the explosion: the demographic transition
The cause of, first, the acceleration and, then, the deceleration in population growth is the modern demographic transition: an increasingly growing group of countries has experienced a transition from relatively high to low birth and death rates, or is still in the process of experiencing this. It is this transition that is causing the modern population explosion. Figure 3 is a schematic and strongly simplified representation of the modern demographic transition.

In Europe, the modern demographic transition started to take place in the middle of the 18th century. Until then, years of extremely high death rates were quite frequent. Extremely high crisis mortality could be the consequence of epidemic diseases or failed harvests and famine, or a combination of both. As a consequence of better hygiene and a better transportation infrastructure (for one, the canals and roads constructed by Austria in the 18th century), amongst other reasons, crisis mortality became less and less frequent. Later on in the 19th century, child survival began to improve. Vaccination against smallpox for example led to an eradication of the disease, with the last European smallpox pandemic dating from 1871. This way, not only the years of crisis mortality became less frequent, but also the average death rate decreased, from an average 30 deaths per 1000 inhabitants in the beginning of the 19th century to around 15 deaths per 1000 citizens by the beginning of the 20th century. In the meantime, the birth rate however stayed at its previous, high level of 30-35 births per 1000 inhabitants.
The death rate went down but the birth rate still didn’t: this caused a large growth in population. It was only near the end of the nineteenth century (a bit earlier in some countries, later in others) that married couples in large numbers started to reduce their number of children. By the middle of the 20th century, the middle class ideal of a two children household had gained enormous popularity and influence. The reaction by the Church, for example in the encyclical Humanae Vitae (1968), came much too late to bring this evolution to a halt.
As a consequence of widespread family planning – made even easier in the sixties by modern hormonal contraceptives – the birth rate started declining as well and the population tended back towards zero growth. Nowadays the end of this transition process has been more than achieved in all European countries, because the fertility has been below replacement level for several decades (the replacement level is the fertility level that would in the long term lead to a birth rate identical to the death rate, if there would be no migration) 2 .
That the population explosion in the developing countries since the second half of the 20th century was so much more intense and massive, is a consequence of the fact that in those countries, the process of demographic transition occurred to a much more extreme extent and on a much larger scale. On the one hand, mortality decreased faster than in Europe. After all, in Europe the decline in mortality was the result of a gradual understanding of the importance of hygiene and afterwards the development of new medical insights. These insights of course already existed at the start of the demographic transitions in Asian, Latin American and African regions, whereby the life expectancy in these regions could grow faster. On the other hand, the total fertility – the average number of children per woman – at the start of the transition was a lot higher in many poor regions than it initially was in Europe. For South Korea, Brasil and the Congo, for example, the total fertility rate shortly after the Second World War (at the start of their demographic transition) is estimated to be 6 children per woman. In Belgium this number was close to 4.5 children per woman by the middle of the nineteenth century. In some developing regions, the fertility and birth rate decreased moderately to very fast, but in other regions this decline took off at an exceptionally sluggish pace – this will be further explained later on. As a consequence of these combinations of factors, in most of these countries the population explosion was much larger than it had been in most European countries.
- Scenarios for the future
Nonetheless, the process of demographic transition has reached its second phase in almost all countries in the world, namely the phase of declining fertility and birth rates. In a lot of Asian and Latin American countries, the entire transition has taken place and the fertility level is around or below the replacement level. South Korea for example is currently at 1.2 children per woman and is one of the countries with the lowest fertility levels in the world. In Iran and Brasil the fertility level is currently more or less equal to Belgium’s, that is 1.8 to 1.9 children per woman.
Crucial to the future evolution of the population is the further evolution of the birth rate. Scenarios for the future evolution of the size and age of the population differ according to the hypotheses concerning the further evolution of the birth rate. The evolution of the birth rate is in turn dependent on two things: the further evolution of the total fertility rate (the average number of children per woman) in the first place and population momentum in the second. The latter is a concept I will later on discuss in more detail. The role of the population momentum is usually overlooked in the popular debates, but is of utmost importance in understanding the further evolution of the world population. Population momentum is the reason why we are as good as certain that the world population will continue to grow for a while. The other factor, the evolution of the fertility rate, is much more uncertain but of critical importance in the long term. The rate at which the further growth of the world population can be slowed down is primarily dependent on the extent to which the fertility rates will continue to decline. I will further elaborate on this notion in the next paragraph. After that, I will clarify the notion of population momentum.
- Declining fertility
Fertility is going down everywhere in the world, but it’s going down particularly slowly in Africa. A further decline remains uncertain there. Figure 4 shows the evolution per world region between 1950 and 2010, plus the projected evolution until 2050. The numbers before 2010 illustrate three things. First of all, on all continents there is a decline going on. Secondly, this decline is not equal everywhere. And thirdly: the differences between the continents remain large in some cases. Asia and Latin America have seen a similar decline in fertility: from 5.9 children per woman in 1950 to 2.5 at the start of the 21st century. Europe and North America had already gone through the largest part of their demographic transition by the 1950’s. Their fertility level has been below replacement levels for years. Africa has indeed seen a global decrease of fertility, but the average number of children is still at an alarmingly high level: the fertility merely decreased from 6.7 to 5.1 children per woman.

These continental averages hide a huge underlying diversity in fertility paths. Figure 5 attempts to illustrate this for a number of countries. Firstly let us consider two African countries: the Congo and Niger. As was often the case in Europe in the 19th century, fertility was first on the rise before it started declining. In the Congo this decrease was more extensive, from around 6 children in 1980 to 4 children per woman today, and a further decline to just below three is expected in the next thirty years. Niger is the country where the fertility level remains highest: from 7 it first rose to an average of just below 8 children per woman in the middle of the 1980’s, before decreasing to just above 6.5 today. For the next decades a decline to 4 children per woman is expected. But that is not at all certain: it is dependent on circumstances that will be further explained in a moment. The demographic transition is after all not a law of nature but the result of human actions and human institutions.

Around 1950, Pakistan and Iran had more or less the same fertility level as Niger, but both countries have seen a considerable decline in the meantime. In Pakistan the level decreased slowly to the current level of 3 children per woman. In Iran the fertility decreased more abruptly, faster and deeper to below the replacement level – Iran today has one of the lowest fertility levels in the world, and a further decline is expected. The Iranian Revolution of 1978 played a crucial role in the history of Iran (Abassi-Shavazi et al., 2009): it brought better education and health care, two essential ingredients for birth control.
Brasil was also one of the countries with very high fertility in the 1950’s – higher than the Congo, for example. The decrease started earlier than in Iran but happened more gradually. Today both countries have the same total fertility, below the replacement level.
- Child mortality, education and family planning
Which factors cause the average number of children to go down? The literature concerning explanations for the decrease in fertility is vast and complex, but two factors emerge as crucial in this process: education and child survival.
Considering child survival first: countries combining intensive birth control with very high child mortality are simply non-existent. The statistical association between the level of child mortality and fertility is very tight and strong: in countries with high child mortality, fertility is high, and vice versa. This statistical correlation is very strong because the causal relation goes in both directions; with quick succession of children and therefore a lot of children to take care for, the chances of survival for the infants are lower than in those families with only a limited number of children to take care of – this is a fortiori the case where infrastructure for health care is lacking. A high fertility level thus contributes to a high child mortality. And in the other direction: where survival chances of children improve, the fertility will go down because even those households with a lower number of children have increasing confidence in having descendants in the long term.
It is crucial to understand that the decline in child mortality in the demographic transition always precedes the decline in fertility. Men, women and families cannot be convinced of the benefits of birth control if they don’t have confidence in the survival chances of their children. Better health care is therefore essential, and a lack of good health care is one of the reasons for a persistently high fertility in a country like Niger.
Education is another factor that can cause a decline in fertility. This is probably the most important factor, not just because education is an important humanitarian goal in itself (apart from the demographic effects), but also because with education one can kill two birds with one stone: education causes more birth control but also better child survival (recently clearly demonstrated by Smith-Greenaway (2013), which in its turn will lead to better birth control. The statistical correlation between level of education and level of fertility is therefore very strong.
Firstly, education enhances the motivation for birth control: if parents invest in the education of their children, they will have fewer children, as has been demonstrated. Secondly, education promotes a more forward-looking lifestyle: it will lead people to think on a somewhat longer term, to think about tomorrow, next week and next month, instead of living for the day. This attitude is necessary for effective birth control. Thirdly, education also increases the potential for effective contraception, because birth control doesn’t just happen, especially not when efficient family planning facilities are not or hardly accessible or when there are opposing cultural or family values.
The influence of education on birth control has been demonstrated in a vast number of studies (James et al., 2012). It starts with primary education, but an even larger effect can be attained by investment in secondary education (Cohen, 2008). In a country like Niger, for example, women who didn’t finish primary school have on average 7.8 children. Women who did finish primary school have on average 6.7 children, while women who finished secondary school “only” have 4.6 children ( Fig. 6 ). The fertility of Niger would be a lot lower if more women could benefit from education. The tragedy of that country is that too many people fall in the category of those without a degree of primary school, with all its demographic consequences.

One achieves with education therefore a plural beneficial demographic effect on top of the important objective of human emancipation in itself. All this is of course not always true but depends on which form of “education”; I assume that we’re talking about education that teaches people the knowledge and skills to better take control of their own destiny.
It is one thing to get people motivated to practice birth control but obtaining actual effective contraception is quite another matter. Information concerning the efficient use of contraceptives and increasing the accessibility and affordability of contraceptives can therefore play an important role. There are an estimated 215 million women who would want to have contraception but don’t have the means (UNFPA, 2011). Investments in services to help with family planning are absolutely necessary and could already have great results in this group of women. But it’s no use to put the cart before the horse: if there is no intention to practice birth control, propaganda for and accessibility of contraception will hardly have any effect, as was demonstrated in the past. In Europe the lion’s share of the decline in fertility was realized with traditional methods, before the introduction of hormonal contraception in the sixties. There is often a problem of lack of motivation for birth control on the one hand, as a result of high child mortality and low schooling rates, and a lack of power in women who may be motivated to limit fertility but are confronted with male resistance on the other (Blanc, 2011; Do and Kurimoto, 2012). Empowerment of women is therefore essential, and education can play an important role in that process as well.
- Population momentum
Even if all the people would suddenly practice birth control much more than is currently considered possible, the world population would still continue to grow for a while. This is the consequence of population momentum, a notion that refers to the phenomenon of demographic inertia, comparable to the phenomenon of momentum and inertia in the field of physics. Demographic growth is like a moving train: even when you turn off the engine, the movement will continue for a little while.
The power and direction of population momentum is dependent on the age structure of the population. Compare the population pyramids of Egypt and Germany ( Fig. 7 ). The one for Egypt has a pyramidal shape indeed, but the one for Germany looks more like an onion. As a consequence of high birth rates in the previous decades, the largest groups of Egyptians are to be found below the age of forty; the younger, the more voluminous the generation. Even if the current and future generations of Egyptians would limit their fertility strongly (as is indeed the case), the birth rate in Egypt would still continue to rise for quite some time, just because year after year more and more potential mothers and fathers reach the fertile ages. Egypt therefore clearly has a growth momentum.

Germany on the other hand has a negative or shrinking momentum: even if the younger generations of Germans would have a larger num ber of children than the generation of their own parents, the birth rate in Germany would still continue to decrease because fewer and fewer potential mothers and fathers reach the fertile ages.
The population momentum on a global scale is positive: even if fertility would decrease overnight to the replacement level, the world population would continue to grow with 40% (from 7 billion to 9.8 billion). Only the rich countries have a shrinking momentum, that is -3%. For Europe the momentum is -7%. The population momentum for the poorest countries in the world is +44%, that of Sub Saharan Africa +46% (Espenshade et al., 2011).
- Consequences of the population explosion
The concerns about the consequences of population explosion started in the sixties. Milestone publications were the 1968 book The Population bomb by biologist Paul Ehrlich, the report of the Club of Rome from 1972 (The Limits to Growth) and the first World Population Plan of Action of the UN in 1974 among others.
In the world population debate, the general concerns involve mainly three interconnected consequences of the population explosion: 1) the growing poverty in the world and famine; 2) the exhaustion and pollution of natural resources essential to human survival; and 3) the migration pressure from the poor South to the rich North (Van Bavel, 2004).
- Poverty and famine
The Malthusian line of thought continues to leave an important mark on the debate regarding the association between population growth and poverty: Malthus saw an excessive population growth as an important cause of poverty and famine. Rightfully this Malthusian vision has been criticized a lot. One must after all take the reverse causal relation into account as well: poverty and the related social circumstances (like a lack of education and good health care for children) contribute to high population growth as well.
Concerning famine: the production of food has grown faster since 1960 than the world population has, so nowadays the amount of food produced per person exceeds that which existed before the population explosion (Lam, 2011). The problem of famine isn’t as much an insufficient food production as it is a lack of fair distribution (and a lack of sustainable production, but that’s another issue). Often regions with famine have ecological conditions permitting sufficient production of food, provided the necessary investments in human resources and technology are made. The most important cause of famine is therefore not the population explosion. Famine is primarily a consequence of unequal distribution of food, which in turn is caused by social-economic inequality, lack of democracy and (civil) war.
Poverty and famine usually have mainly political and institutional causes, not demographic ones. The Malthusian vision, that sees the population explosion as the root of all evil, therefore has to be corrected ( Fig. 8 ). Rapid population growth can indeed hinder economical development and can thus pave the way for poverty. But this is only part of the story. As mentioned, poverty is also an underlying cause of rapid population growth. Social factors are at the base of both poverty and population growth. It’s those social factors that require our intervention: via investments in education and (reproductive) health care.

- Impact on the environment
The impact of the population explosion on the environment is unquestionably high, but the size of the population represents only one aspect of this. In this regard it can be useful to keep in mind the simple I=PAT scheme: the ecological footprint or impact on the environment (I) can be regarded as the product of the size of the population (P), the prosperity or consumption level (A for affluence) and the technology used (T). The relationship between each of these factors is more complex than the I=PAT scheme suggests, but in any case the footprint I of a population of 1000 people is for example dependent on how many of those people drive a car instead of a bike, and of the emission per car of the vehicle fleet concerned.
The ecological footprint of the world population has increased tremendously the past decades and the growth of the world population has obviously played an important role in this. The other factors in the I=PAT scheme have however played a relatively bigger role than the demographic factor P. The considerable increase in the Chinese ecological footprint of the past decades for example, is more a consequence of the increased consumption of meat than of population growth (Peters et al., 2007; Liu et al., 2008). The carbon dioxide emission of China grew by 82% between 1990 and 2003, while the population only increased by 11% in that same period. A similar story exists for India: the population grew by less than 23% between 1990 and 2003, while the emission of carbon dioxide increased by more than 83% (Chakravarty et al., 2009). The consumption of water and meat in the world is increasing more rapidly than the population 3 . The consumption of water per person is for example threefold higher in the US than in China (Hoekstra and Chapagain, 2007). The African continent has at present the same number of inhabitants as Europe and North America together, over 1 billion. But the total ecological footprint of Europeans and Americans is many times higher than that of Africans (Ewing et al., 2010). Less than 18% of the world population is responsible for over 50% of the global carbon dioxide emission (Chakravarty et al., 2009).
If we are therefore concerned about the impact of the world population on the environment, we can do something about it immediately by tackling our own overconsumption: it’s something we can control and it has an immediate effect. In contrast, we know of the population growth that it will continue for some time anyhow, even if people in poor countries would practice much more birth control than we consider possible at present.
The population explosion has created an increasing migration pressure from the South to the North – and there is also important migration within and between countries in the South. But here as well the message is: the main responsibility doesn’t lie with the population growth but with economic inequality. The primary motive for migration was and is economic disparity: people migrate from regions with no or badly paid labour and a low standard of living to other regions, where one hopes to find work and a higher standard of living (Massey et al., 1993; Hooghe et al., 2008; IMO, 2013). Given the permanent population growth and economical inequality, a further increasing migration pressure is to be expected, irrespective of the national policies adopted.
It is sometimes expected that economic growth and increasing incomes in the South will slow down the migration pressure, but that remains to be seen. After all, it isn’t usually the poorest citizens in developing countries that migrate to rich countries. It is rather the affluent middle class in poor countries that have the means to send their sons and daughters to the North – an investment that can raise a lot of money via remittances to the families in the country of origin (IMO, 2013). There is after all a considerable cost attached to migration, in terms of money and human capital. Not everyone can bear those costs: to migrate you need brains, guts and money. With growing economic development in poor countries, an initial increase in migration pressure from those countries would be expected; the association between social-economic development and emigration is not linearly negative but follows the shape of a J turned upside down: more emigration at the start of economic development and a decline in emigration only with further development (De Haas, 2007).
- 7 Billion and counting… What is to be done?
A world population that needed some millennia before reaching the number of 1 billion people, but then added some billions more after 1920 in less than a century: the social, cultural, economic and ecological consequences of such an evolution are so complex that they can lead to fear and indifference at the same time. What kind of constructive reaction is possible and productive in view of such an enormous issue?
First of all: we need to invest in education and health care in Africa and elsewhere, not just as a humanitarian target per se but also because it will encourage the spread of birth control. Secondly, we need to encourage and support the empowerment of women, not just via education but also via services for reproductive health. This has triple desirable results for demographics: it will lead to more and more effective birth control, which in itself has a positive effect on the survival of children, which in turn again facilitates birth control.
Thirdly: because of the positive population momentum, the world population will certainly continue to grow in absolute figures, even though the yearly growth rate in percentages is already on the decline for several years. The biggest contribution we could make therefore, with an immediate favourable impact for ourselves and the rest of the world, is to change our consumption pattern and deal with the structural overconsumption of the world’s richest countries.
(1) Unless otherwise specified, all figures in this paragraph are based on the United Nations World Population Prospects, the 2012 Revision, http://esa.un.org/wpp/ . Concerning projections for the future, I reported the results of the Medium Variant. Apart from this variant, there are also high and low variants (those relying on scenarios implying respectively an extremely high and extremely low growth of the population) and a variant in which the fertility rates are fixed at the current levels. It is expected that the actual number will be somewhere between the highest and lowest variant and will be closest to the medium variant. That’s why I only report this latter value.
(2) In demography, the term «fertility» refers to the actual number of live births per women. By contrast, the term fecundity refers to reproductive capacity (irrespective of actual childbearing), see Habbema et al. (2004).
(3) See http://www.unwater.org/water-cooperation-2013/water-cooperation/facts-and-figures
- Abbasi-Shavazi MJ, McDonald P, Chavoshi M. Dordrecht: Springer; 2009. The Fertility Transition in Iran. Revolution and Reproduction. [ Google Scholar ]
- Blanc AK. The effect of power in sexual relationships on sexual and reproductive health: an examination of the evidence. Stud Fam Plan. 2001; 32 :189–213. [ Abstract ] [ Google Scholar ]
- Chakravarty S, Chikkatur A, de Coninck H, et al. Sharing global CO2 emission reductions among one billion high emitters. Proc Natl Acad Sci USA. 2009; 106 :11884–11888. [ Europe PMC free article ] [ Abstract ] [ Google Scholar ]
- Cohen JE. Make secondary education universa. Nature. 2008; 456 :572–573. [ Abstract ] [ Google Scholar ]
- De Haas H. International migration, remittances and development: myths and facts. Third World Quarterly. 2007; 26 :1269–1284. [ Google Scholar ]
- Do M, Kurimoto N. Women’s Empowerment and Choice of Contraceptive Methods in Selected African Countries. Int Perspect Sex Reprod Health. 2012; 38 :23–33. [ Abstract ] [ Google Scholar ]
- Espenshade TJ, Olgiati AS, Levin S. On nonstable and stable population momentum. Demography. 2011; 48 :1581–1599. [ Europe PMC free article ] [ Abstract ] [ Google Scholar ]
- Ewing B, Moore D, Goldfinger S, Oursler A, et al. Oakland, CA: Global Footprint Network; Ecological Footprint Atlas 2010. [ Google Scholar ]
- Habbema JDF, Collins J, Leridon H, et al. Towards less confusing terminology in reproductive medicine: a proposal. Hum Reprod. 2004; 19 :1497–1501. [ Abstract ] [ Google Scholar ]
- Hoekstra AY, Chapagain AK. Water footprints of nations: Water use by people as a function of their consumption pattern. Water Resources Management. 2007; 21 :35–48. [ Google Scholar ]
- Hooghe M, Trappers A, Meuleman B, et al. Migration to European countries: A structural explanation of patterns, 1980-2004. International Migration Review. 2008; 42 :476–504. [ Google Scholar ]
- IMO. World Migration Report 2013. Genève, CH: International Organization for Migration; 2013. [ Google Scholar ]
- Vienna Yearbook of Population Research. 2012; 10 [ Google Scholar ]
- Lam D. How the world survived the population bomb: lessons from 50 years of extraordinary demographic history. Demography. 2011; 48 :1231–1262. [ Europe PMC free article ] [ Abstract ] [ Google Scholar ]
- Liu J, Yang H, Savenije HHG. China’s move to higher-meat diet hits water security. 2008. [ Abstract ] [ Google Scholar ]
- Livi-Bacci M. A Concise History of World Population. 3rd ed. Cambridge (Mass.): Blackwell; 2001. [ Google Scholar ]
- Massey , DS , Arango J, Hugo G, et al. Theories of international migration: a review and appraisal. Population and Development Review. 1993; 19 :431–466. [ Google Scholar ]
- Peters GP, Weber CL, Guan D, et al. China’s Growing CO 2 Emissions - A Race between Increasing Consumption and Efficiency Gains. Environ Sci Technol. 2007; 41 [ Abstract ] [ Google Scholar ]
- Smith-Greenaway E. Maternal reading skills and child mortality in Nigeria: a reassessment of why education matters. Demography. 2013; 50 :1551–1561. [ Europe PMC free article ] [ Abstract ] [ Google Scholar ]
- UNFPA. The State of World Population 2011. People and Possibilities in a World of 7 Billion. New York: United Nations; [ Google Scholar ]
- UN. World Population Prospects. The 2012 Revision. Volume I : Comprehensive Tables. New York: United Nations; 2013. [ Google Scholar ]
- Van Bavel, J. De wereldbevolkingsexplosie en duurzame ontwikkeling: een veldoverzicht. Tijdschrift voor Sociologie. 2004; 25 :227–245. [ Google Scholar ]
Citations & impact
Impact metrics, citations of article over time, alternative metrics.

Article citations
Declining global fertility rates and the implications for family planning and family building: an iffs consensus document based on a narrative review of the literature..
Fauser BCJM , Adamson GD , Boivin J , Chambers GM , de Geyter C , Dyer S , Inhorn MC , Schmidt L , Serour GI , Tarlatzis B , Zegers-Hochschild F , Contributors and members of the IFFS Demographics and Access to Care Review Board
Hum Reprod Update , 30(2):153-173, 01 Mar 2024
Cited by: 1 article | PMID: 38197291 | PMCID: PMC10905510
Innovative Applications of Tenebrio molitor Larvae in Food Product Development: A Comprehensive Review.
Kotsou K , Chatzimitakos T , Athanasiadis V , Bozinou E , Athanassiou CG , Lalas SI
Foods , 12(23):4223, 22 Nov 2023
Cited by: 0 articles | PMID: 38231605 | PMCID: PMC10705894
Global trends in the research and development of medical/pharmaceutical wastewater treatment over the half-century.
Wang L , Xu Y , Qin T , Wu M , Chen Z , Zhang Y , Liu W , Xie X
Chemosphere , 331:138775, 24 Apr 2023
Cited by: 1 article | PMID: 37100249 | PMCID: PMC10123381
Combined effect of Zinc lysine and biochar on growth and physiology of wheat ( Triticum aestivum L.) to alleviate salinity stress.
Ul Aibdin Z , Nafees M , Rizwan M , Ahmad S , Ali S , Obaid WA , Alsubeie MS , Darwish DBE , Abeed AHA
Front Plant Sci , 13:1017282, 09 Mar 2023
Cited by: 4 articles | PMID: 36994320 | PMCID: PMC10042136
Application of Pineapple Waste to the Removal of Toxic Contaminants: A Review.
Fouda-Mbanga BG , Tywabi-Ngeva Z
Toxics , 10(10):561, 26 Sep 2022
Cited by: 1 article | PMID: 36287842 | PMCID: PMC9610545
Similar Articles
To arrive at the top five similar articles we use a word-weighted algorithm to compare words from the Title and Abstract of each citation.
[Summary of the State of World Population, 1992].
United Nations Population Fund UNFPA
Emisor Demogr , 6(2):16-19, 01 Mar 1992
Cited by: 0 articles | PMID: 12344668
Contraceptive prevalence, reproductive health and our common future.
Diczfalusy E
Contraception , 43(3):201-227, 01 Mar 1991
Cited by: 7 articles | PMID: 2036793
[African population growth: status and prospects].
Tiers Monde , 32(125):159-173, 01 Jan 1991
Cited by: 0 articles | PMID: 12283847
[Demography: can growth be slowed down?].
Dev Sante , (90):23-25, 01 Jan 1990
Cited by: 0 articles | PMID: 12283630
Contraceptive delivery in the developing world.
Potts DM , Crane SF
Br Med Bull , 49(1):27-39, 01 Jan 1993
Cited by: 2 articles | PMID: 8324614
Europe PMC is part of the ELIXIR infrastructure
Do not include words like a, and, for, the, etc.
Advanced Query Syntax
Due to a planned outage on Friday, April 12th starting at noon through Sunday, April 14th, access to other Institute resources from this site may be unavailable during this time. We apologize for any inconvenience.
2024 NHFP Fellows
Meet the 2024 nasa hubble fellowship program fellows, jaren ashcraft.

Host Institution: University of California, Santa Barbara
Proposal Title: Optimizing the Vector Field for Next-generation Astrophysics
Jaren Ashcraft grew up on the Big Island of Hawai'i. He earned his bachelor’s degree in optical engineering from the University of Rochester in 2019, and master’s in optical sciences from the University of Arizona in 2022. Jaren is currently pursuing his doctorate in optical sciences at the University of Arizona supervised by Dr. Ewan Douglas, and will graduate in the summer of 2024.
As a Sagan Fellow at UCSB, Jaren will study how optical polarization can limit the ability of next-generation observatories to directly image Earth-like exoplanets. This phenomenon, known as polarization aberration, is particularly problematic for the ground-based 30-meter Extremely Large Telescopes and the future space-based Habitable Worlds Observatory. Jaren will construct integrated optical models to assess the sensitivity of coronagraphs to the polarization aberrations of these observatories. He will then explore strategies to mitigate the influence of polarization aberrations on astronomical observations, including investigating novel technologies like metasurfaces and liquid crystals to serve as compensators.
Vishal Baibhav

Host Institution: Columbia University
Proposal Title: Dancing with Black Holes: Harnessing Gravitational Waves to Understand the Formation of Black Holes
Vishal Baibhav grew up near New Delhi, India. He earned his bachelor’s degree in engineering physics from the Indian Institute of Technology, Guwahati in 2016. In 2021, he earned his doctorate from Johns Hopkins University under the supervision of Professor Emanuele Berti. His research focused on black hole spectroscopy and gravitational-wave astrophysics. Currently, he is a CIERA postdoctoral fellow at Northwestern University.
Despite breakthrough detections of compact-object mergers by LIGO, Virgo, and Kagra detectors, the birthplace and the origin of these compact objects remain unknown. Vishal's research is focused on fundamental questions such as how, when, and where these binaries form, and what physics drives their evolution. He is interested in understanding the life of stars that evolved into merging black holes and the environments that nurtured them. With future gravitational-wave detections, Vishal aims to address key questions about the formation of compact objects, specifically how black holes and neutron stars acquire their spins. As an Einstein Fellow, he will explore whether these spins are inherited from progenitor stars, or if stochastic processes and natal kicks during core collapse play a significant role in shaping them.
Kiersten Boley

Host Institution: Carnegie Earth and Planets Laboratory
Proposal Title: Identifying the Key Materials for Planet Formation and Evolution
Kiersten Boley grew up in Rome, Georgia. She earned her associate’s in physics at Georgia Highlands College before transferring to Georgia Institute of Technology where she earned her bachelor’s in physics in 2019. Kiersten earned a master’s degree in astronomy at The Ohio State University in 2021. She spent 2022 as an IPAC visiting graduate student at Caltech, working with Dr. Jessie Christiansen. Currently, Kiersten is a National Science Foundation Graduate Research Fellow at The Ohio State University where she will earn her doctorate in astronomy in May 2024, advised by Professor Ji Wang, Professor Wendy Panero, and Dr. Jessie Christiansen.
Kiersten’s research investigates how elemental abundances impact planet formation and interior evolution through planet detection and interior modeling. Her interdisciplinary research aims to determine the materials required for planet formation by planet type and how their mineral compositions may impact the long-term evolution and habitability of rocky planets. As a Sagan Fellow, Kiersten will continue to study exoplanets through population studies focused on unraveling the dependence of planet formation on galactic location and stellar abundance using observational data. Additionally, she will investigate the long-term evolution and water cycling on rocky planets using theoretical interior models based on experimental data.
Michael Calzadilla

Host Institution: Smithsonian Astrophysical Observatory
Proposal Title: A Multiwavelength View of the Evolving Baryon Cycle in Galaxy Clusters
Michael Calzadilla grew up in Tampa, Florida. As a first-generation college student, he earned his bachelor’s degree in physics from the University of South Florida in 2015. He subsequently crossed the pond to complete a master’s degree in astronomy as a Gates Cambridge scholar under the guidance of Professor Andrew Fabian at the University of Cambridge. Michael will complete his doctorate in physics at the Massachusetts Institute of Technology in May 2024 with his advisor Professor Michael McDonald.
Michael’s work focuses on multiwavelength observations of galaxy clusters to study the baryon cycle that drives the evolution of all galaxies. The largest galaxies residing in these clusters grow via material cooling from their hot atmospheres, which is balanced by feedback from star formation and active galactic nuclei. As part of the South Pole Telescope collaboration, Michael’s work is among the first to leverage recent Sunyaev-Zeldovich-based detections of galaxy clusters to observe this cycling of material out to unprecedented redshifts.
As a Hubble Fellow, Michael will develop machine learning techniques for characterizing the thousands of galaxy clusters being discovered by next-generation cosmological surveys resulting in clean, unbiased samples of the earliest galaxy clusters. Using synergies with large X-ray, optical, and radio datasets, he will seek to answer when galaxy clusters first dynamically relaxed, and how the effectiveness of supermassive black hole feedback has changed over time. He will also use new observatories for more targeted follow-up to investigate the role of feedback-induced turbulence in regulating galaxy growth.
Sanskriti Das

Host Institution: Stanford University
Proposal Title: Where the Energetic Universe Meets the Hot Universe
Sanskriti grew up in India and earned her bachelor’s in physics at Presidency University Kolkata in 2015, and her master's in physics at the Indian Institute of Technology Bombay in 2017. She earned her doctorate in astronomy from The Ohio State University, USA in 2022. Since then, she has been an independent postdoctoral fellow at the Kavli Institute for Particle Astrophysics and Cosmology at Stanford University.
Sanskriti is interested in the co-evolution of galactic disks and the circumgalactic medium (CGM) through multiphase gas cycles between the disk and the CGM. Faint diffuse CGM signals tend to hide behind bright, variable, and complex backgrounds. Sanskriti devises innovative observing strategies and develops novel data reduction and analysis techniques to extract that signal. Using millimeter and X-ray telescopes, she looks for the hot CGM, the reservoir of baryons, metals, and energy missing from the stars and interstellar medium (ISM). She studies cold CGM using radio telescopes, looking for the accreting raw material for star formation that is missing from the ISM. She uses multiwavelength (radio, UV, optical, IR, and X-ray) data to study the corresponding galactic disks and connect their properties with the CGM. She is passionate about the history of astronomy and is actively involved in mentoring, outreach, and resolving gender inequity in astronomy as well.
As a Hubble Fellow, Sanskriti is excited to unravel the integrated impact of galactic feedback on the CGM using multiwavelength observations, and inform the next generation of millimeter and X-ray missions.
Jordy Davelaar

Host Institution: Princeton University
Proposal Title: Unraveling the Physics of Accreting Black Hole Binaries
Jordy Davelaar was born and raised in The Netherlands in a small country village called De Klomp. He obtained his bachelor’s and master’s degrees in physics and astronomy at Radboud University in Nijmegen. In 2020, Jordy earned his doctorate in astrophysics from Radboud, where he worked under the supervision of Monika Mościbrodkza and Heino Falcke. After graduation, he has been a joint postdoctoral fellow at Columbia University and the Flatiron Institute’s Center for Computational Astrophysics.
Jordy’s primary research focus is modeling the emission produced in the accretion flows of supermassive black holes. To this end, he combines high-performance computing magnetofluid simulations with radiation transfer methods. His work on black hole accretion flows is used to interpret millimeter, near-infrared, and radio observations, e.g. the Event Horizon Telescope Collaboration. More recently, Jordy started developing binary black hole models, aiming to predict electromagnetic signatures of Laser Interferometer Space Antenna targets with Chandra, XMM-Newton, and Athena.
A critical component to understanding where and how black holes merge and how they shape galactic evolution is host galaxy identification, which relies on electromagnetic observations. However, the field is still debating major theoretical uncertainties regarding the interaction of the binary with its environment and the potential signatures it might produce. As an Einstein Fellow at Princeton University, Jordy will develop novel accretion flow simulations of merging black hole binaries to identify tell-tale electromagnetic signatures and unravel the physics of accreting black hole binaries.
Alexander Dittmann

Host Institution: Institute for Advanced Study
Proposal Title: Bridging the Gap in Supermassive Black Hole Binary Accretion - From Simulation to Observation
Alexander Dittmann grew up in northern Virginia. He earned undergraduate degrees in physics and astronomy from the University of Illinois in 2018, after which he joined the Astronomy Department at the University of Maryland. He has also worked at Los Alamos National Laboratory and the Center for Computational Astrophysics, and will complete his doctorate under the guidance of Cole Miller in April 2024.
Following his broad interests in high-energy astrophysics and fluid dynamics, Alexander has studied a variety of astrophysical topics from the origins of planetary spins to the final moments of binary supermassive black holes. He has also used data from NASA’s NICER telescope to measure the radii of neutron stars, gleaning insight into the enigmatic nature of matter within their cores. As an Einstein Fellow at the Institute for Advanced Study, he will leverage cutting-edge simulations and his experience in astrostatistics to connect theoretical studies of binary black holes to the forthcoming bounty of time-domain observations of active galactic nuclei.
Cristhian Garcia-Quintero

Host Institution: Harvard University
Proposal Title: Phenomenological Modified Gravity in the Non-linear Regime and Improving BAO Measurements with Stage-IV Surveys
Cristhian Garcia-Quintero was born and raised in Culiacán, Sinaloa, México. He earned his bachelor’s degree in physics from the Autonomous University of Sinaloa in 2017. While still an undergraduate student, Cristhian was selected for an internship program, co-funded by the U.S. embassy in Mexico, allowing him to conduct research at The University of Texas at Dallas, where he returned to pursue his doctorate in physics in 2018 under the guidance of Professor Mustapha Ishak.
Cristhian's research is focused on large-scale structure analyses to improve our understanding of cosmology using ongoing and upcoming galaxy surveys. Cristhian is interested in testing the standard model of cosmology using current and future cosmological data while particularly emphasizing phenomenological modified gravity tests and data-driven approaches. Cristhian is heavily involved in the Dark Energy Spectroscopic Instrument (DESI) where he has contributed to the Baryons Acoustic Oscillations (BAO) analysis. Cristhian is also working towards performing cosmological analyses based on cross-correlations between DESI and other surveys.
As an Einstein Fellow, Cristhian will extend his work on modified gravity to explore tests of gravity beyond the linear regime. Additionally, Cristhian will work towards improving the BAO measurements for DESI year 5 analysis and perform analyses that can benefit from synergies between Stage-IV surveys.
Amelia (Lia) Hankla

Host Institution: University of Maryland, College Park
Proposal Title: Explaining Radio to X-ray Observations of Luminous Black Holes with a Multizone Outflowing Corona Model
Lia Hankla grew up in Lafayette, Colorado. She earned her bachelor’s degree in physics and a minor in oboe performance from Princeton University in 2017 and then spent a year in Heidelberg, Germany as a Fulbright Research Scholar at the Max Planck Institute for Astronomy. In 2018, Lia returned home to Colorado for her doctorate in physics, where she collaborated with Jason Dexter, Mitch Begelman, and Dmitri Uzdensky with the support of an NSF Graduate Research Fellowship. After completing her doctorate in the summer of 2023, Lia joined the University of Maryland, College Park as a Joint Space-Sciences Institute Postdoctoral Fellow and a Multimessenger Plasma Physics Center Fellow.
Lia is interested in anything involving plasmas and black holes, especially accretion disks and their surrounding coronae. Although these plasmas just outside the event horizon hold the key to unraveling how black holes evolved over time, they remain poorly understood because of the difficulty connecting small-scale particle processes to the global scales of the entire accretion disk and corona. Interpreting observations of radio to X-ray emission from around luminous black holes requires understanding how and where magnetic energy dissipates into plasma particle energy.
As an Einstein Fellow, Lia will decipher how these dissipation processes, including turbulence and magnetic reconnection, can further our understanding of nonthermal particle acceleration and winds in accretion disks and coronae. Her research aims to shed light on recent spectral timing and X-ray polarization observations of both stellar-mass and supermassive black holes, and to resolve long-standing questions regarding these mysterious objects in our universe.
Cheng-Han Hsieh

Host Institution: The University of Texas at Austin
Proposal Title: A Deep Dive into the Early Evolution of Protoplanetary Disk Substructures and the Onset of Planet and Star Formation
Cheng-Han Hsieh grew up in Taichung City, Taiwan, and earned his undergraduate degree in physics from National Tsing Hua University in 2018. He stayed at Yale for his graduate studies and will complete his doctorate in the summer of 2024 under the supervision of Professor Héctor G. Arce.
Cheng-Han’s research focuses on using the Atacama Large Millimeter/submillimeter Array (ALMA) to characterize the substructure evolution within protostellar disks, where young stars and planets are forming. These substructures manifest varied natures - some potentially sculpted by pre-existing planets, while others, such as dense rings, may act as nurseries for the formation of planetesimals and subsequent planet generations. In particular, he is interested in pinpointing the early formation of disk substructures, which traces the onset of planet formation. As a Sagan Fellow at the University of Texas at Austin, Cheng-Han will undertake a comprehensive statistical study of disk substructures around the youngest protostars, discerning the relationship between circumstellar disk properties and the primordial conditions of planetary systems. Ultimately, he aims to chart the full trajectory of giant planet formation.

Proposal Title: The Role of Magnetic Fields in Galaxy Cluster's Diffuse Structure Formation
Yue Hu grew up in Yuxi City, Yunnan, China. He earned dual bachelor’s degrees in automation engineering from Tongji University and the University of Bologna in 2018. Yue is poised to earn his doctorate in astrophysics from the University of Wisconsin-Madison in spring 2024, supervised by Professor Alexandre Lazarian. During his doctorate, he developed innovative techniques for tracing 3D magnetic fields across various astrophysical conditions.
Yue's research focuses on the ubiquitous turbulence and magnetic fields in astrophysics, bridging the gap from the microscopic physics of cosmic rays to the macroscopic evolution of galaxy clusters. His work employs a blend of MHD turbulence theories, numerical simulations, and physics-informed machine-learning approaches. He has mapped the megaparsec-scale magnetic field in the El Gordo cluster using the synchrotron intensity gradient technique and MeerKAT radio observations.
As a Hubble Fellow, Yue will explore the role of magnetic fields in the evolution and formation of galaxy clusters, using cosmological simulations, and radio observations from VLA, LOFAR, and MeerKAT, alongside X-ray observations from Chandra and XMM-Newton. He aims to deepen our understanding of the magnetized galaxy clusters, which are among the universe's largest gravitationally bound structures. The research will also facilitate predictive models for the Square Kilometre Array and the Lynx X-ray observatory.
Wynn Jacobson-Galán

Host Institution: California Institute of Technology
Proposal Title: Final Moments: Uncovering the Rate of Enhanced Red Supergiant Mass-loss in the Local Volume
Wynn Jacobson-Galán grew up in Los Angeles where he attended Santa Monica Community College before completing a bachelor’s degree in physics at UC Santa Cruz in 2018. Wynn was an IDEAS Fellow at Northwestern University where he earned a master’s degree in 2021. Wynn is currently an NSF Graduate Research Fellow at UC Berkeley under the supervision of Professor Raffaella Margutti and will finish his doctorate in summer 2024.
Wynn’s research focuses on combining multi-wavelength observations (radio to X-ray) of a variety of supernova types to create a complete picture of the final stages of stellar instability and mass-loss before explosion. His primary interest is the utilization of ultra-rapid observations of young supernovae in order to bridge the gap between stellar life and death. As a Hubble Fellow, Wynn will probe the late-stage evolution of red supergiant stars through observations and modeling of type II supernovae. Using transient sky surveys, he will construct the first volume-limited, spectroscopically-complete sample of type II supernovae discovered within days of explosion in order to constrain the final evolutionary stages of red supergiant stars in the local universe. Additionally, Wynn will utilize ultraviolet spectroscopy/imaging of both young and old core-collapse supernovae to constrain the physics of circumstellar shockwaves and the mass-loss histories of red supergiants in the decades-to-centuries before explosion.
Rafael Luque

Host Institution: The University of Chicago
Proposal Title: Understanding the Origin and Nature of Sub-Neptunes
Born in Priego de Córdoba (Spain), Rafael Luque earned his bachelor’s in physics from the University of Granada (Spain) in 2015 and his master’s in physics in 2017 from the University of Heidelberg (Germany). He earned his doctorate in 2021 thanks to a Doctoral INPhINIT Fellowship from the European Union and “la Caixa” Banking Foundation, having worked with Professor Enric Palle and Dr. Grzegorz Nowak at the Instituto de Astrofisica de Canarias (Spain). Currently, Rafael is a "Margarita Salas" Fellow at the University of Chicago, working with Professor Jacob Bean.
Rafael's research aims to understand the origin and nature of sub-Neptunes. This class of planets has no counterpart in the solar system, but they exist in (approximately) every other star in the Galaxy. Several theories and models can explain their existence and demographic properties, but they make opposing predictions about their internal structure, location at birth, evolution history, or atmospheric composition. As a Sagan Fellow, Rafael will exploit the synergies between ground- and space-based observatories to build a sample of sub-Neptunes with precise and accurate measured properties (such as radius, mass, and atmospheric composition) that break the modeling degeneracies inherent to this class and help us infer a unique answer about their properties.
Madeleine McKenzie

Host Institution: Carnegie Observatories
Proposal Title: Uncovering the Unknown Origins of Globular Clusters
Madeleine McKenzie is an Aussie from Perth, Western Australia. She earned her bachelor’s degree in physics and computer science from the University of Western Australia (UWA) in 2018. In 2020, she earned her master’s in astrophysics at UWA and the International Centre for Radio Astronomy Research (ICRAR) working on hydrodynamical simulations of globular cluster formation. For her doctorate, she transitioned from theory to observations to work with Dr. David Yong on the chemical abundance analysis of globular clusters at the Australian National University and is set to graduate at the end of 2024.
Following her passion for these ancient collections of stars, Madeleine has set the lofty goal of redefining what is and is not a globular cluster. With next-generation telescopes such as the James Webb Space Telescope discovering dense stellar structures in the early universe, understanding the different formation channels of the star clusters and dwarf galaxies in our backyard is becoming more important. As a Hubble Fellow, she will utilize kinematic and chemical element abundance variations, particularly that of iron peak and neutron capture process elements, to characterize the diversity of star clusters around our Milky Way. Using the Magellan Telescopes operated by the Carnegie Observatories, she will undertake an ambitious observing program to identify which balls of stars are masquerading as globular clusters using a combination of high-precision chemical abundances and isotopic analysis. The outcomes from her project will help improve our understanding of fields such as star formation, nucleosynthesis, stellar evolution, and the accreted halo of our Milky Way.
Jed McKinney

Proposal Title: The Role of Dust in Shaping the Evolution of Galaxies
Jed McKinney grew up between Old Greenwich, CT and Brussels, BE. He achieved his bachelor’s degree at Tufts University in 2017, and his doctorate in astronomy from The University of Massachusetts, Amherst in 2022. During his studies Jed was an IPAC Visiting Graduate Fellow at Caltech. He is currently a Postdoctoral Fellow at The University of Texas at Austin.
Jed’s research focuses on understanding the lifecycle of galaxies through the lens of dust. Dust, a by-product of star formation like interstellar pollution, is a small component of galaxies by mass but plays a transformative role in how we observe, interpret, and model them. Jed’s research uses both observations and simulations to directly test and contextualize the nuanced role of dust in galaxy formation.
As a Hubble Fellow at The University of Texas at Austin, Jed will combine detailed spectroscopic surveys using James Webb Space Telescope and ALMA with large multi-wavelength imaging programs and simulations. Jed will measure directly the properties of dust grains in distant galaxies to uncover the relationship between dust, star- and supermassive black-hole formation out to early times in the history of the universe. This will enable a new and unbiased perspective on the mechanics of galaxy formation, one that is rooted in a comprehensive census of dust.
Keefe Mitman

Host Institution: Cornell University
Proposal Title: Decoding General Relativity with Next-Generation Numerical Relativity Waveforms
Keefe Mitman was raised in Madison, Wisconsin. He earned his bachelor’s degree in mathematics and physics from Columbia University in 2019 and his doctorate in physics from the California Institute of Technology in 2024. At Caltech, he studied black holes, gravitational waves, and numerical relativity with Professor Saul Teukolsky and the Simulating eXtreme Spacetimes (SXS) Collaboration.
Keefe’s research largely focuses on utilizing results from the gravitational wave theory community to improve contemporary numerical relativity simulations of binary black hole coalescences. One such example of this was using these simulations to calculate and model an intriguing and not-yet observed prediction of Einstein’s theory of general relativity called the gravitational wave memory effect. This effect corresponds to the permanent net displacement that two observers will experience due to the passage of transient gravitational radiation and is of immense interest to those working on testing general relativity, probing the fundamental structure of spacetime, and understanding the enigmas of quantum gravity.
As an Einstein Fellow at Cornell University, Keefe will continue his work with the SXS Collaboration to build models of the gravitational waves that can be observed by current gravitational wave detectors. In particular, he will focus on constructing waveform models that contain the memory effect to help observe this perplexing phenomenon, as well as others, for the first time.
Sarah Moran

Host Institution: NASA Goddard Space Flight Center
Proposal Title: From Stars to Storms: Planetary Cloud Seeding with Sulfur-Based Hazes
Sarah Moran grew up in Kansas City, Missouri. She earned her bachelor’s degree with a major in Astrophysics and a minor in Science and Public Policy at Barnard College of Columbia University in New York in 2015. She earned her doctorate in planetary sciences from Johns Hopkins University in 2021, having worked under Sarah Hörst and Nikole Lewis. During her graduate studies, she also served as a Space Policy Fellow with the Space Studies Board at the National Academies of Sciences, Engineering, and Medicine.
Sarah is currently the Director’s Postdoctoral Fellow at the University of Arizona’s Lunar and Planetary Laboratory with Mark Marley.
Sarah’s research combines laboratory astrophysics and atmospheric modeling to understand the aerosols that form in substellar atmospheres, from solar system worlds to exoplanets to brown dwarfs. Aerosols act as tracers of the physics and chemistry of these atmospheres, giving insight into the processes that shape the observable spectra of these objects. As a Sagan Fellow, Sarah will experimentally investigate the effect of sulfur species in forming atmospheric hazes and examine whether such particles enhance or inhibit exotic exoplanet cloud formation. These studies will help interpret ongoing and future observations from the Hubble Space Telescope, James Webb Space Telescope, and next-generation observatories.
Andrew Saydjari

Proposal Title: Inferring Kinematic and Chemical Maps of Galactic Dust
Andrew Saydjari grew up in Wisconsin Rapids, WI. He earned his bachelor’s degree in mathematics and bachelor’s and master’s in chemistry at Yale University in 2018, with a thesis on organometallic catalysis. Andrew then moved to Harvard University as an NSF Graduate Research Fellow and will complete his doctorate in physics spring 2024, advised by Douglas Finkbeiner.
Andrew’s work focuses on combining astrophysics, statistics, and high-performance coding to study the chemical, spatial, and kinematic variations in the dust that permeates the Milky Way. Dust is an important building block in matter assembly, and a driver of the interstellar environment and galactic foreground. As a Hubble Fellow at Princeton, Andrew will use new, unbiased measurements of near infrared diffuse interstellar bands to precisely map the kinematics and chemistry of galactic dust. He strives to constrain feedback processes shaping the interstellar medium and improve compositional constraints on dust. He will develop the rigorous statistical machinery necessary to combine spectroscopic surveys with upcoming photometry from SPHEREx and the Nancy Grace Roman Space Telescope to answer his motivating questions: “What is dust made of, where is it, and how is it moving?”
Peter Senchyna

Proposal Title: Bridging the Gap: Bringing the First Galaxies into Focus with Local Laboratories
Peter Senchyna grew up in rural Venersborg / Battle Ground, Washington, and earned a bachelor’s degree at the University of Washington. He earned his doctorate working with Dan Stark at the University of Arizona in 2020. Since then, Peter has held a Carnegie Fellowship at the Observatories of the Carnegie Institution for Science in Pasadena.
Peter's research is focused on understanding the first generations of massive stars and the galaxies for which they laid the foundations. Our understanding of how the universe was reionized and the earliest phases of galaxy assembly are inextricably bound-up with uncertainties in the physics of metal-poor massive stars, including the potentially profound but uncertain role of binary mass transfer. As a Hubble Fellow, Peter will bring new James Webb Space Telescope observations into conversation with several unique datasets in the local universe. These include extraordinarily deep ultraviolet continuum spectroscopy of nearby extremely metal-poor blue compact dwarf galaxies with the Hubble Space Telescope, and a large Magellan narrowband imaging campaign dissecting dwarf irregulars at the edge of the Local Group. Peter aims to unite these observations spanning from our cosmic backyard to redshift ~10 to cast light on both the nature of galaxies at cosmic dawn and massive star evolution under (near-)primordial conditions.
Raphael Skalidis

Proposal Title: Magnetic Fields in the Multiphase Interstellar Medium
Raphael Skalidis grew up in Rethymno, Crete, Greece. He obtained his doctorate from the Department of physics at the University of Crete in 2022, and later moved to the California Institute of Technology as a postdoctoral fellow. His research focuses on the interstellar medium (ISM).
Observatories such as LOFAR and the Planck satellite have revealed that a coherent magnetic field permeates the different phases of the ISM, challenging some common conceptions. As a Hubble Fellow, Raphael aims to develop theories about the role of magnetic fields in shaping the multiphase ISM. He will follow a multifaceted approach that will include comparisons between synthetic data and observations, analytical calculations, and numerical simulations. Raphael’s research promises to advance our knowledge of the magnetized ISM which is critical for understanding galaxy evolution and star formation.
Adam Smercina

Host Institution: Space Telescope Science Institute
Proposal Title: A Portrait of the Triangulum: Advancing a New Frontier of Galaxy Evolution with Resolved Stars
Adam Smercina is a native of Northwest Ohio, growing up in the small town of Oak Harbor near the shore of Lake Erie. He earned a bachelor’s degree in physics, with a concentration in astrophysics, from the University of Toledo in 2015. He then moved north to the University of Michigan in Ann Arbor, where he ultimately earned his doctorate in astronomy and astrophysics in August 2020, advised by Eric Bell. Adam was supported during his doctorate work by a Graduate Research Fellowship from the National Science Foundation. Since 2020, he has worked with Julianne Dalcanton and Ben Williams at the University of Washington as a postdoctoral scholar.
Adam's research focuses on reconstructing the evolutionary histories of galaxies by resolving them into their constituent stars. We are in an exciting new era where the Hubble Space Telescope and James Webb Space Telescope operate simultaneously, providing better access to the resolved stellar populations in individual nearby galaxies than ever before. These galaxies' constituent stars are tremendously information-rich, providing an archaeological record of their host galaxy's evolution. As a Hubble Fellow at STScI, Adam will use these stars to chart the evolution of structure, star formation, and interaction in galaxies throughout the Local Volume, including a targeted study of the Triangulum Galaxy, M33. The first large galaxy with panchromatic Hubble+Webb observations across its disk, M33 is among the most important members of the Local Group, and exists at a mass where the physics driving the evolution of spiral galaxies is poorly understood. This work will establish a foundational blueprint for a new era of studying resolved stellar populations in large galaxies from space, setting the benchmark for future facilities studying more distant, cosmologically-representative populations of galaxies.
Shangjia Zhang

Proposal Title: Probing Young Planet Populations with 3D Self-Consistent Disk Thermodynamics
Shangjia Zhang was born and raised in Beijing, China. He earned bachelor’s degrees in astronomy and physics from the University of Michigan, Ann Arbor in 2018. He is currently completing his doctorate at the University of Nevada, Las Vegas, under the guidance of Professor Zhaohuan Zhu.
Shangjia's research interests focus on several aspects of protoplanetary disks, including constraining dust properties and disk thermal structure, and inferring potential young planet populations from disk substructures. As a Sagan Fellow, he will use state-of-the-art radiation hydrodynamic simulations to self-consistently study disk thermodynamics. By deepening our understanding of disk physics, his goal is to provide better explanations for disk images and kinematics obtained from radio interferometers and giant telescopes. By bridging theory with observations, he aims to distinguish substructures’ planetary and non-planetary origins and uncover more young planets.

Host Institution: University of Chicago
Proposal Title: Enabling Radial Velocity Detection of Earth-Twins Through Data-Driven Algorithms and Community Collaboration
Lily Zhao grew up in west Philadelphia. She earned bachelors’ degrees in biology, mathematics, and physics from the University of Chicago in 2016. Lily was a National Science Foundation Graduate Research Fellow at Yale University, where she earned her doctorate in astronomy in 2021 under the supervision of Professor Debra Fischer. Since 2021, Lily has been a Flatiron Research Fellow at the Center for Computational Astrophysics.
Lily's research advances precision spectroscopy with a focus on dynamical discovery and characterization of lower-mass exoplanets. She is the project scientist for EXPRES, an ultra-stabilized optical spectrograph. Lily also leads the Extreme Stellar Signals Project, a community-wide collaboration with over 40 members working together to mitigate stellar signals, which are now the largest source of scatter in precision radial velocity measurements. As a Sagan Fellow at the University of Chicago, Lily will develop empirical methods for mitigating stellar signals using the full spectral format and continue coordinating community efforts.
Sebastian Zieba

Proposal Title: Characterization of Rocky Exoplanet Surfaces and Atmospheres in the JWST Era
Sebastian Zieba grew up in Salzburg, Austria. He earned his bachelor’s degree in physics from the University of Innsbruck in 2017. He remained in Innsbruck to pursue his master’s degree, during which he discovered transiting comets orbiting the exoplanet host star Beta Pictoris. After completing his master’s in 2020, he moved to Heidelberg, Germany to pursue a doctorate in astronomy under the supervision of Professor Laura Kreidberg, which he will complete in the summer of 2024.
During Sebastian’s doctorate research at the Max Planck Institute for Astronomy, he has pushed the boundary of atmospheric characterization down to small, rocky exoplanets. He has used space-based telescopes like the Spitzer Space Telescope, Hubble Space Telescope, and James Webb Space Telescope to cover an extensive temperature range, from lava worlds with outgassed rock vapor atmospheres caused by scorching temperatures exceeding 2000 Kelvin to terrestrial planets with temperatures around 400 K, more comparable to our own inner solar system.
As the Principal Investigator (PI) of two accepted Cycle 2 Webb proposals, Sebastian will characterize the surfaces of hot, airless planets, measure their surface roughness, and explore the transition region between rocky and gaseous planets. As a Sagan Fellow, he will analyze these upcoming observations to unravel the geological history of rocky exoplanets and determine the conditions under which these small worlds retain atmospheres.
Contact the NHFP
[email protected] NASA Hubble Fellowship Program
IMAGES
VIDEO
COMMENTS
Fig. 1. Historical growth of the world population since year 0. This will certainly not stop at the current 7 billion. According to the most recent projections by the United Nations, the number of 8 billion will probably be exceeded by 2025, and around 2045 there will be more than 9 billion people 1.
the world population. In the future, the proportion of Asia will come. down and that of Africa will increase. Africa was. populated by some 230 million people around 1950, or 9% of the world ...
The challenge posed by global population growth has been clear to most scientists since at least the 1950s. In the 1970s, it became conventional wisdom that "the population explosion" constituted a threat to humanity and to sound social, economic and ecological development. This conviction was clearly demonstrated at UN conferences on the environment (1972) and population (1974).
Abstract: The challenge posed by global population growth has been clear to most scientists since at least the 1950s. In the 1970s, it became conventional wisdom that "the population explosion" constituted a threat to humanity and to sound social, economic and ecological development.
As per the recent statistical data, the world population increased from 1 billion in the year 1800 to 7.8 billion today. The highest population growth is consecutively in Nigeria (66%), Pakistan ...
The differences in population growth between the world regions are charted and the debate about the consequences of the population explosion, involving poverty and food security, the impact on the natural environment, and migration flows is outlined. At the beginning of the nineteenth century, the total world population crossed the threshold of 1 billion people for the first time in the ...
Population explosion, population bomb, was first used in the pamphlet published in 1968, authored by Paul Ehrlich. In The Population Bomb, Ehrlich described the phenomenon of overpopulation (Ehrlich 1968, pp. 15-16). As explained by Collins English Dictionary, population explosion is a concept to describe a radical increase in population size ...
The actual population in India increased from 360 million in 1950 to nearly 1.4 billion in 2019; whereas, in the counterfactual example, India's population increased from 360 million to only 760 million in 2019. That's a difference of about 640 million fewer people. World population increased by 5.34 billion people from 1950 to 2019.
The U.S. Census Bureau (2017) estimates that crude birth and mortality rates in the EU are about equal at 10 per thousand people suggesting that the natural rate of population growth is zero. With net migration at two per thousand people, the EU did realize a positive population growth rate of 0.2%.
According to the forecast, the world's population will exceed 8.5 billion in 2030, 9.7 billion in 2050, and 11.1 billion by 2100. As it can be seen from Table 2, the population growth rate in Africa is expected to be much higher. The continent with the highest growth dynamics in the last century was Africa.
Etsako West population increased from 126,112 to 260,700 between 1991 to 2016 with an annual population change of 2.7 % and population density of 275.9/km 2 according to the 1991 and 2006 national ...
Empirically, most research finds that population growth is positively associated with CO 2 emissions increase (Bongaarts 1992; MacKellar et al. 1995; ... We cannot solve this controversy in this paper. Instead, our research objective is to assess the total effect (i.e., direct and indirect effects) from population growth on the environment in ...
A semi-systematic methodological approach was employed to search and synthesize information in relevant literature (Wong et al. 2013; Snyder 2019).Most of the literature selected in this review paper was obtained using different search engines: PubMed, Web of Science Core Collections, Scopus and many other scientific journals publishing websites, while organizational reports were screened from ...
The paper postulates many of the problems that are given birth by the population explosion. These problems unite together and give rise to some other dangers which ... In the present research, population explosion is the independent variable whereas environment and its factors as such air, water,
With the world's population projected to reach a staggering 9.3 billion by 2050, it's imperative that there be a thoughtful and vigorous response to the challenges posed by such demographic upheaval, says David Bloom, HSPH professor of economics and demography and chair of the Department of Global Health and Population.. In a syndicated commentary, Bloom writes that the world is likely to ...
In the research paper "The Population Explosion: Causes and Consequences" author Carolyn Kinder in year 1998 pointed various reasons for curbing population growth in uncontrolled manner as follows: until recently, birth rates and death rates were about the same, keeping the population stable. ...
The population explosion first occurred on a small scale and with a relatively moderate intensity in Europe and America, more or less between 1750 and 1950. From 1950 on, a much more substantial and intensive population explosion started to take place in Asia, Latin America and Africa (Fig. 2). Asia already represented over 55% of the world ...
The Office for National Statistics recently projected that the UK population would grow by a further 6.6 million over the next 12 years, overwhelmingly through migration. If you think the ...
"Essay on the Principle of Population" (first edition in 1789), Malthus argues justly that in time the growth of the population will inevitably slow down, either by an increase of the death rate or by a de-crease of the birth rate. On a local scale, migration also plays an important role. It is no coincidence that Malthus' essay appeared
Population explosion is one of the serious problems in our times now. Over the past years, our population is dramatically increasing. Our numbers are expected to rise again in the next years. Here in the Philippines, our population today had estimated to reach 103,775,002 according to the CIA World Factbook.
January 1981. D.G. Salita. The Philippines faces serious environmental problems such as population explosion; resource depletion. Geographic study will aid their solution and develop a population ...
The Seychellois economy continued to recover in 2023 and is moving closer to pre-pandemic norms despite external shocks and a complex disaster from flooding and an industrial explosion. The government made good progress in implementing the EFF and RSF—meeting almost all quantitative targets under the program and making notable progress on ...
Harlem Renaissance Research Paper. 1337 Words6 Pages. In the early 1900s, segregation and discrimination led thousands of African Americans to migrate to Northern cities such as New York. This large congregation of African Americans led to a cultural explosion known as the Harlem Renaissance. African-American music, art, literature, and ...
The positive impacts of population growth include the increasing variety of skills in society, increasing youth generation, motivation, and encouraging resource optimization (Khairul et al., 2018).
Sagan Fellow. Host Institution: University of California, Santa Barbara. Proposal Title: Optimizing the Vector Field for Next-generation Astrophysics. Jaren Ashcraft grew up on the Big Island of Hawai'i. He earned his bachelor's degree in optical engineering from the University of Rochester in 2019, and master's in optical sciences from the ...
The population explosion is itself is an economic problem and time it also leads to the social. problems in India also. It influences so many factors like social development, health, hygiene ...