- 281.412.7766
- [email protected]
- Learner Dashboard
- GET YOUR CAUSE MAPPING TEMPLATE
- About Cause Mapping®
- What is Root Cause Analysis?
- Cause Mapping® Method
- Cause Mapping® FAQs
- Why ThinkReliability?
- Online Workshops
- Online Short Courses
- On-Demand Training Catalog
- On-Demand Training Subscription
- Company Case Study
- Upcoming Webinars
- Webinar Archives
- Public Workshops
- Private Workshops
- Cause Mapping Certified Facilitator Program
- Our Services
- Facilitation, Consulting, and Coaching
- Root Cause Analysis Program Development
- Work Process Reliability™
- Cause Mapping® Template
- Root Cause Analysis Examples
- Video Library
- Articles and Downloads
- About ThinkReliability
- Client List
- Testimonials


Case Study: The Camp Fire - California's Most Destructive Wildfire
The most destructive wildfire ever.
The Camp Fire, California’s most destructive wildfire in history, burned in Butte County from November 8 through November 25, 2018, claiming at least 86 lives and causing an estimated $16.5 billion in damage. It burned more than 18,000 buildings, including the majority of the town of Paradise.
The “roots” of the problem
With a tragedy of this scope, the natural response is to want to determine why this happened and to figure out how to prevent a similar incident in the future. A Cause Map, a visual format for performing root cause analysis , can be built to dig into the numerous causes that led to this tragic fire. Creating a Cause Map helps organize information and make cause-and-effect relationships clear. The investigation into the fire is still underway, but an initial Cause Map can be developed to document what is known and then updated as more information becomes available.
Like most instances, there is more than one cause that contributed to this incident, and all the causes need to be understood to develop effective solutions that can be implemented to reduce the risk of future catastrophic fires. To view an intermediate level Cause Map of this root cause analysis example, click on the thumbnail below.

The fire starts
Investigators are still working to determine exactly what started the Camp Fire, but it has been reported in the media that the local electric company detected a problem on a transmission line 15 minutes before the first report of the blaze. Lawsuits allege that a faulty steel ring on a transmission tower resulted in live wires falling and igniting the fire.
The fire quickly grows
While the debate over how the fire started is ongoing, one thing everyone can agree on is that the Camp Fire spread rapidly. Drought over several years and dry weather in the months prior to this fire led to conditions prime for a fire to grow. Grass that had sprouted after a late spring rain dried out over the summer, providing a plentiful fuel source. Mix in high winds and the small fire quickly turned into a raging ember storm.
Unable to evacuate
The Cause Map of this tragedy illustrates that the size and speed of the fire wasn’t the only cause that contributed to the problem. The design and layout of the city of Paradise is also an important factor to consider. Paradise is located in the Sierra Nevada foothills and there are almost 100 miles of private roads that dead-end on narrow overlooks with relatively few streets connecting them. The evacuation route out of Paradise for 38,000 people was four roads running south. Evacuations routes were quickly gridlocked as residents attempted to flee to safety from the approaching fire.
Emergency planning
In preparation for a wildfire scenario, community leaders in Paradise had emergency plans and practiced evacuation drills, but the plans assumed an approaching fire would be a tamer wildfire like what the city had experienced in the past. There was no plan for how to evacuate the entire city at one time. The roads out of Paradise were gridlocked within an hour of the first evacuation notice . Three hours later, hundreds of people were trapped by flames within the city.
Additionally, the public alert system was problematic. Not all residents were signed up for CodeRed, a service that provided evacuation orders for the city. Communications were also compromised as fiber optic lines and cell towers were damaged by fire. Many of the residents never received an evacuation order.
Plan for the worst-case emergency
The lessons learned from this root cause analysis example go far beyond city planning. Every organization needs to develop a plan for how to respond to an emergency or natural disaster. Emergency plans are essential for a quick and effective response when a disaster strikes. Planning for common emergencies is useful, but planning for worst-case scenarios is also necessary because sometimes they become reality.
What's Next?
Ready to learn how to break down your own problems? Our 5-Why Online Short Course teaches people to apply cause-and-effect thinking to break down daily issues. This course is for frontline problem solvers, technical leads and management. It’s applicable to safety, environmental, operations, maintenance and administrative functions.
Share This Post With A Friend
Similar Posts
Other resources.
- Root Cause Analysis blog archive
- Patient Safety blog archive

READ BY - - - - - - - - - -
Other Resources - - - - - - - - - -

Sign Up For Our eNewsletter
Wildfire Today
News and opinion about wildland fire

Researchers conduct detailed case study of the Camp Fire
Establish a fire progression timeline

On a brisk November morning in 2018, a fire sparked in a remote stretch of canyon in Butte County, California, a region nestled against the western slopes of the Sierra Nevada mountains. Fueled by a sea of tinder created by drought, and propelled by powerful gusts, the flames grew and traveled rapidly. In less than 24 hours, the fire had swept through the town of Paradise and other communities, leaving a charred ruin in its wake.
The Camp Fire was the costliest disaster worldwide in 2018 and, having caused 85 deaths and destroyed more than 18,000 buildings, it became both the deadliest and most destructive wildfire in California’s history, two records the fire still holds today.
What made the Camp Fire so devastating? And what lessons can we learn to prevent another disaster of this scale? Researchers at the National Institute of Standards and Technology (NIST) have begun to answer these questions by investigating the conditions leading up to the fire and meticulously reconstructing the sequence of events describing the first 24 hours of its progression. A new report containing the timeline identifies areas where more research is needed to improve life safety and reduce structural losses. It also offers a detailed look at how a large and deadly fire advances — information that will become increasingly valuable as fire seasons continue to intensify.
“Going forward, there’s no reason to believe that fire activity and severity is going to lessen anytime soon. We’re never going to get rid of wildfires, natural or human-caused. But we can learn how to live with and work together to mitigate them.” —Steven Hawks, CAL FIRE chief and report co-author
“The information we collected on the timeline is extremely powerful by itself, not only for Paradise but for other similar communities, to help them understand what they may encounter and better prepare, whether it is at a community or at the first responder level,” said NIST fire protection engineer Alexander Maranghides, who led the timeline reconstruction.
To piece together the puzzle of the Camp Fire, the team carried out discussions with 157 first responders, local officials and utilities personnel who were present during the fire. The team documented sightings of fire or smoke and efforts to fight the fire or evacuate, as well as insights into community preparedness and weather conditions.

The researchers sought to back up observations made during the fire with additional data sources before adding new puzzle pieces to the timeline. With the help of the California Department of Forestry and Fire Protection (CAL FIRE), Paradise Police Department and others, the team gained access to and reviewed large data sets, including radio logs, 911 calls, dashboard and body camera recordings, and drone and satellite images. They also looked to images in social and news media to corroborate the sightings of discussion participants.
By the end of the painstaking process, the authors of the report incorporated more than 2,200 observations into the timeline, which is broken up into 15 separate segments to capture concurrent events throughout different sections of Butte County.
A Landscape Ripe for Disaster
The team’s investigation revealed several conditions throughout Butte County that, taken together, created favorable conditions for an inferno. On the day the fire broke out, wind gusts were powerful, blowing up to about 48 kilometers (30 miles) per hour, and were almost exclusively pointed southwest, toward Paradise and the smaller communities of Magalia and Concow. The 200 days of drought preceding the fire had also transformed much of the region’s lush terrain into combustible ground.
And perhaps counterintuitively, Maranghides said, the relatively large distance between the fire’s origin and the edge of Paradise (about 11 kilometers, or 7 miles) contributed to the massive, 3.2-kilometer (2-mile)-long fire front that crashed into the town.
“If a fire starts far away, upwind, then it has time to develop and expand. By the time it hits the community it is so large and so powerful that it could wipe everything out,” Maranghides said. “But if it ignites closer, the fire can be so much smaller. It takes a much smaller bite out of the community, and people may have a fighting chance.”
The report indicates that town officials in Butte County went to great lengths to prepare for fires, having cleared vegetative fuels near critical infrastructure and bolstered emergency communications in the weeks and months prior. However, dense vegetation had still accumulated throughout Paradise — a factor enhanced by the nearly 100 years the town had gone without experiencing a wildfire.
The researchers learned that, although Paradise made resources available for residents to remove trees, many did not take the city up on its offer. One participant in the reconstruction noted that residents were often attracted to the lifestyle of “living in the forest” provided by the town.
With a gamut of unfavorable conditions at play, a spark in the wilderness quickly became a raging inferno.
Breaking Down the Camp Fire’s Assault
The fire’s siege on Paradise, which ultimately destroyed 85% of the town’s buildings, began before its front line reached the city limits. Showers of burning debris were carried by the wind ahead of the main fire into town, where the embers ignited buildings and vegetation, riddling the town with dozens of smaller fires that ate up precious firefighting resources.

Propelling the Camp Fire’s structure-destroying spree were fires that spread within and between plots of land, or parcels, rather than from the fire front. Sources such as burning sheds, plants, vehicles and neighboring houses caused many buildings to catch fire, either through direct contact with flames or embers generated in parcels.
Paradise’s defenses quickly fell once the fire front reached town. The incident commander leading the emergency response recognized the fire’s speed and intensity and ordered his personnel to abandon all firefighting efforts just 45 minutes after the fire arrived. “Save lives, keep evacuation moving,” the incident commander said over the radio.
Although the focus of emergency response narrowed on saving lives, evacuation efforts were stifled by burnovers — life-threatening events in which residents or first responders are overrun by flames, cutting them off from escape routes. Across Paradise and Concow there were 19 burnovers at least, some of which involved downed power lines or flaming vegetation that blocked off roads, causing gridlock and putting lives in danger.
In the past, recorded burnovers were sparse, with reports attributing few or none to most fires. Hardly any have been scrutinized as heavily as the Camp Fire, however, which could partially explain the event’s high number of documented burnovers. Another critical contributor was likely Paradise’s heavily wooded nature, Maranghides said.
The abundance of burnovers during the Camp Fire may not be an isolated event, but part of a larger trend, particularly for communities where vegetative fuels have built up over many years.
“The significant activity we’ve experienced in the last few years may indicate that burnovers are becoming more frequent than they used to be,” said CAL FIRE chief Steven Hawks, a co-author of the report. “My sense is that because fires are burning so fast now, there is more potential for people to become trapped.”
Toward Fire-Safe Communities
With this report, NIST has shone light on the many aspects of the Camp Fire’s multipronged attack. Research into these threats could fill critical knowledge gaps, paving the way for science-based codes, standards and practices that could help communities outsmart fires.
What’s urgently needed, the authors write, are methods of capturing the severity of burnovers and a better understanding of how they occur in the first place. Studies in this area could make way for guidelines on reducing their likelihood and protecting evacuation routes.

As for buildings, there are already two known options for increasing their chances of surviving a wildfire. The first is to make sure combustible items within a parcel (plants, sheds, etc.) are not too close to a structure, and the second is to increase the fire resistance of a structure’s materials. But striking a cost-effective balance between the two is difficult with the limited information on how various fuel sources threaten buildings.
“We need to improve our understanding at the parcel level because it’s the parcel-level exposures that drive the building’s survivability,” Maranghides said. “You cannot just look at the building in absence of what’s around it.”
Once researchers can put numbers to the behavior of embers and combustibles in parcels, it may become more clear what a particular building needs in terms of spacing and hardening to hold up to a wildfire.
City officials could use the report’s timeline for emergency planning as well. By having a detailed description of events such as burnovers in front of them, members of city councils or public works departments in wildfire-prone regions could evaluate their own emergency plans and potentially identify vulnerabilities.
There is currently no standard method of comparing the wildfire hazards of communities. So, although the researchers could draw individual similarities between Paradise and other communities in Northern California, they were unsure how the town compared as a whole. The team aimed to bridge this gap by developing a framework in the form of a document encouraging city officials to record specific information on fuels, population, emergency notifications and other aspects of the community.
If adopted and employed statewide in California and in other wildfire-prone areas, the framework, which appears in the report, could reveal areas most at risk and worthy of attention and resources, Maranghides said.
In the hands of first responders, the new report could become valuable training material. Using data on how quickly and intensely the fire grew, commanders could build tabletop exercises to practice deploying firefighting resources to counter its spread and save lives.
An event on the scale of the Camp Fire makes it clear that action is needed at all levels to protect communities from wildfires, Hawks said. And that need is perhaps more urgent now than ever.
“Going forward, there’s no reason to believe that fire activity and severity is going to lessen anytime soon,” Hawks said. “We’re never going to get rid of wildfires, natural or human-caused. But we can learn how to live with and work together to mitigate them.”
The full report is now available, along with several maps portraying the fire spread. The timeline of fire progression will form the basis for subsequent reports on evacuation and emergency response during the Camp Fire that the NIST team plans to publish in the coming months.
Thanks and a tip of the hat go out to Paula and Jack.
Typos, let us know HERE , and specify which article. Please read the commenting rules before you post a comment.
Share this:
Author: Bill Gabbert
After working full time in wildland fire for 33 years, he continues to learn, and strives to be a Student of Fire. View all posts by Bill Gabbert
One thought on “Researchers conduct detailed case study of the Camp Fire”
My wife and I stayed and fought the fire for 12 hours. It wasn’t a rash or emotional decision. We had prepared for a fire by extending our defensible space for four years before the fire. We had seven hose bibs, all with hoses on them. We ended up by combining all the hoses to make two 200-foot hoses AND SAVED 4 HOUSES. My wife literally put out the fire that started on the house next door. I have lived in my house for 37 years. I first lived here in 1955 and my wife has lived here continuously since 1968. When it comes to fire, we know what works and what doesn’t. We have lots of pictures and videos of before and during the fire. Some show exactly what you talked about. Mainly, structures and objects that catch on fire and cause the next house to catch on fire. We would love to have a way of showing the people in charge, videos showing what caused the fire to spread from house to house and some simple building code changes that could have saved many houses.
Comments are closed.
Climate change Case study: wildfires
Understanding the causes and potential consequences of global climate change on people and the environment are crucial in implementing strategies to reduce the threat of climate change in the future.
Part of Geography Global issues
Case study: wildfires
One of the major predictions made about climate change is that incidents of extreme weather will become more common. This can include weather events such as drought, flooding, storms, and wildfires.
The summer of 2021 saw several areas in Europe and North America experience heatwaves that lead to severe problems.
In these areas, drought conditions dried out forests and scrubland which provided the perfect fuel for wildfires. The lack of moisture or rain meant that, once the fires had taken hold, there was little to stop them spreading quickly over large areas.
As well as devastating huge areas, destroying homes, and endangering lives, huge forest fires release large amounts of carbon dioxide into the atmosphere.
Turkish and Greek wildfires

In July and August of 2021 a prolonged heatwave temperatures soared to above 40 Celsius. This lead to the outbreak of widespread and catastrophic wildfires.
In Greece, wildfires spread across the island of Evia and on the mainland to the north and east of Athens. In some of the worst fires seen in Greece in decades, over 57,000 hectares of land was burnt, destroying homes and farmland. Two people have been reported dead and dozens have been hospitalised.
In Turkey, wildfires spread unchecked through large parts of the south of the country with key tourist destinations such as Marmaris coming under threat.
North American wildfires

In the USA, Californian fire-fighters are tackling the second largest fire in the history of the state . The Dixie Fire has already devastated an area of land twice the size of New York City.
This blaze is just one of over a hundred blazes in the country, with others spreading across the south and west.
The fires in California in 2021 are already close to surpassing the 2020 fires which was one of the worst fire seasons in the state's history.
Canada has also experienced unusually high temperatures that have led to over 200 wildfires spreading through the western province of British Columbia.
More guides on this topic
- Natural regions
- Environmental hazards
- Trade and globalisation
- Global tourism
- Classroom Videos
Related links
- BBC Weather
- BBC News: Science, Environment
- BBC Two: Landward
- SQA National 5 Geography
- Planet Diary
- Scotland's Environment
- Royal Geographical Society
- Case Studies
- Teaching Guide
- Using the Open Case Studies Website
- Using the UBC Wiki
- Open Educational Resources
- Case Implementation
- Get Involved
- Process Documentation
Fort McMurray and the Fires of Climate Change
Fort McMurray, located in a beautiful service area with vast oil sands deposit in northeast of Alberta, is surrounded by peatlands and boreal forests of aspen and spruce. Though normally very wet, Fort McMurray is relative dry and hot in summer, and its weather is becoming more extreme because of climate change. With a low moisture content and a high volume of resin for defence against disease, stems of trees in boreal forests are highly flammable. Beginning southwest of Fort McMurray, Alberta on May 1st, 2016, the wildfire swept through forests and communities and destroyed around 2,400 buildings in only two days, resulting in over 8,000 residents to leave their homes. Ultimately, it was under control by July 5th, 2016. The fire, reported spreading cross 590,000 hectares, is the costliest disaster in Canadian history. The intense forest fire has a profound impact on local environment and ecology. About 500 species of wildlife lost their habitats or were in danger due to the fire. Many wastes such as ash and rotting food were produced in the burning process. The fire also released a large amount of CO2 and other toxic contaminants including heavy metals and PAHs deposited on trees and soils.
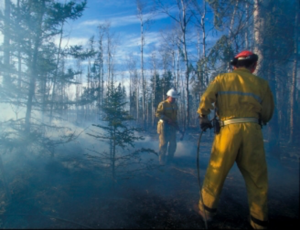
On May 1st, 2016 at 9:57pm (MDT), a wildfire began to sweep the Centennial Trailer Park and the neighborhoods of Prairie Creek and Gregoire at the southwest of Fort McMurray, Alberta, Canada. On May 3rd, 2016 [1] , this event was described as the largest wildfire event in Alberta’s history. Canadian military, Royal Canadian Mounted Police, Canadian provincial agencies, 300 South African firefighters and many charitable organizations, such as the Canadian Red Cross, all participated into the rescue work in this fire event. Numerous rescue teams came to help the residents in McMurray to evacuate from the extremely unsafe communities. The Canadian Red Cross provided McMurray residents with many medical treatment and donations [1] .
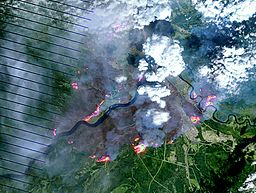
Fort McMurray is a beautiful urban area which covers 59.89 km² in the northeast of Alberta, Canada. This city is surrounded by boreal forest and 2 main rivers: Athabasca river and Clear Water river. There are also several peat bogs within the forest. The whole Boreal forest is located in a flat plain with few hills. And the Rocky Mountains are on the west side of this plaint. The forest fire was started at the southwest of the urban service, and expanded around especially the southeast side.
The wildfire lasted for two months in Fort McMurray, Alberta, Canada, and it started to be under control by July 5th, 2016. The wildfire spread cross 590,000 hectares (1500,000 acres) from the edge of the southwest of Fort McMurray to the northern Alberta, and finally stopped in Saskatchewan, a province with prairie and boreal that bordering the west of Alberta. [3] The sweeping of the wildfire destroyed approximately 2,400 houses and buildings in the southwest of Fort McMurray. Nearly 8,000 residents had to move out of their quarters due to the severe contamination. However, the fire was not under control after sweeping in southwest of Fort McMurray. It became severer and began to spread across the northern part of Alberta and Saskatchewan [2] . Thousands hectares of forest area and a huge number of Athabasca oil sands, one of the three major oil sands deposits of bitumen and extremely heavy crude oil, in Alberta, were further destroyed with the expanding of wildfire By July 5th , 2016, only some small areas were contaminated by the McMurray wildfire and it was reported to be under controlled. Although the fierce spreading of the wildfire was controlled in early July, smoldering fire still continued in Fort McMurray, Alberta. The smoldering fire was not stopped to give negative impacts on natural resources and human beings until the spring of 2017
Wildfires in Canada’s forests are very common. Ecological professionals and fire management departments often see fire as a beneficial thing for maintaining the ecological values of forests [3] . According to the statistics in 2016, fires in Canada’s boreal forest burn an average of 2 million hectares of forest every year [3] . The large McMurray wildfire spreading, however, had enormous negative impacts on local environment, ecology, economic activities and society. How can the McMurray burning be special on the Canada’s wildfire history?
Negative impacts on local environmental and ecology
The explosive burning brought a lot of air pollution to Fort McMurray. The large amount of CO 2 released by the burning increased the “greenhouse” effect in Fort McMurray area [4] . The burning of cars, factories and buildings brought hundreds of mercury, many other heavy metals and polycyclic aromatic hydrocarbons (PAHs), which fell on the tree branches and soil [4] . Because contaminants made the air toxic, humans and animals had to breath thousands of small toxic particles into their lungs. As a result, air pollution leads to a huge negative impact on human and animals’ health. In addition to the air pollution, the burning in Fort McMurray also contaminated water [4] . Mercury, polycyclic aromatic hydrocarbons (PAHs) ,and other heavy metals would not only fell onto the forest floors, but also into rivers and streambanks [4] . Athabasca River was the one that received most severe contaminations [5] . Athabasca River became a spot fire during this event [5] . Rainwater in McMurray settled down toxins into the rivers and streambanks. Water previously used by people and animals nearby became toxic during the explosive burning period.
Forests damages and Habitat losses
Forests in Fort McMurray area are mainly mixed boreal forests [4] . The recent dry climate is the main cause of the severity of this explosive wildfire. Tree roots and soils were scorched. The tree species composition and forest type would be changed by this event. Due to the burning in forests areas, about 500 species lost their habitats and now living in danger due to the fire contamination [4] .
Many wastes such as ash and rotting food were produced in the burning process [4] . Waste in the natural areas like forests would not greatly influence people’s daily life in Fort McMurray area. However, it became a serious issue when it continually accumulated in the crowded communities where McMurray people living. Two major contributions of the wastes are toxic ashes and rotting food [4] . Debris and fire-damaged concretes from vehicles, furniture, and public infrastructure including sidewalks and benches in parks were stacked on streets and destroyed constructions after the fire [4] . Communities that people used to happily live in became ruins after the explosive burning. A lot of works needed carrying out to clean the wastes in Fort McMurray area.
Negative impacts on economic and social activities
As people known, the development of oil sand industry in Alberta has promoted the economy of Alberta and Canada over decades [6] . The oil sand production industry in Alberta created hundreds of employment opportunities and contributed millions of tax revenue for the local and federal government. In the reports of assessment of the Fort McMurray wildfire, released by the mid-May in 2016 in Ottawa, two major negative economic impacts are described in the following:
- 1 The Fort McMurray wildfire drops the overall GDP of Alberta to a negative value in the year of 2016. Its economic impact on the national overall GDP is not noticeable.
- 2 Shutting down of the oil sand production actually slowed or even stopped the major economic activity of the oil production industry in Alberta. According to the statistics in the Report of Economic Impacts of the Fort McMurray Wildfires, 1.2 million barrels’ oil were lost per day on average for 14 days. This huge amount of oil lost was translated to direct money lost, equaling roughly $985 million real GDP and 0.33 per cent out of Alberta’s GDP in 2016 [7] .
Layering Perspectives: Other Costs and Impacts?
The information above outlines some of the impacts associated with wildfire in Fort McMuray from the perspective of a natural resources conservation student. In this section, we welcome contributions from other perspectives. Those interested in contributing to this case study may use the following questions as a guide:
- What other costs and/or impacts become apparent when wildfire is viewed through the lens of other disciplines and professions?
- What special expertise, resources, or theoretical orientations might others bring to help us better conceptualize the costs and/or impacts associated with wildfire?
However, there is always another loss that cannot be calculated by these statistics. That is the influence on people’s lives and livelihoods [7] . Over 8,000 residents moved away from their homes and lost their personal property during Fort McMurray wildfires. One thing that is worth being happy during this disaster is that the depressions mood among stricken people in Fort McMurray did not bring a lot of negative impacts on economic and social activities. A rebuilding fund was added to the real GDP in Alberta’s economy in 2017, and it contributed to roughly 0.4% of the overall GDP increase of Alberta. Rebuilding of the lost assets promoted more economic and social activities than before [7] . People in McMurray returned to their homes after the disaster in the early spring of 2017. Funds for rebuilding compensate the lost capitals, and provide many employment positions for the returned residents. However, there is no doubt that the Fort McMurray Wildfires is one of the costliest natural disasters in the history of Alberta. In short, what makes this wildfire special and costly is its intensity, severity and location, which is in the central part of the oil sand industry in Alberta.
Analyzing the fire from local climate and ecosystem
Fort McMurray is located in the Boreal Plains Ecozone, where 84% of the land is covered by forest and less than 20% of the land is used by agriculture. [8] Spruce, pine and aspen are the most common species in this area. These conifer trees have high concentration of resin, which are susceptible to fire. During the long time evolution, these species and the ecosystem have adapted to wildfire. According to the climate record from McMurray airport, the summer starts from May with the average temperature of 9.8°C calculated by the data between 1981and 2010. The highest temperature is around 17°C and the mean precipitation is 36.5mm (33.5mm in rainfall and 3.5mm in snowfall each). June and July have the highest temperatures in record with the precipitation increasing dramatically to 73.3mm and 80.7mm separately. [9]
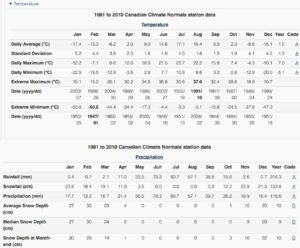
However, the max temperature in 1st May in last year was 27.3°C, which is much higher than the historic records. The foresters in Fort McMurray said the trees in 2015 have suffered a summer drought. And this trend was kept to 2016, caused by the high temperature with low precipitation in 2016. The climate change was considered to be the direct effect to this disturbance. [10] According to the Fir Behavior Triangle, this large fire is not that hard to understand. By analysing the data above, we can easily find the summer in McMurray are used to being pretty warm and wet. Water storage in the whole range of forest is enough for tree species to live during the growing season. The roots of trees living in this area are quite shallow, since they do not have to extend very deep to gather water. Tangled and twisted roots living in the shallow soil with a lot of air is easy to be burned but hard to be put out during the burning. As a result, expanded fire were out of control even if firemen cut several trees to create a gap to separate the fire and unburned forests because of underground burning. [10] By the time goes, precipitation did helped a little bit during the extinguishing of the fire when summer came in June and July. [11]
Analyzing the fire from local economic structure
Fort McMurray is famous for its Athabasca oil sand which is the largest oil sands deposit in the world (143×10 9 m 3 in total). [12] These large amount of oil sands is another fuels in this huge fire. What is more, the file expanded faster than we expected because of these oil sand. Even there is nothing to burn above the ground, the fire can still expand below the ground by soil sands. Even precipitation or crown cutting can hardly stop these underground fire.
Since the oil sands are stored below the ground surface, the most useful way to get the oil sands is digging them and extracting while the precondition of using this method is clear cutting all the plants above the ground. As a result, large are of forest were damaged by oil sands industry until 2009 when the new technology allowed extracting oil sands without disturbing the species. But the new technology is much more expensive and with low extract rate, digging the oil sands is still the most popular way in oil companies today. [13] Losing the forest in this area ruined the local environment and climate a lot. The water storage ability has dropped down a lot because of losing plants. Usually, the roots of plants cooperate with the soil system to maintain the water balance for all the species in this area. Summer drought is going to be a serious problem to all the species left in this area. Furthermore, photosynthesis can reduce the CO2 to reduce the climate change. Clear cutting speed up the climate change to create a more horrible climate for forest to live. "Climate change models and research all point to the idea that fire season is going to be longer in the coming years, and the fires will be more severe," professor David Andison in the faculty of forestry at UBC said. [14]
Energy development is the pillar industry in Alberta which is the largest contribute to the GDP and investments in the states. [15] Moreover, people in Alberta believe that they have the potential to be the the leading energy provider in the world. [16] According to the job survey investigated by the Government of Alberta, 51% of the labor force in Fort McMurray were hired by oil and gas industry directly and most of other people are doing the relative works of energy industry in 2005. [17] It’s not hard to imagine how huge effects this fire caused to Fort McMurray. People not only lost their home, but also lost their jobs. The local economy could hardly be built up in a short time because of their high reliability to the energy industry. Since Athabasca is the largest oil sand deposit in the world, the oil price was influenced by this wild fire last year. [18]
Options for emergency operations and Recommendations
When the wildfire happened on May 1st 2016, the government implemented the emergency operations rapidly [19] . On May 3nd, a large evacuation was addressed by the government, leading to disorder to some degree unavoidably [19] . However, considering of the safety of all residents in Fort McMurray area, it is still a rational and timely act [19] . The Provincial Operations Centre (POC) was fully activated at the highest emergency level [19] . Meanwhile, steady communication between the government and impacted sites was established [19] . News coverages and social media were used frequently to message residents the latest information and placement measures [19] . After the process of evacuation being accomplished, lots of shelters and goods were offered to evacuees to meet their basic requirements instantly by the government, volunteers and charitable organisms [19] . Meantime, professional firefighters and other first responders from a variety of countries and regions were staying behind to fight for controlling wildfire [19] . At the same time, a number of evacuees contacted with Alberta Health Services (AHS) to request for mental health support [19] . Eventually, the fire was under control thanks for the joint effort made by the Government of Alberta, Regional Municipality of Wood Buffalo, Canadian Red Cross, Indigenous communities, and the Government of Canada on July 4th [19] . Generally speaking, the emergency operations conducted by the government of Alberta was timely and effective. The evacuation order ensured the basic safety of individuals while the mental health support helped to make the public calm down. However, the high demand on mental health support revealed the lack of professional staff in this specific field. Therefore, more support for mental health care were needed from society.
Option for long-term recovery measurements and Recommendations
After controlling the wildfire, the government started to concern about the reentry and recovery in the Fort McMurray region [19] . During the time, air and water quality was evaluated firstly by the monitoring program of the Government of Alberta, along with the regional Municipality of Wood Buffalo and the Wood Buffalo Environmental Association [19] . Meanwhile, the provincial and municipal officers worked together to ensure the availability of essential services such as electricity in the area, then the re-entry program was implemented and re-cleaning was started to be conducted by residents [19] .
As the wildfire was diminished and many people returned to their homes, the recovery programs became an important step of next phase [19] . By Learning from the recovery works of past disasters, 5 categories in total are grouped up: people, economy, reconstruction, Environmental and mitigation [19] .
People having experienced a tragedy often show symptoms of stress and anxiety [19] . Thus, there is a need of short-term mental health support, such as consultant, and instant and long treatments [19] . In order to figure out and address the mental problem, the government has approved a budget of 18.65 million dollars for the first year to conduct mental health programs [19] . Moreover, in order to provide temporary shelters for homeless especially those who do not have ability to afford the rent, the Government of Alberta established some financial association to provide economical support [19] .
Suffering from the disaster, lots of small businesses faced challenges [19] . Not only lost their employees, they also had their properties and goods damaged. Nevertheless, many small businesses also played an important role in recovery work in communities [19] . A support of 1000 dollars was granted to each eligible small business by Canadian Red Cross [19] . The Regional Municipality of Wood Buffalo has been working on encouraging as much recovery work as possible to local contractors and local workers, and looking at promoting “buy local” or “open for business” campaigns [19] . Besides, employees cannot be ignored as well. The connection between employees and employers should be paid attention to. Moreover, as a fundamental and key role in economic development and recovery, the stability and availability of public transportation need to be ensured.
In terms of the policies about environment, the theme is to monitor the long-term environmental impacts and to mitigate potential risks [19] . To meet the requirement, the main work will include but is not limited to monitor air, soil and water quality [19] . In order to record the long-term environmental impacts of wildfire, the regional monitoring will be modified [19] . In fact, the environment contains not only air and water. What the government do is just to ensure the safety of basic living condition. However, what should be taken into account are not only the climatic factors, but also the non-climatic factors such as the disease spread rate. In addition, other pollutants also need monitoring in order to avoid any potential negative impacts on residents.
Even as the communities in the Fort McMurray area have started the clean-up and recovering from the disaster, lots of works are still required to reduce and mitigate the risk of future natural emergencies [19] . In order to reduce the frequency of disasters like wildfire, the government has been increasing the invest in mitigation of natural disasters and other public safety risks [19] . To achieve this goal, the Government of Alberta is committed to reduce and avoid the potential of other wildfire events that may threaten communities in the Regional Municipality of Wood Buffalo in the future [19] . Three programs designed for this project are named Disaster preparedness, FireSmart, and Flood mitigation respectively [19] . Probably these programs have not shown an obvious effect as people surviving from Fort McMurray Fire are highly alert to wildfire. However, it is quite wise and farsighted to launch such programs for long-term prevention.
Layering Perspectives: Other Alternatives Solutions and Recommendations
In this section we welcome contributions from scholars and students to widen the scope of possible solutions in addressing the impacts associated with wildfire. Those interested in contributing to this case study may use the following questions as a guide:
- Viewed through the lens of other disciplines and professions, what other actors become relevant when considering recovery recommendations and preventative strategies to address costs and impact associated with wildfires?
- What special expertise, resources, or theoretical orientations might others bring to help us better mitigate challenges associated with wildfires?
The 2016 Fort McMurray Fire is the largest, severest, and costliest natural disaster in Alberta’s, even the Canadian, history [1] . The occurrence of the wildfire is mainly due to the supportive natural factors, including the dry and hot summer environment in Alberta and the availability of plenty of fuels such as forests wood and oil sands [5] . The life of thousands of residents in the area and the local environment were greatly destroyed by the fire. The economic activities and social development of Fort McMurray were impacted and even paused in a long period as well.
Both the local and national government showed a timely response to the emergency right after it occurrence, taking a series of actions to ensure the security of local people and to control the fire. Nonetheless, a more completed emergency reacting system should be carried out by the government in order to prevent secondary injuries after the catastrophe. Also, a cooperative approach which involves both the government and the public is required to ensure the steady long-term efforts for the recovery programs of Fort McMurray in the future. The rationale of this solution is the intensity and severity of the negative impacts of the disaster. As discussed above, the 2016 Fort McMurray Fire is one of the severest and costliest natural disaster in Canadian history [1] . Although the wildfire only last for a few months, its huge damage and negative impacts cannot be eliminated in even several years. Thus, countless efforts need putting into the urban and environmental recovery, which is definitely cannot be accomplished only by the government. A holistic approach [20] [21] to involve the public into the post-disaster reconstruction will be the most effective and practical way in regard to the recovery program, which includes environmental recovery, community rebuilding, economy restarting, and mental health support for the disaster victims [19] . To be specific, the government should implement a set of policies to encourage more individuals and charitable organizations to take part in the reconstruction of Fort McMurray area. The recovery programs will be conducted efficiently only when the public actively participate in and contribute their effort to the reconstruction. And it is the only possible way for the government to fill the deficit between the need of resources for the post-disaster recovery and what the government can provide.
- ↑ 1.0 1.1 1.2 1.3 Wikipedia. (2017). 2016 Fort McMurray Wildfire. Retrieved from: https://en.wikipedia.org/wiki/2016_Fort_McMurray_Wildfire
- ↑ Wikipedia. (2017). Saskatchewan. Retrieved from: https://en.wikipedia.org/wiki/Saskatchewan
- ↑ 3.0 3.1 Natural resources Canada. (2016). Fire management-an attitude shift. Retrieved from: http://www.nrcan.gc.ca/forests/fire-insects-disturbances/fire/13157
- ↑ 4.0 4.1 4.2 4.3 4.4 4.5 4.6 4.7 4.8 Leahy, S. (2016). Canada wildfire-what are the environmental impacts? Retrieved from: https://www.theguardian.com/environment/2016/may/11/canada-wildfire- environmental-impacts-fort-mcmurray
- ↑ 5.0 5.1 5.2 Wikipedia. (2017). Athabasa oil sands. Retrieved from: https://en.wikipedia.org/wiki/Athabasca_oil_sands
- ↑ Government of Alberta. (2017). Facts and Statistics on Alberta energy. Retrieved from: http://www.energy.alberta.ca/OilSands/791.asp
- ↑ 7.0 7.1 7.2 The Conference Board of Canada. (2016). Economic impacts of the Fort McMurray wildfires. Retrieved from: http://www.conferenceboard.ca/press/newsrelease/16- 05-17/economic_impacts_of_the_fort_mcmurray_wildfires.aspx
- ↑ Government of Canada. (2016). Boreal Plains Ecozone. Retrieved from Ecological Framework of Canada: http://ecozones.ca/english/zone/BorealPlains/land.html
- ↑ Government of Canada . (2017). Canadian Climate Normals 1981- 2010 Station Data. Retrieved from Government of Canada: http://climate.weather.gc.ca/climate_normals/results_1981_2010_e.html?stnID=2519 &lang=e&province=AB&provSubmit=go&page=51&dCode=1
- ↑ 10.0 10.1 Warzecha, M. (2016). “Why the boreal burns: The trees surrounding Fort McMurray are hard-wired for fire.” Retrieved from National Post: http://news.nationalpost.com/news/canada/why-the-boreal-burns-the-trees- surrounding-fort-mcmurray-are-hard-wired-for-fire
- ↑ Lucas, P. (2016). Fort McMurray wildfire burning so hot, only weather can stop it. Retrieved from CBC news: http://www.cbc.ca/news/technology/alberta-wildfire-science-background-1.3565932
- ↑ Daryl M. Wightman, S. G. (1997). The Lower Cretaceous (Aptian) McMurray Formation: An Overview of the Fort McMurray Area, Northeastern, Alberta. Retrieved from CSPG Special Publications: http://archives.datapages.com/data/cspg_sp/data/018/018001/312_cspgsp0180312.ht m
- ↑ Frances J. Hein, D. K. (2006). The Athabasca Oil Sands — A Regional Geological Perspective, Fort McMurray Area, Alberta, Canada. Natural Resources Research, 15, 85-102. Retrieved from https://link.springer.com/article/10.1007/s11053-006-9015-4
- ↑ Powers, L. (2016). CBC News Technology & Science. Retrieved from CBC: http://www.cbc.ca/news/technology/alberta-wildfire-science-background- 1.3565932
- ↑ Government of Alberta. (2015). Fort McMurray Mineable Oil Sands IRMP. Retrieved from Alberta Environment and Parks: http://aep.alberta.ca/lands-forests/landuse-planning/fort-mcmurray-mineable-oil- sands-irmp.aspx
- ↑ Alberta Canada. (2016). About the industry. Retrieved from Alberta Canada: http://www.albertacanada.com/business/industries/og-about-the-industry.aspx
- ↑ Worland, J. (2016). Wildfire in Fort McMurray, Canada Causes Oil Prices to Surge. Retrieved from Time: http://time.com/4319287/fort-mcmurray- canada-wildfire-oil-prices/
- ↑ 19.00 19.01 19.02 19.03 19.04 19.05 19.06 19.07 19.08 19.09 19.10 19.11 19.12 19.13 19.14 19.15 19.16 19.17 19.18 19.19 19.20 19.21 19.22 19.23 19.24 19.25 19.26 19.27 19.28 19.29 19.30 Government of Alberta. (2017). Home Again: Recovery after the Wood Buffalo Wildfire. (Report No. ISBN 978-1-4601-3135-0). Retrieved from https://www.alberta.ca/documents/Wildfire-Home-Again-Report.pdf
- ↑ Oshry, Barry. (2008). Seeing Systems: Unlocking the Mysteries of Organizational Life , Berrett-Koehler
- ↑ Auyang, Sunny Y. (1999). Foundations of Complex-system Theories: in Economics, Evolutionary Biology, and Statistical Physics , Cambridge University Press
Post image: Wild fire spreads in Fort McMurray. Public domain, via Wikimedia Commons
Advertisement
The geography of social vulnerability and wildfire occurrence (1984–2018) in the conterminous USA
- Original Paper
- Published: 08 January 2024
- Volume 120 , pages 4297–4327, ( 2024 )
Cite this article

- Ronald L. Schumann III ORCID: orcid.org/0000-0002-2293-6331 1 ,
- Christopher T. Emrich 2 ,
- Van Butsic 3 ,
- Miranda H. Mockrin 4 ,
- Yao Zhou 5 ,
- Cassandra Johnson Gaither 6 ,
- Owen Price 7 ,
- Alexandra D. Syphard 8 ,
- Joshua Whittaker 7 &
- Sanam K. Aksha 2
554 Accesses
1 Altmetric
Explore all metrics
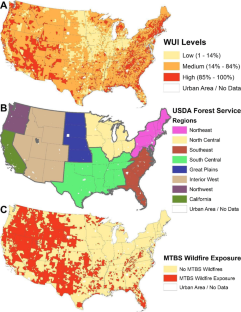
Wildfire is increasing in frequency, extent, and severity in many parts of the USA. Considering the unequal burden of natural hazards on socially vulnerable populations, we ask here, how are characteristics of social vulnerability associated with wildfire occurrence nationwide, at different scales and across differing levels of wildland–urban interface development? To answer this question, we first identify all non-urban census tracts in the USA that have experienced a wildfire since 1984. Using 26 different measures of social vulnerability, we compare these tracts to non-urban census tracts that have not experienced a wildfire. In doing so, we identify notable social vulnerabilities in areas that have experienced wildfire, including higher unemployment, higher employment in extractive industries, higher percentage of people living in mobile homes, higher percentages of Native Americans, higher percentage of people with less than 12th grade education, and higher populations of people with special needs. Breaking our data into eight regions and comparing tracts with a high proportion of wildland–urban interface (WUI) to those with a low proportion of WUI, we find that these characteristics are generally consistent across regions of the USA and vary slightly between high WUI and low WUI tracts. Overall, we find a robust pattern of higher social vulnerability in areas with wildfire occurrence. Whereas previous studies about social vulnerability to wildfire focus on relationships with wildfire hazard potential or concentrate on a single region, this study fills a knowledge gap by examining the relationship between social vulnerability and wildfire occurrence nationwide.
This is a preview of subscription content, log in via an institution to check access.
Access this article
Price includes VAT (Russian Federation)
Instant access to the full article PDF.
Rent this article via DeepDyve
Institutional subscriptions
Do fires discriminate? Socio-economic disadvantage, wildfire hazard exposure and the Australian 2019–20 ‘Black Summer’ fires

Subsidized Households and Wildfire Hazards in California

Evaluating the Characteristics of Social Vulnerability to Wildfire: Demographics, Perceptions, and Parcel Characteristics
Abatzoglou JT, Balch JK, Bradley BA, Kolden CA (2018) Human-related ignitions concurrent with high winds promote large wildfires across the USA. Int J Wildland Fire 27:377. https://doi.org/10.1071/WF17149
Article Google Scholar
Afrin S, Garcia-Menendez F (2021) Potential impacts of prescribed fire smoke on public health and socially vulnerable populations in a Southeastern U.S. state. Sci Total Environ 794:148712. https://doi.org/10.1016/j.scitotenv.2021.148712
Article CAS Google Scholar
Ager AA, Vaillant NM, Finney MA (2011) Integrating fire behavior models and geospatial analysis for wildland fire risk assessment and fuel management planning. J Combust 2011:1–19. https://doi.org/10.1155/2011/572452
Ager AA, Vaillant NM, Finney MA, Preisler HK (2012) Analyzing wildfire exposure and source–sink relationships on a fire prone forest landscape. For Ecol Manag 267:271–283. https://doi.org/10.1016/j.foreco.2011.11.021
Andersen LM, Sugg MM (2019) Geographic multi-criteria evaluation and validation: a case study of wildfire vulnerability in Western North Carolina, USA following the 2016 wildfires. Int J Disaster Risk Reduct 39:101123. https://doi.org/10.1016/j.ijdrr.2019.101123
Anderson SE, Plantinga AJ, Wibbenmeyer M (2023) Inequality in agency response: evidence from salient wildfire events. J Polit 85:625–639. https://doi.org/10.1086/722044
Backer H, Duncan D, Christensen K et al (2023) Medical support for california wildfire response. Disaster Med and Public Health Prep 17:e77. https://doi.org/10.1017/dmp.2021.347
Balch JK, Bradley BA, D’Antonio CM, Gómez-Dans J (2013) Introduced annual grass increases regional fire activity across the arid western USA (1980–2009). Glob Chang Biol 19:173–183. https://doi.org/10.1111/gcb.12046
Balch JK, Bradley BA, Abatzoglou JT et al (2017) Human-started wildfires expand the fire niche across the United States. Proc of the Natl Acad of Sci 114:2946–2951. https://doi.org/10.1073/pnas.1617394114
Blaikie P, Cannon T, Davis I, Wisner B (2014) At risk: natural hazards, people’s vulnerability and disasters, 2nd edn. Routledge, London
Book Google Scholar
Bowman DMJS, Balch J, Artaxo P et al (2011) The human dimension of fire regimes on Earth. J Biogeogr 38:2223–2236. https://doi.org/10.1111/j.1365-2699.2011.02595.x
Brenkert-Smith H (2010) Building bridges to fight fire: the role of informal social interactions in six Colorado wildland–urban interface communities. Int J Wildland Fire 19:689–697. https://doi.org/10.1071/WF09063
Bright AD, Burtz RT (2006) Creating defensible space in the wildland-urban interface: the influence of values on perceptions and behavior. Environ Manag 37:170–185. https://doi.org/10.1007/s00267-004-0342-0
Caggiano MD, Hawbaker TJ, Gannon BM, Hoffman CM (2020) Building loss in WUI disasters: evaluating the core components of the wildland-urban interface definition. Fire 3:73. https://doi.org/10.3390/fire3040073
Champ PA, Brenkert-Smith H, Riley JP et al (2022) Actionable social science can guide community level wildfire solutions. An illustration from North Central Washington, US. Int J Disaster Risk Reduct 82:103388. https://doi.org/10.1016/j.ijdrr.2022.103388
Chase J, Hansen P (2021) Displacement after the camp fire: where are the most vulnerable? Soc Nat Resour 34:1566–1583. https://doi.org/10.1080/08941920.2021.1977879
Collins TW (2005) Households, forests, and fire hazard vulnerability in the American West: a case study of a California community. Glob Environ Change Part B Environ Hazards 6:23–37. https://doi.org/10.1016/j.hazards.2004.12.003
Collins D, Kearns R (2008) Uninterrupted views: real-estate advertising and changing perspectives on coastal property in New Zealand. Environ Plan A 40:2914–2932. https://doi.org/10.1068/a4085
Cutter SL (1996) Vulnerability to environmental hazards. Prog Hum Geogr 20:529–539. https://doi.org/10.1177/030913259602000407
Cutter SL, Boruff BJ, Shirley WL (2003) Social vulnerability to environmental hazards. Soc Sci Q 84:242–261. https://doi.org/10.1111/1540-6237.8402002
Cutter SL, Ash KD, Emrich CT (2016) Urban-rural differences in disaster resilience. Ann Am as Geogr 106:1236–1252. https://doi.org/10.1080/24694452.2016.1194740
Davies IP, Haugo RD, Robertson JC, Levin PS (2018) The unequal vulnerability of communities of color to wildfire. PLoS ONE 13:e0205825. https://doi.org/10.1371/journal.pone.0205825
Dillon, GK, Gilbertson-Day, JW (2020) Wildfire hazard potential for the United States (270-m). 3rd Edition. Forest service research data archive. Accessed 7 Mar 2023 from https://doi.org/10.2737/RDS-2015-0047-3
Duprey T, Jones C, Symmers C, Vallée G (2021) Household financial vulnerabilities and physical climate risks. Bank of Canada. Accessed 7 Mar 2023 from https://www.bankofcanada.ca/2021/08/staff-analytical-note-2021-19/
Dyer JF, Bailey C (2008) A place to call home: cultural understandings of heir property among rural African Americans. Rural Soc 73:317–338. https://doi.org/10.1526/003601108785766598
Edgeley CM, Paveglio TB (2017) Community recovery and assistance following large wildfires: the case of the Carlton Complex Fire. Int J Disaster Risk Reduct 25:137–146. https://doi.org/10.1016/j.ijdrr.2017.09.009
Emrich CT (2005) Social vulnerability in US metropolitan areas: improvements in hazard vulnerability assessment. Ph.D dissertation. University of South Carolina
Google Scholar
Emrich CT, Cutter SL (2011) Social vulnerability to climate-sensitive hazards in the southern United States. Weather Clim Soc 3:193–208. https://doi.org/10.1175/2011WCAS1092.1
Emrich CT, Aksha SK, Zhou Y (2022) Assessing distributive inequities in FEMA’s disaster recovery assistance fund allocation. Int J Disaster Risk Reduct 74:102855. https://doi.org/10.1016/j.ijdrr.2022.102855
Enarson E, Morrow B (1998) The gendered terrain of disaster: through women’s eyes. Praeger, Connecticut
Eriksen C, Simon G (2017) The affluence-vulnerability interface: intersecting scales of risk, privilege and disaster. Environ Plan A 49:293–313. https://doi.org/10.1177/0308518X16669511
ESRI (2018) USA urban areas - overview. Accessed 7 Mar 2023 from https://www.arcgis.com/home/item.html?id=432bb9246fdd467c88136e6ffeac2762
FEMA (2019) Building cultures of preparedness: report for the emergency management higher education community. US Federal Emergency Management Agency, Washington, DC
Fischer AP, Spies TA, Steelman TA et al (2016) Wildfire risk as a socioecological pathology. Front Ecol Environ 14:276–284. https://doi.org/10.1002/fee.1283
Fu R, Abrahamson K, Campbell T (2022) Occupational mobility and chronic health conditions in middle and later life: a systematic review. Int J Behav Med. https://doi.org/10.1007/s12529-022-10135-0
Gabbe CJ, Pierce G, Oxlaj E (2020) Subsidized households and wildfire hazards in California. Environ Manag 66:873–883. https://doi.org/10.1007/s00267-020-01340-2
Gaither CJ, Poudyal NC, Goodrick S et al (2011) Wildland fire risk and social vulnerability in the Southeastern United States: an exploratory spatial data analysis approach. For Policy Econ 13:24–36. https://doi.org/10.1016/j.forpol.2010.07.009
Gares CE, Montz BE (2014) Disaster vulnerability of migrant and seasonal farmworkers: a comparison of Texas and North Carolina. Southeast Geogr 54:36–54
U.S. Geological Survey (2019) Monitoring trends in burn severity. U.S. Geological Survey. Accessed 7 Mar 2023 from https://www.usgs.gov/centers/eros/science/monitoring-trends-burn-severity
Grala K, Grala RK, Hussain A et al (2017) Impact of human factors on wildfire occurrence in Mississippi, United States. For Policy Econ 81:38–47. https://doi.org/10.1016/j.forpol.2017.04.011
Grant E, Runkle JD (2022) Long-term health effects of wildfire exposure: a scoping review. J Clim Change Health 6:100110. https://doi.org/10.1016/j.joclim.2021.100110
Hazards and Vulnerability Research Institute (2015) SoVI ® Evolution. Accessed 14 March 2023 from https://www.sc.edu/study/colleges_schools/artsandsciences/centers_and_institutes/hvri/data_and_resources/sovi/evolution/index.php
Highfield WE, Peacock WG, Van Zandt S (2014) Mitigation planning: why hazard exposure, structural vulnerability, and social vulnerability matter. J Plan Educ Res 34:287–300. https://doi.org/10.1177/0739456X14531828
Iezzoni LI, McCarthy EP, Davis RB, Siebens H (2001) Mobility difficulties are not only a problem of old age. J Gen Intern Med 16:235–243. https://doi.org/10.1046/j.1525-1497.2001.016004235.x
James X, Hawkins A, Rowel R (2007) An assessment of the cultural appropriateness of emergency preparedness communication for low income minorities. J Homel Secur Emerg Manag 4(3):13. https://doi.org/10.2202/1547-7355.1266
Johnston LM, Wang X, Erni S et al (2020) Wildland fire risk research in Canada. Environ Rev 28:164–186. https://doi.org/10.1139/er-2019-0046
Keeley JE, Syphard AD (2016) Climate change and future fire regimes: examples from California. Geosci 6:37. https://doi.org/10.3390/geosciences6030037
Keeley JE, Syphard AD (2018) Historical patterns of wildfire ignition sources in California ecosystems. Int J Wildland Fire 27:781799
Kramer HA, Mockrin MH, Alexandre PM et al (2018) Where wildfires destroy buildings in the US relative to the wildland–urban interface and national fire outreach programs. Int J Wildland Fire 27:329–341. https://doi.org/10.1071/WF17135
Lambrou N, Kolden C, Loukaitou-Sideris A et al (2023) Social drivers of vulnerability to wildfire disasters: a review of the literature. Landsc and Urban Plan 237:104797. https://doi.org/10.1016/j.landurbplan.2023.104797
Lee JY, Van Zandt S (2019) Housing tenure and social vulnerability to disasters: a review of the evidence. J Plan Lit 34:156–170. https://doi.org/10.1177/0885412218812080
Lee JY, Ma F, Li Y (2022) Understanding homeowner proactive actions for managing wildfire risks. Nat Hazards 114:1525–1547. https://doi.org/10.1007/s11069-022-05436-2
Lee, JY, Li, Y (2021) A first step towards longitudinal study on homeowners’ proactive actions for managing wildfire risks. Accessed 7 Mar 2023 from https://hazards.colorado.edu/quick-response-report/a-first-step-towards-longitudinal-study-on-homeowners-proactive-actions-for-managing-wildfire-risks
Littell JS, Peterson DL, Riley KL et al (2016) A review of the relationships between drought and forest fire in the United States. Glob Change Biol 22:2353–2369. https://doi.org/10.1111/gcb.13275
Liu JC, Pereira G, Uhl SA et al (2015) A systematic review of the physical health impacts from non-occupational exposure to wildfire smoke. Environ Res 136:120–132. https://doi.org/10.1016/j.envres.2014.10.015
Long JW, Lake FK (2018) Escaping social-ecological traps through tribal stewardship on national forest lands in the Pacific Northwest, United States of America. Ecol Soc 23(2):10. https://doi.org/10.5751/ES-10041-230210
Masri S, Scaduto E, Jin Y, Wu J (2021) Disproportionate impacts of wildfires among elderly and low-income communities in California from 2000–2020. Int J Environ Res Public Health 18:3921. https://doi.org/10.3390/ijerph18083921
McWethy DB, Schoennagel T, Higuera PE et al (2019) Rethinking resilience to wildfire. Nat Sustain 2:797–804. https://doi.org/10.1038/s41893-019-0353-8
Méndez M, Flores-Haro G, Zucker L (2020) The (in)visible victims of disaster: understanding the vulnerability of undocumented Latino/a and indigenous immigrants. Geoforum 116:50–62. https://doi.org/10.1016/j.geoforum.2020.07.007
Montz BE, Allen TR, Monitz GI (2011) Systemic trends in disaster vulnerability: migrant and seasonal farm workers in North Carolina. Risk Hazards Crisis Public Policy 2:1–17. https://doi.org/10.2202/1944-4079.1070
Moritz MA, Batllori E, Bradstock RA et al (2014) Learning to coexist with wildfire. Nature 515:58–66. https://doi.org/10.1038/nature13946
Nagy RC, Fusco E, Bradley B et al (2018) Human-related ignitions increase the number of large wildfires across U.S. ecoregions. Fire 1:4. https://doi.org/10.3390/fire1010004
National Research Council (2007) Using the American community survey: benefits and challenges. The National Academies Press, Washington. https://doi.org/10.17226/11901
Nummi J, Henderson K (2017) Women’s leadership in Texas forest fires and recovery: how gender roles and assumptions empower and constrain women and men postdisaster in a rural southern town. In: Companion M, Chaikem M (eds) Responses to disasters and climate change: understanding vulnerability and fostering resilience. Taylor & Francis, New York, pp 173–182
Ojerio R, Moseley C, Lynn K, Bania N (2011) Limited involvement of socially vulnerable populations in federal programs to mitigate wildfire risk in Arizona. Nat Hazards Rev 12:28–36. https://doi.org/10.1061/(ASCE)NH.1527-6996.0000027
Oswalt SN, Smith WB, Miles PD, Pugh SA (2019) Forest resources of the United States, 2017: a technical document supporting the Forest Service 2020 RPA Assessment. Gen Tech Rep WO-97 Washington, DC: US Department of Agriculture, Forest Service, Washington Office. https://doi.org/10.2737/WO-GTR-97
Palaiologou P, Ager AA, Nielsen-Pincus M et al (2019) Social vulnerability to large wildfires in the western USA. Landsc Urban Plan 189:99–116. https://doi.org/10.1016/j.landurbplan.2019.04.006
Parkinson D (2019) Investigating the increase in domestic violence post disaster: an Australian case study. J Interpers Violence 34:2333–2362. https://doi.org/10.1177/0886260517696876
Paveglio TB, Carroll MS, Stasiewicz AM, Edgeley CM (2019) Social fragmentation and wildfire management: exploring the scale of adaptive action. Int J Disaster Risk Reduct 33:131–141. https://doi.org/10.1016/j.ijdrr.2018.09.016
Poudyal N, Gaither CJ, Goodrick S et al (2012) Locating spatial variation in the association between wildland fire risk and social vulnerability across six southern states. Environ Manag 49(3):623–635. https://doi.org/10.1007/s00267-011-9796-z
Pulido L (2000) Rethinking environmental racism: white privilege and urban development in Southern California. Ann Am as Geogr 90:12–40. https://doi.org/10.1111/0004-5608.00182
Radeloff VC, Hammer RB, Stewart SI et al (2005) The wildland-urban interface in the United States. Ecol Appl 15:799–805. https://doi.org/10.1890/04-1413
Radeloff VC, Helmers DP, Kramer HA et al (2018) Rapid growth of the US wildland-urban interface raises wildfire risk. Proc Natl Acad Sci 115:3314–3319. https://doi.org/10.1073/pnas.1718850115
Radeloff VC, Helmers DP (2018) Wildland-urban interface (WUI) change 1990–2010. In: SILVIS LAB. Accessed 9 Nov 2022 from http://silvis.forest.wisc.edu/data/wui-change/
Radeloff VC, Mockrin MH, Helmers DP, Carlson AR, Hawbaker TJ, Martinuzzi S, Schug F, Alexandre PM, Kramer HA, Pidgeon AM (2023) Rising wildfire risk to houses in the United States, especially in western grasslands and shrublands. Science 382:702–707. https://doi.org/10.1126/science.ade9223
Rappold AG, Reyes J, Pouliot G et al (2017) Community vulnerability to health impacts of wildland fire smoke exposure. Environ Sci Technol 51:6674–6682. https://doi.org/10.1021/acs.est.6b06200
Rizza A, Kaplan V, Senn O et al (2012) Age- and gender-related prevalence of multimorbidity in primary care: the swiss fire project. BMC Fam Pract 13:113. https://doi.org/10.1186/1471-2296-13-113
Rufat S, Tate E, Burton CG, Maroof AS (2015) Social vulnerability to floods: review of case studies and implications for measurement. Int J Disaster Risk Reduct 14:470–486. https://doi.org/10.1016/j.ijdrr.2015.09.013
Rufat S, Tate E, Emrich CT, Antolini F (2019) How valid are social vulnerability models? Ann Am as Geogr 109:1131–1153. https://doi.org/10.1080/24694452.2018.1535887
Rumbach A, Sullivan E, Makarewicz C (2020) Mobile home parks and disasters: understanding risk to the third housing type in the United States. Nat Hazards Rev 21:05020001. https://doi.org/10.1061/(ASCE)NH.1527-6996.0000357
Saito Y (2014) Progress or repetition? Gender perspectives in disaster management in Japan. Disaster Prev Manag 23:98–111. https://doi.org/10.1108/DPM-08-2013-0134
Schumann RL, Mockrin M, Syphard AD et al (2020) Wildfire recovery as a “hot moment” for creating fire-adapted communities. Int J Disaster Risk Reduct 42:101354. https://doi.org/10.1016/j.ijdrr.2019.101354
Simon GL, Dooling S (2013) Flame and fortune in California: the material and political dimensions of vulnerability. Glob Environ Change 23:1410–1423. https://doi.org/10.1016/j.gloenvcha.2013.08.008
Spielman SE, Folch D, Nagle N (2014) Patterns and causes of uncertainty in the American Community Survey. Appl Geogr 46:147–157. https://doi.org/10.1016/j.apgeog.2013.11.002
Spies T, White E, Kline J et al (2014) Examining fire-prone forest landscapes as coupled human and natural systems. Ecol and Soc 19(3):9. https://doi.org/10.5751/ES-06584-190309
State of California (2019) California is not adequately prepared to protect its most vulnerable residents from natural disasters. California State Auditor. Accessed 7 Mar 2023 from https://www.auditor.ca.gov/pdfs/reports/2019-103.pdf .
Steelman T (2016) U.S. wildfire governance as social-ecological problem. Ecol Soc. https://doi.org/10.5751/ES-08681-2104030
Syphard AD, Keeley JE, Pfaff AH, Ferschweiler K (2017) Human presence diminishes the importance of climate in driving fire activity across the United States. Proc Natl Acad Sci 114:13750–13755. https://doi.org/10.1073/pnas.1713885114
Syphard AD, Rustigian-Romsos H, Mann M et al (2019) The relative influence of climate and housing development on current and projected future fire patterns and structure loss across three California landscapes. Glob Environ Change 56:41–55. https://doi.org/10.1016/j.gloenvcha.2019.03.007
Thomas AS, Escobedo FJ, Sloggy MR, Sánchez JJ (2022) A burning issue: Reviewing the socio-demographic and environmental justice aspects of the wildfire literature. PLoS ONE 17:e0271019. https://doi.org/10.1371/journal.pone.0271019
Toledo T, Marom I, Grimberg E, Bekhor S (2018) Analysis of evacuation behavior in a wildfire event. Int J Disaster Risk Reduct 31:1366–1373. https://doi.org/10.1016/j.ijdrr.2018.03.033
U.S. Department of Agriculture (2022) Secretary's memorandum 1077–004 June 23, 2022 climate resilience and carbon stewardship of America’s National Forests and Grasslands. Accessed 21 Sep 2023 from https://www.usda.gov/directives/sm-1077-004 .
U.S. Department of Agriculture (2023) Community wildfire defense program. USDA Forest Service. Accessed 17 Aug 2023 from https://www.fs.usda.gov/managing-land/fire/grants
Wibbenmeyer M, Robertson M (2022) The distributional incidence of wildfire hazard in the western United States. Environ Res Lett 17:064031. https://doi.org/10.1088/1748-9326/ac60d7
Wigtil G, Hammer RB, Kline JD et al (2016) Places where wildfire potential and social vulnerability coincide in the coterminous United States. Int J Wildland Fire 25:896–908. https://doi.org/10.1071/WF15109
Williams AP, Abatzoglou JT, Gershunov A et al (2019) Observed impacts of anthropogenic climate change on wildfire in California. Earth’s Future 7:892–910. https://doi.org/10.1029/2019EF001210
Wu A, Yan X, Kuligowski E et al (2022) Wildfire evacuation decision modeling using GPS data. Int J Disaster Risk Reduct 83:103373. https://doi.org/10.1016/j.ijdrr.2022.103373
Yu C-Y, Woo A, Emrich CT, Wang B (2020) Social vulnerability index and obesity: an empirical study in the US. Cities 97:102531. https://doi.org/10.1016/j.cities.2019.102531
Zybach B, Dubrasich M, Brenner G, Marker J (2009) US wildfire cost-plus-loss economics project: the ‘One-pager’ checklist. In: ‘Advances in Fire Practices’, Fall. (Wildland Fire Lessons Learned Center). Assessed 7 March 2023 from https://www.wildfirelessons.net/HigherLogic/System/DownloadDocumentFile.ashx?DocumentFileKey=9f94b4ed-d5f2-45b8-b198-5677d430e3ae
Download references
Acknowledgements
This work was supported by the National Socio-Environmental Synthesis Center (SESYNC) under funding from the National Science Foundation DBI-1639145. The authors also thank the two anonymous reviewers whose comments improved the quality of the article.
This work was supported by the National Socio-Environmental Synthesis Center (SESYNC) under funding from the National Science Foundation DBI-1639145.
Author information
Authors and affiliations.
Department of Emergency Management and Disaster Science, University of North Texas, 1155 Union Circle #310637, Denton, TX, 76203, USA
Ronald L. Schumann III
School of Public Administration, University of Central Florida, P.O. Box 161395, Orlando, FL, 32816-1395, USA
Christopher T. Emrich & Sanam K. Aksha
Department of Environmental Science, Policy, and Management, University of California Berkeley, 130 Mulford Hall #3114, Berkeley, CA, 94270, USA
Northern Research Station, USDA Forest Service, 5523 Research Park Dr Suite 350, Baltimore, MD, 21228, USA
Miranda H. Mockrin
Department of Applied Aviation Sciences, College of Aviation, Embry-Riddle Aeronautical University, Daytona Beach, FL, 32114, USA
Southern Research Station, USDA Forest Service, 320 Green St., Athens, GA, 30602, USA
Cassandra Johnson Gaither
Centre for Environmental Risk Management of Bushfires, University of Wollongong, Northfields Avenue, Wollongong, NSW, 2522, Australia
Owen Price & Joshua Whittaker
Conservation Biology Institute, Corvallis, OR, 97333, USA
Alexandra D. Syphard
You can also search for this author in PubMed Google Scholar
Corresponding author
Correspondence to Ronald L. Schumann III .
Ethics declarations
Conflict of interest.
The authors have no relevant financial or non-financial interests to disclose.
Additional information
Publisher's note.
Springer Nature remains neutral with regard to jurisdictional claims in published maps and institutional affiliations.
Supplementary Information
Below is the link to the electronic supplementary material.
Supplementary file1 (XLSX 14 KB)
Rights and permissions.
Springer Nature or its licensor (e.g. a society or other partner) holds exclusive rights to this article under a publishing agreement with the author(s) or other rightsholder(s); author self-archiving of the accepted manuscript version of this article is solely governed by the terms of such publishing agreement and applicable law.
Reprints and permissions
About this article
Schumann, R.L., Emrich, C.T., Butsic, V. et al. The geography of social vulnerability and wildfire occurrence (1984–2018) in the conterminous USA. Nat Hazards 120 , 4297–4327 (2024). https://doi.org/10.1007/s11069-023-06367-2
Download citation
Received : 29 March 2023
Accepted : 02 December 2023
Published : 08 January 2024
Issue Date : March 2024
DOI : https://doi.org/10.1007/s11069-023-06367-2
Share this article
Anyone you share the following link with will be able to read this content:
Sorry, a shareable link is not currently available for this article.
Provided by the Springer Nature SharedIt content-sharing initiative
- Social vulnerability indicators
- Wildland–urban interface
- Census data
- Rural geographies
- Environmental justice
- Find a journal
- Publish with us
- Track your research

An official website of the United States government
The .gov means it’s official. Federal government websites often end in .gov or .mil. Before sharing sensitive information, make sure you’re on a federal government site.
The site is secure. The https:// ensures that you are connecting to the official website and that any information you provide is encrypted and transmitted securely.
- Publications
- Account settings
Preview improvements coming to the PMC website in October 2024. Learn More or Try it out now .
- Advanced Search
- Journal List
- Scientific Reports
The 2019–2020 Australian forest fires are a harbinger of decreased prescribed burning effectiveness under rising extreme conditions
Hamish clarke.
1 Centre for Environmental Risk Management of Bushfires, Centre for Sustainable Ecosystem Solutions, University of Wollongong, Wollongong, NSW 2522 Australia
2 NSW Bushfire Risk Management Research Hub, University of Wollongong, Wollongong, NSW 2522 Australia
3 Hawkesbury Institute for the Environment, Western Sydney University, Locked Bag 1797, Penrith, NSW 2751 Australia
4 FLARE Wildfire Research, School of Ecosystem and Forest Sciences, The University of Melbourne, Melbourne, Victoria 3363 Australia
Brett Cirulis
Trent penman, matthias m. boer, ross bradstock.
5 NSW Department of Planning and Environment, Science, Economics and Insights Division, Parramatta, NSW Australia
Associated Data
The datasets generated from fire simulation and risk estimation for the current study are available from the corresponding author on reasonable request. Weather data is available from the Australian Bureau of Meteorology ( http://www.bom.gov.au ). Vegetation mapping and fuel accumulation models are available from the NSW Rural Fire Service ( https://www.rfs.nsw.gov.au ). Fire-sensitive vegetation, road and powerline location data is available from the NSW Department of Planning and Environment ( https://www.environment.nsw.gov.au ).
Code to prepare the plots is available on request.
There is an imperative for fire agencies to quantify the potential for prescribed burning to mitigate risk to life, property and environmental values while facing changing climates. The 2019–2020 Black Summer fires in eastern Australia raised questions about the effectiveness of prescribed burning in mitigating risk under unprecedented fire conditions. We performed a simulation experiment to test the effects of different rates of prescribed burning treatment on risks posed by wildfire to life, property and infrastructure. In four forested case study landscapes, we found that the risks posed by wildfire were substantially higher under the fire weather conditions of the 2019–2020 season, compared to the full range of long-term historic weather conditions. For area burnt and house loss, the 2019–2020 conditions resulted in more than a doubling of residual risk across the four landscapes, regardless of treatment rate (mean increase of 230%, range 164–360%). Fire managers must prepare for a higher level of residual risk as climate change increases the likelihood of similar or even more dangerous fire seasons.
Introduction
Intrinsic to the earth system for hundreds of millions of years, wildfires are increasingly interacting with humans and the things we value 1 – 3 . Mega-fires in recent years have caused loss of life and property and widespread environmental and economic impacts in many countries, challenging society’s ability to respond effectively 4 – 6 . Climate change has already caused changes in some fire regimes, with greater changes projected throughout this century 7 – 9 . There is a broad network of anthropogenic influences on fire likelihood, exposure and vulnerability including land-use planning, building construction and design, insurance, household and community actions, Indigenous cultural land management, ecosystem management, and research and development. Within this network, fire management agencies play a critical role in wildfire risk mitigation, although our understanding of the interactions between, and relative contributions of, these varied factors towards risk mitigation remains limited. Addressing these gaps is required to support the development and implementation of cost-effective risk management strategies 10 .
Prescribed burning is commonly used in contemporary fire management to alter fuels, with the intention of mitigating risks posed by wildfires to assets. This involves the controlled application of fire in order to modify fuel properties and increase the likelihood of suppressing any wildfires that subsequently occur in the area of the burn 11 – 13 . Although the effects and effectiveness of prescribed burning have come under intense scientific scrutiny 14 , major knowledge gaps remain in the design of locally tailored, cost-effective treatment strategies that aim to optimise risk mitigation across a range of management values 15 . Crucially, these values may sometimes be in conflict e.g. smoke health impacts from prescribed fire and wildfire 16 or biodiversity conservation and asset protection 17 , necessitating methods for making trade-offs explicit 18 .
The 2019–2020 fires in south-eastern Australia resulted in 33 direct deaths, over 400 smoke-related premature deaths, the loss of over 3000 houses and new records for high severity fire extent and the proportion of area burnt for any forest biome globally 4 , 19 – 21 . These fires were an important opportunity to test the risk mitigation effects of prescribed burning. One empirical study found that about half the prescribed fires examined resulted in a significant decrease in fire severity, with effects greater for more recent burns and weaker for older burns 22 . Two other empirical studies 6 , 23 found decreases in the probability of high severity fire and house loss after past fire (either prescribed fire or wildfire), but also that this effect was significantly weakened under extreme fire weather conditions, consistent with prior research 24 , 25 . Large ensemble fire behaviour modelling can complement these empirical studies by exploring far more variation in weather conditions, treatment strategies and ignition location than would be possible from the historical record 26 – 28 . Simulation modelling facilitates estimates of residual risk: the percentage of maximum bushfire risk remaining, in a given area, following a particular fire management scenario, with maximum typically based on a control scenario with no prescribed burning treatment 29 . Simulation modelling also enables tracking of the trajectory of risk in the aftermath of seasons such as the 2019–2020 one, where very large burned areas might be expected to have reduced landscape fuel loads and hence residual risk.
Here we perform a simulation experiment on the effects of different rates of prescribed burning treatment on area burnt and the risks posed by wildfire to multiple values. We consider life, property and infrastructure across four case study landscapes (Fig. (Fig.1). 1 ). In particular, we asked:
- How much risk mitigation does prescribed burning provide in the weather conditions of 2019-20 compared to average fire season weather distributions, based on long-term records?
- How much subsequent risk reduction did the Black Summer fires provide?
- Over what time period will risk reduction be measurable?

Fire behaviour simulations were carried out for four case study landscapes in south-eastern Australia: Casino, Gloucester, Blue Mountains and Jervis Bay. See Table Table1 1 and Study Area in the Methods section for more information. This figure was generated using ArcGIS version 10.8 ( https://www.esri.com/en-us/home ).
The effect of 2019-20 fire weather conditions on risk mitigation from prescribed burning
Fire weather conditions during the 2019–2020 season were markedly different to preceding years (Fig. (Fig.2). 2 ). In all four case study landscapes there were fewer Low-Moderate days (Forest Fire Danger Index (FFDI): 0–12) and often considerably more High, Very High and Severe days (FFDI: 12–74). Only in the Jervis Bay landscape were there substantially more Extreme days (FFDI: 75–99) during the 2019–2020 season, while there were no Catastrophic days (FFDI ≥ 100) in any of the landscapes during 2019–2020.

Relative frequency of FFDI categories from half-hourly weather station data during the long-term record (1995–2014 for Casino, 1991–2014 for Gloucester and Blue Mountains, 2000–2014 for Jervis Bay) and during the 2019–2020 season.
The 2019–2020 weather conditions strongly increased the residual risk of area burnt by wildfire and house loss due to wildfire (Figs. (Figs.3, 3 , ,4). 4 ). For any given treatment rate, the residual risk under 2019–2020 weather conditions far exceeded control conditions (i.e. conditions based on long-term historic weather). For area burnt there was a mean 220% increase in residual risk (range 170–351%), while for house loss the mean increase in residual risk was 244% (range 164–360%). Only under very high rates of treatment was prescribed burning under 2019–2020 conditions able to achieve a residual risk below that of zero treatment in the control scenario, and only for house loss in the Blue Mountains (Fig. (Fig.4). 4 ). Elsewhere even the highest rates of treatment (well above rates achieved historically) resulted in a residual risk above that of zero treatment in the control scenario.

Residual risk trajectory of area burnt by wildfire in Casino, Gloucester, Blue Mountains and Jervis Bay. Risk is relative to a scenario with no prescribed burning and long-term weather (the 100% level on the y-axis). Markers represent different annual rates of treatment, colours represent different weather conditions (blue = control i.e. long-term, orange = 2019–2020 fire season).

Residual risk trajectory of houses lost due to wildfire in Casino, Gloucester, Blue Mountains and Jervis Bay. Risk is relative to a scenario with no prescribed burning and long-term weather (the 100% level on the y-axis). Markers represent different annual rates of treatment, colours represent different weather conditions (blue = control i.e. long-term, orange = 2019–2020 fire season).
Prescribed burning resulted in a reduction in residual risk in all landscapes regardless of weather conditions, even though in almost all cases the risk remained higher than for zero treatment in the control scenario (see gradient of markers in Figs. Figs.3, 3 , ,4). 4 ). The effect of increasing treatment was much stronger in the Blue Mountains, with a minimum residual risk of area burnt by wildfire under long-term weather conditions of 35%, and a minimum residual risk of house loss of 22%. In the other three landscapes the minimum residual risk was 89% for area burnt and 77% for house loss. The marginal effect of prescribed burning (i.e. the rate of change in risk mitigation with incremental changes in treatment rate) was greater under the extreme 2019–2020 weather conditions, even though the residual risk was much higher as described above. Results for life loss and infrastructure damage were similar (Supplementary Figures 1 –3).
Risk in the aftermath of 2019–2020 fire season
The estimated fuel load reductions due to the 2019–2020 fire season were predicted to cause widespread short-term reductions in residual risk to area burnt by wildfire and house loss, regardless of treatment level (Figs. (Figs.5, 5 , ,6). 6 ). The potential area burnt by wildfire in 2021 was predicted to be at 30–80% of control (i.e. pre-2019–2020 levels) depending on landscape (Fig. (Fig.5, 5 , circles). The predicted reduction in area burnt was greatest in Jervis Bay and Gloucester, which experienced the greatest and second greatest proportion burnt during the 2019–2020 season respectively (Table (Table1). 1 ). By 2025, the residual risk of area burnt by wildfire climbed to 50–90% of control levels across the four study areas (Fig. (Fig.6). 6 ). Results are similar for house loss (Fig. (Fig.6) 6 ) i.e. the reductions in future wildfire risk due to the 2019–2020 season are partial and temporary, with residual risk actually exceeding control levels in the Blue Mountains by 2025. The re-accumulation of fuel over time is predicted to lead to greater risk mitigation from prescribed burning by 2025 than by 2021 (compare the gradients of the crosses and the circles in Figs. Figs.5, 5 , ,6). 6 ). As with the previous analysis, results for life loss and infrastructure damage were similar (Supplementary Figures 4 -6).

Future residual risk trajectory of area burnt by wildfire in the Casino, Gloucester, Blue Mountains and Jervis Bay case study areas. Risk is relative to a control scenario with pre-2019–2020 fuel load and no prescribed burning (the 100% level on the y-axis, indicated by line). Markers represent different annual treatment rates, colour indicates time period (blue = 2021 i.e. two years after 2019–2020 fire season, orange = 2025 i.e. six years after 2019–2020 fire season). In Jervis Bay the markers for 2, 3 and 5% p.a. treatment reflect edge treatment rates, with landscape treatment capped at 1% p.a. due to the very large area burnt during the 2019–2020 season (81% of the study area).

Future residual risk trajectory of houses lost due to wildfire in the Casino, Gloucester, Blue Mountains and Jervis Bay case study areas. Risk is relative to a control scenario with pre-2019–2020 fuel load and no prescribed burning (the 100% level on the y-axis, indicated by line). Markers represent different annual treatment rates, colour indicates time period (blue = 2021 i.e. two years after 2019–2020 fire season, orange = 2025 i.e. six years after 2019–2020 fire season). In Jervis Bay the markers for 2, 3 and 5% p.a. treatment reflect edge treatment rates, with landscape treatment capped at 1% p.a. due to the very large area burnt during the 2019–2020 season (81% of the study area).
Selected case study properties.
For mean annual maximum and minimum temperature, area average and range are shown.
Weather conditions during the 2019–2020 Australian fire season were a substantial risk multiplier compared to long-term weather conditions. The relative risks due to wildfire, quantified in terms of area burnt or house loss, doubled in three of four forested landscapes and more than tripled in the other. While prescribed burning partially mitigated these risks, the effect size was typically dwarfed by the effect of extreme weather conditions. In most cases zero treatment under long-term historic weather conditions yielded a lower residual risk than even the highest prescribed burning rates when combined with the 2019–2020 fire weather conditions. We also found that wildfire risk was likely to be reduced in the aftermath of the 2019–2020 fires, based on the implied fuel reduction associated with the unprecedented area burnt during the 2019–2020 season. However, the residual risk was still substantial in some areas and was predicted to rise steadily in the coming years, regardless of prescribed burning treatment rates.
Prescribed burning can mitigate a range of risks posed by wildfire, however residual risk can be substantial and is likely to increase strongly during severe fire weather conditions 6 , 24 . We found that the risk mitigation available from prescribed burning varies considerably depending on where it is carried out and which management values are being targeted, consistent with previous modelling studies that suggest there is no ‘one size fits all’ solution to prescribed burning treatment 15 , 16 . Of the factors influencing regional variation in prescribed burning effectiveness, the configuration of assets and the type, amount and condition of native vegetation are likely to be important. The Blue Mountains landscape, where area burnt by wildfire responded most strongly to treatment, has a relatively high proportion of native vegetation compared to the other landscapes, particularly Casino and Gloucester which are mostly cleared. The Blue Mountains also has an unusual combination of a high population concentrated in a linear strip of settlements surrounded by forest, which may contribute to greater returns on treatment (Fig. (Fig.1). 1 ). Future research could systematically investigate the relationship between risk mitigation and properties of key variables such as asset distribution, vegetation and burn blocks for an expanded selection of landscapes. Although residual risk was greatly reduced in some areas after the 2019–2020 fire season, it remained substantial in other areas and was generally predicted to rise rapidly with fuel re-accumulation over the following five years. More work is needed to understand potential feedbacks between increasing fire activity, fuel accumulation and subsequent fire activity 8 .
Our conclusions are dependent on a number of assumptions associated with our fire behaviour simulation approach, including the foundational premise that fire spread is a function of fire weather, fuel load and factors such as topography. Fire behaviour simulators built on these assumptions have known biases and perform better when these are addressed, although their tendency to underestimate extreme fire behaviour suggests our results may be conservative 30 – 32 . The approach also assumes that both wildfires and prescribed burns consume equivalent quantities of fuel and that this fuel starts to re-accumulate after fire as a negative exponential function of time since fire, eventually stabilising at an equilibrium amount. In fact fuel consumption rates vary considerably within a given fire but also between wildfires and prescribed fires, which consume less fuel 33 , 34 . This also points towards our results being conservative due to potentially overestimating the mitigation effect of prescribed burning. Furthermore the accumulation of fuel post fire depends on the vegetation type, soil and climate 35 . Our experiments on the trajectory of risk after the 2019–2020 fire season may be limited by the relatively short amount of time allowed to elapse, which may be insufficient for prescribed burning treatment effects to become apparent. More broadly, our study design involves repeated instances of a single wildfire and thus does not capture the fire regime i.e. the effects of multiple fires in space and time, nor does it factor in future changes in climate, fuel or fuel moisture 36 . We did not model suppression, which is a complex function of fuel type, fuel load, fire behaviour, weather, topography and fire management decision making 37 . Suppression can reduce a range of risks although it is less effective under extreme weather conditions 38 – 40 .
Fire-prone landscapes around the world have experienced increasingly severe fire weather conditions 20 , 41 . The extreme conditions of the 2019–2020 fire season are projected to occur more frequently in the 21st century 42 . Our results suggest that climate change could seriously undermine the role played by prescribed burning in wildfire risk mitigation, as found in previous studies 43 , 44 . Using landscape simulation modelling in the Blue Mountains and the Woronora Plateau (about 100 km north of our Jervis Bay landscape), Bradstock et al. 43 found that the rate of prescribed burning treatment would need to quintuple or more by 2050 to counteract the effects of climate change on risk mitigation in terms of measures such as area burned and intensity of unplanned fire. Our study assumes that similar or greater treatment rates will be possible in future, which may not be the case depending on the prevalence of suitable prescribed burning weather conditions 45 , 46 . These findings demonstrate that there can be no wildfire risk mitigation without effective climate change mitigation 47 . Our research reinforces the need for comprehensive, transparent and objective evaluation of the effectiveness of existing attempts to mitigate wildfire risk across a range of management objectives, with future work potentially targeting additional management values such as smoke production and associated health impacts, agriculture and tourism impacts, and more nuanced measures of environmental impact. Such an evaluation could inform the trial and implementation of a range of locally tailored risk mitigation measures that address the full complexity of fire across preparation, response and recovery phases, such as prescribed burning, mechanical fuel reduction, anthropogenic ignition management, suppression, planning, construction and community engagement.
We selected four case study landscapes that were extensively impacted during the 2019–2020 fire season: Casino (69,362 ha burnt), Gloucester (132, 281 ha), Blue Mountains (119,626 ha) and Jervis Bay (137,049 ha) (Fig. (Fig.1; 1 ; Table Table1). 1 ). All landscapes are forested, have considerable Wildland Urban Interface (WUI), and have a history of both wildfire and prescribed fire. Case study landscapes were approximately 200,000 ha (Table (Table1), 1 ), intended to align with the upper limit of the size distribution of wildfires in local ecosystems (During the 2019–2020 fire season the Gospers Mountain fire, the result of mergers between several large fires in the Blue Mountains World Heritage Area and neighbouring areas, had a final burned area of over 500,000 ha).
The dominant land cover in the Casino landscape is cleared or modified vegetation (58%). The main native vegetation is dry sclerophyll forest with a shrub/grass understorey (17% of the study area) followed by wet sclerophyll forest with a grassy understorey (9%). The Casino area has a population of about 12,000, mostly concentrated in the town of Casino with a small number dispersed on semi-rural properties. Cleared or modified vegetation is also the dominant land cover in the Gloucester landscape (60%). The main native vegetation is wet sclerophyll forest with a grassy understorey (23% of the study area) followed by wet sclerophyll forest with a shrubby understorey (8%). The population is about 30,000, most of which live in the town of Taree on the eastern edge of the landscape with the remainder in smaller towns and semi-rural properties. The main native vegetation in the Blue Mountains landscape is dry sclerophyll forest with a shrubby understorey (63% of the study area) followed by dry sclerophyll forest with a shrub/grass understorey (9%). About 11% of the landscape is cleared or modified vegetation. Around 100,000 people live within the area, mainly living in a string of suburbs along a highway which bisects the region. The main native vegetation in the Jervis Bay landscape is dry sclerophyll forest with a shrubby understorey (40% of the study area) followed by wet sclerophyll forest with a grassy understorey (17%). Around 14% of the landscape is cleared or modified vegetation. About 50,000 people live within the area, mostly in the township of Nowra in the northeast with most of the remainder in coastal suburbs in the southeast.
All four landscapes are examples of the temperature eucalypt forest fire regime niche, characterised by high-productivity, with infrequent low-intensity litter fires in spring and medium-intensity shrub fires in spring and summer 48 . Fire intensity typically ranges from 1000 to 5000 kW m −1 , although extreme weather conditions may support crown fires where fire intensity can reach 10,000–50,000 kW m −1 . Fire interval is around 5–20 years, although can be as long as 20–100 years 48 . Contemporary prescribed burning rates average 2.5% p.a. in the Blue Mountains landscape and range from 0.4 to 0.6% p.a.in the Casino, Gloucester and Jervis Bay landscapes.
Phoenix fire simulator
Fires were simulated using PHOENIX RapidFire v4.0.0.7 49 , which is commonly applied in operations across south-eastern Australian states, including NSW 17 . Fire growth and rate of spread are calculated from Huygens’ propagation principle of fire edge 50 , a modified McArthur Mk5 forest fire behaviour model 51 , 52 and a generalisation of the CSIRO southern grassland fire spread model 53 . A 30-m resolution digital elevation model was included to allow PHOENIX to incorporate topographic effects on fire behaviour. Vegetation mapping and fuel accumulation models for major vegetation types of the case study landscapes were supplied by the NSW Rural Fire Service. Simulations were run at 180m grid resolution and model output included flame length, ember density, convection and intensity.
Scenario parameterisation
PHOENIX estimates fuel loads using separate fuel accumulation curves for combined surface and/near-surface, elevated and bark fuels 54 . These curves are based on a negative exponential growth function and varied among vegetation types 55 . The treatable portion of each case study landscape was defined as all fuels except crop, farm and urban landcover, and comprised 38% of the Casino landscape, 52% of the Gloucester landscape, 70% of the Blue Mountains landscape and 83% of the Jervis Bay landscape. Treatable fuels were separated into two types of management-sized ‘burn blocks’. Edge blocks were adjacent to property and settlements, while landscape blocks were more remote and larger. For edge blocks, a minimum burn interval of 5 years was used as it reflects what is feasible for agencies to achieve while allowing fuel recovery after burning. For landscape blocks, the minimum burn interval is the minimum tolerable fire interval for the majority of the vegetation type within each block, as represented by NSW Department of Planning and Environment mapping. In each case study landscape, 1000 ignition locations were selected based on an empirical model developed and tested for similar forest types 56 . Individual fires were ignited at 11:00 h local time and propagated for 12 h, unless self-extinguished within this period. This time period provides a standardised approach for risk estimation 15 , 57 and was chosen as a compromise between a sufficient amount of time for significant wildfire impacts to be realised 58 , while avoiding the factorial multiplication of weather conditions spanning multiple days. We tested seven combinations of equal edge and landscape treatment (0, 1, 2, 3, 5, 10, 15% p.a.), resulting in a range of fuel age classes for each simulation (Supplementary Figures 7 –10). Half-hourly weather data was drawn from the full record of observations at the nearest Bureau of Meteorology automatic weather station for each case study landscape (Casino 1995–2014, Gloucester 1991–2014, Blue Mountains 1991–2014, Jervis Bay 2000–2014). Simulations were repeated for each of the fire danger categories that had been recorded during the fire season (Spring-Summer) in each case study landscape i.e. Low–Moderate (0–11), High (12–24), Very High (25–49), Severe (50–74), Extreme (75–99) and in Jervis Bay only, Catastrophic (100+). The results from the simulated fires were used to estimate the impact on five management values (see “ Impact estimation ” section below) and then adjusted for the frequency of fire weather conditions contributing to ignitions and fire spread to estimate annualised risk (see “ Risk estimation ” section below).
Two sets of simulations were run to explore the effect of 2019–2020 fire weather conditions on prescribed burning effectiveness: (1) with weather drawn from the long-term historical record of fire season observations, referred to as "control”, (2) with weather drawn only from the 2019–2020 fire season, referred to as “2019–2020”. For Casino the period of active fire in the 2019–2020 fire season was September 2019 to December 2019, for Gloucester and the Blue Mountains this was October 2019 to December 2019, and for Jervis Bay this was December 2019 to January 2020. The relative frequency of fire weather conditions in each scenario was incorporated into risk estimation through a Bayesian decision network (see “ Risk estimation ” section below).
Three sets of simulations were run to explore the trajectory of risk in the aftermath of 2019–2020 fire season: (1) with a fire history excluding the 2019–2020 fire season and with no prescribed burning, referred to as “control”, (2) with a fire history including the 2019–2020 fire season, and with prescribed burning and fuel accumulation through to 2021 i.e. 2 years after the 2019–2020 season (“2021”), and (3) the same as (2) except through to 2025 (“2025”). Due to the very large area burnt during the 2019–2020 season, prescribed burning treatment rates (edge and landscape) were capped at 5% p.a. for Casino, Gloucester and the Blue Mountains. In Jervis Bay, where 81% of the study area was burned by the 2019–2020 fires, edge treatment was capped at 5% p.a. and landscape treatment rate was capped at 1% p.a.
Impact estimation
Effectiveness of prescribed burning at mitigating wildfire impacts was assessed base on area burnt and four management values: house loss, loss of human life, length of powerline damaged and length of road damaged. Area burnt was a direct output from the fire behaviour simulations. The probability of house loss was calculated as a function of predicted ember density, flame length and convection as presented in 59 . House loss was calculated per 180-m model grid cell and then multiplied by the number of houses in that grid cell to estimate the number of houses lost per fire. Statistical loss of human life was based on house loss (using the house loss function), the number of houses exposed (using simulation output) and the number of people exposed to fire 60 . House location and population density data were derived from national datasets ( 61 , Australian Bureau of Statistics) and combined to give the total number of people exposed to fire. Road and powerline location data was supplied by the NSW Department of Planning and Environment. In the absence of empirical data a simple threshold of 10,000 kW/m was used to classify roads or powerlines within each 180-m grid cell as damaged by fire or not. Impacts were estimated from simulation output and the datasets described above, resulting in a distribution of area burnt and impacts on the four management values, corresponding to different weather, treatment and ignition scenarios.
Risk estimation
Building on previous studies 15 , 57 , a Bayesian Decision Networks (BDN) approach was used to generate residual risk estimates and hence evaluate the risk mitigation available from prescribed burning. We adopted the recommendations of Marcot et al. 62 and Chen and Pollino 63 in designing our BDN. A conceptual model was adapted from previous studies of fire management 64 and used to create an influence diagram. In this model fire weather affected ignition probability; fire weather and treatment option (a decision node) affected the distribution of fire sizes; and fire weather, fire size and fire management affected the amount of loss for a given management value. To translate the influence diagram into risk estimates, probability distribution tables were populated for the fire weather node (based on weather station data) and the fire size and management value impact nodes (based on the impact estimation step described above) of the BDN. The BDN then generated output values for each of the different prescribed burning treatment scenarios, based on the influence diagram.
Continuous data were discretised on a log scale across the range of values iteratively to get a relatively even distribution across non-zero values. For each FFDI category, we calculated the average maximum daily FFDI during the fire season for each study area, using the same weather station data used to drive PHOENIX. FFDI values were then separated into fire days (fire recorded within 200 km of the weather station) and non-fire days. The relative frequency of fire days was then used to drive ignitions in the BDN. Raw risk values were the expected node likelihoods for area burnt, house loss, life loss, length of powerline damaged and length of road damaged. These raw values were converted into residual risk values by dividing them by the risk value associated with the zero edge, zero landscape treatment scenario. These risks can be validly compared between regions because they reflect the observed distribution of fire weather conditions in each area. Further details of fire behaviour simulations, impact estimation and risk estimation can be found in 15 , 57 .
Supplementary Information
Acknowledgements.
We acknowledge the New South Wales Government's Department of Planning & Environment for providing funds to support this research via the NSW Bushfire Risk Management Research Hub. Thank you to the NSW Rural Fire Service and NSW Department of Planning and Environment for providing data. The authors declare no conflicts of interest.
Author contributions
H.C.: conceptualisation, formal analysis, writing—original draft, visualization. B.C.: conceptualisation, software, investigation. T.P.: conceptualisation, methodology, writing—review and editing. O.P.: methodology, writing—review and editing. M.M.B.: methodology, writing—review and editing. R.B.: conceptualization, methodology, writing—review and editing.
Data availability
Code availability, competing interests.
The authors declare no competing interests.
Publisher's note
Springer Nature remains neutral with regard to jurisdictional claims in published maps and institutional affiliations.
The online version contains supplementary material available at 10.1038/s41598-022-15262-y.

- ENVIRONMENT
Wildfires are making their way east—where they could be much deadlier
We all know wildfires have been getting worse in the drought-stricken western U.S., but experts say the growing risk on the east coast is concerning.
When we think of wildfires, we often think of western states like California where massive blazes, such as the 2018 Camp Fire, have been among the deadliest and most destructive in modern history. In 2020, California’s worst wildfire year on record, 8,648 fires scorched 4.3 million acres of land.
While California and other western states face a high wildfire risk, the region’s wide expanses of wilderness are less likely to threaten humans. Not so in the eastern and southern United States, where population density puts more people and property at risk. According to the U.S. Census , 56 percent of the U.S. population lives in the eastern and southern regions of the country, compared to just 24 percent in the West.
New research shows that there may be cause for concern in the East as well, where fire size, numbers, and total area burned seem to be increasing.
Recently published in Geophysical Research Letters , researchers used data collected over a 36-year period to show that large wildfire numbers doubled from 2005-2018, compared to the two decades prior. The biggest increases were seen in the Southern Coastal Plains of Florida, portions of coastal Georgia, and South Carolina where the five largest wildfires occurred. Significant wildfires were also common in the Central Appalachian Mountains of Tennessee, West Virginia, and Virginia.
Conversely, wildfire numbers decreased in the northeastern U.S. as shifting climactic conditions led to more precipitation.
Why fires are increasing
The goal of the study was to identify whether wildfires were growing in frequency and scope, not to show what was causing this increase. But the authors speculate that warmer, drier conditions brought on by a changing climate combined with a lack of prescribed fires has led to a proliferation of woodier plants, trees, and shrubs that provide the fuel for fires to burn in greater strength and numbers.
FREE BONUS ISSUE
“This makes for wildfire conditions that are much more difficult for us to suppress,” says Victoria Donovan, lead author of the study and an ecologist at the University of Florida’s West Florida Research and Education Center in Milton, Florida.
Invasive species like Cogongrass, a perennial weed capable of driving wildfires deeper into the forest, have also taken over large swaths of the South, across Alabama, Mississippi, and Florida. The grass increases the instances of wildfires because, once ignited, it burns hotter and faster and regrows more rapidly than native grasses.
You May Also Like
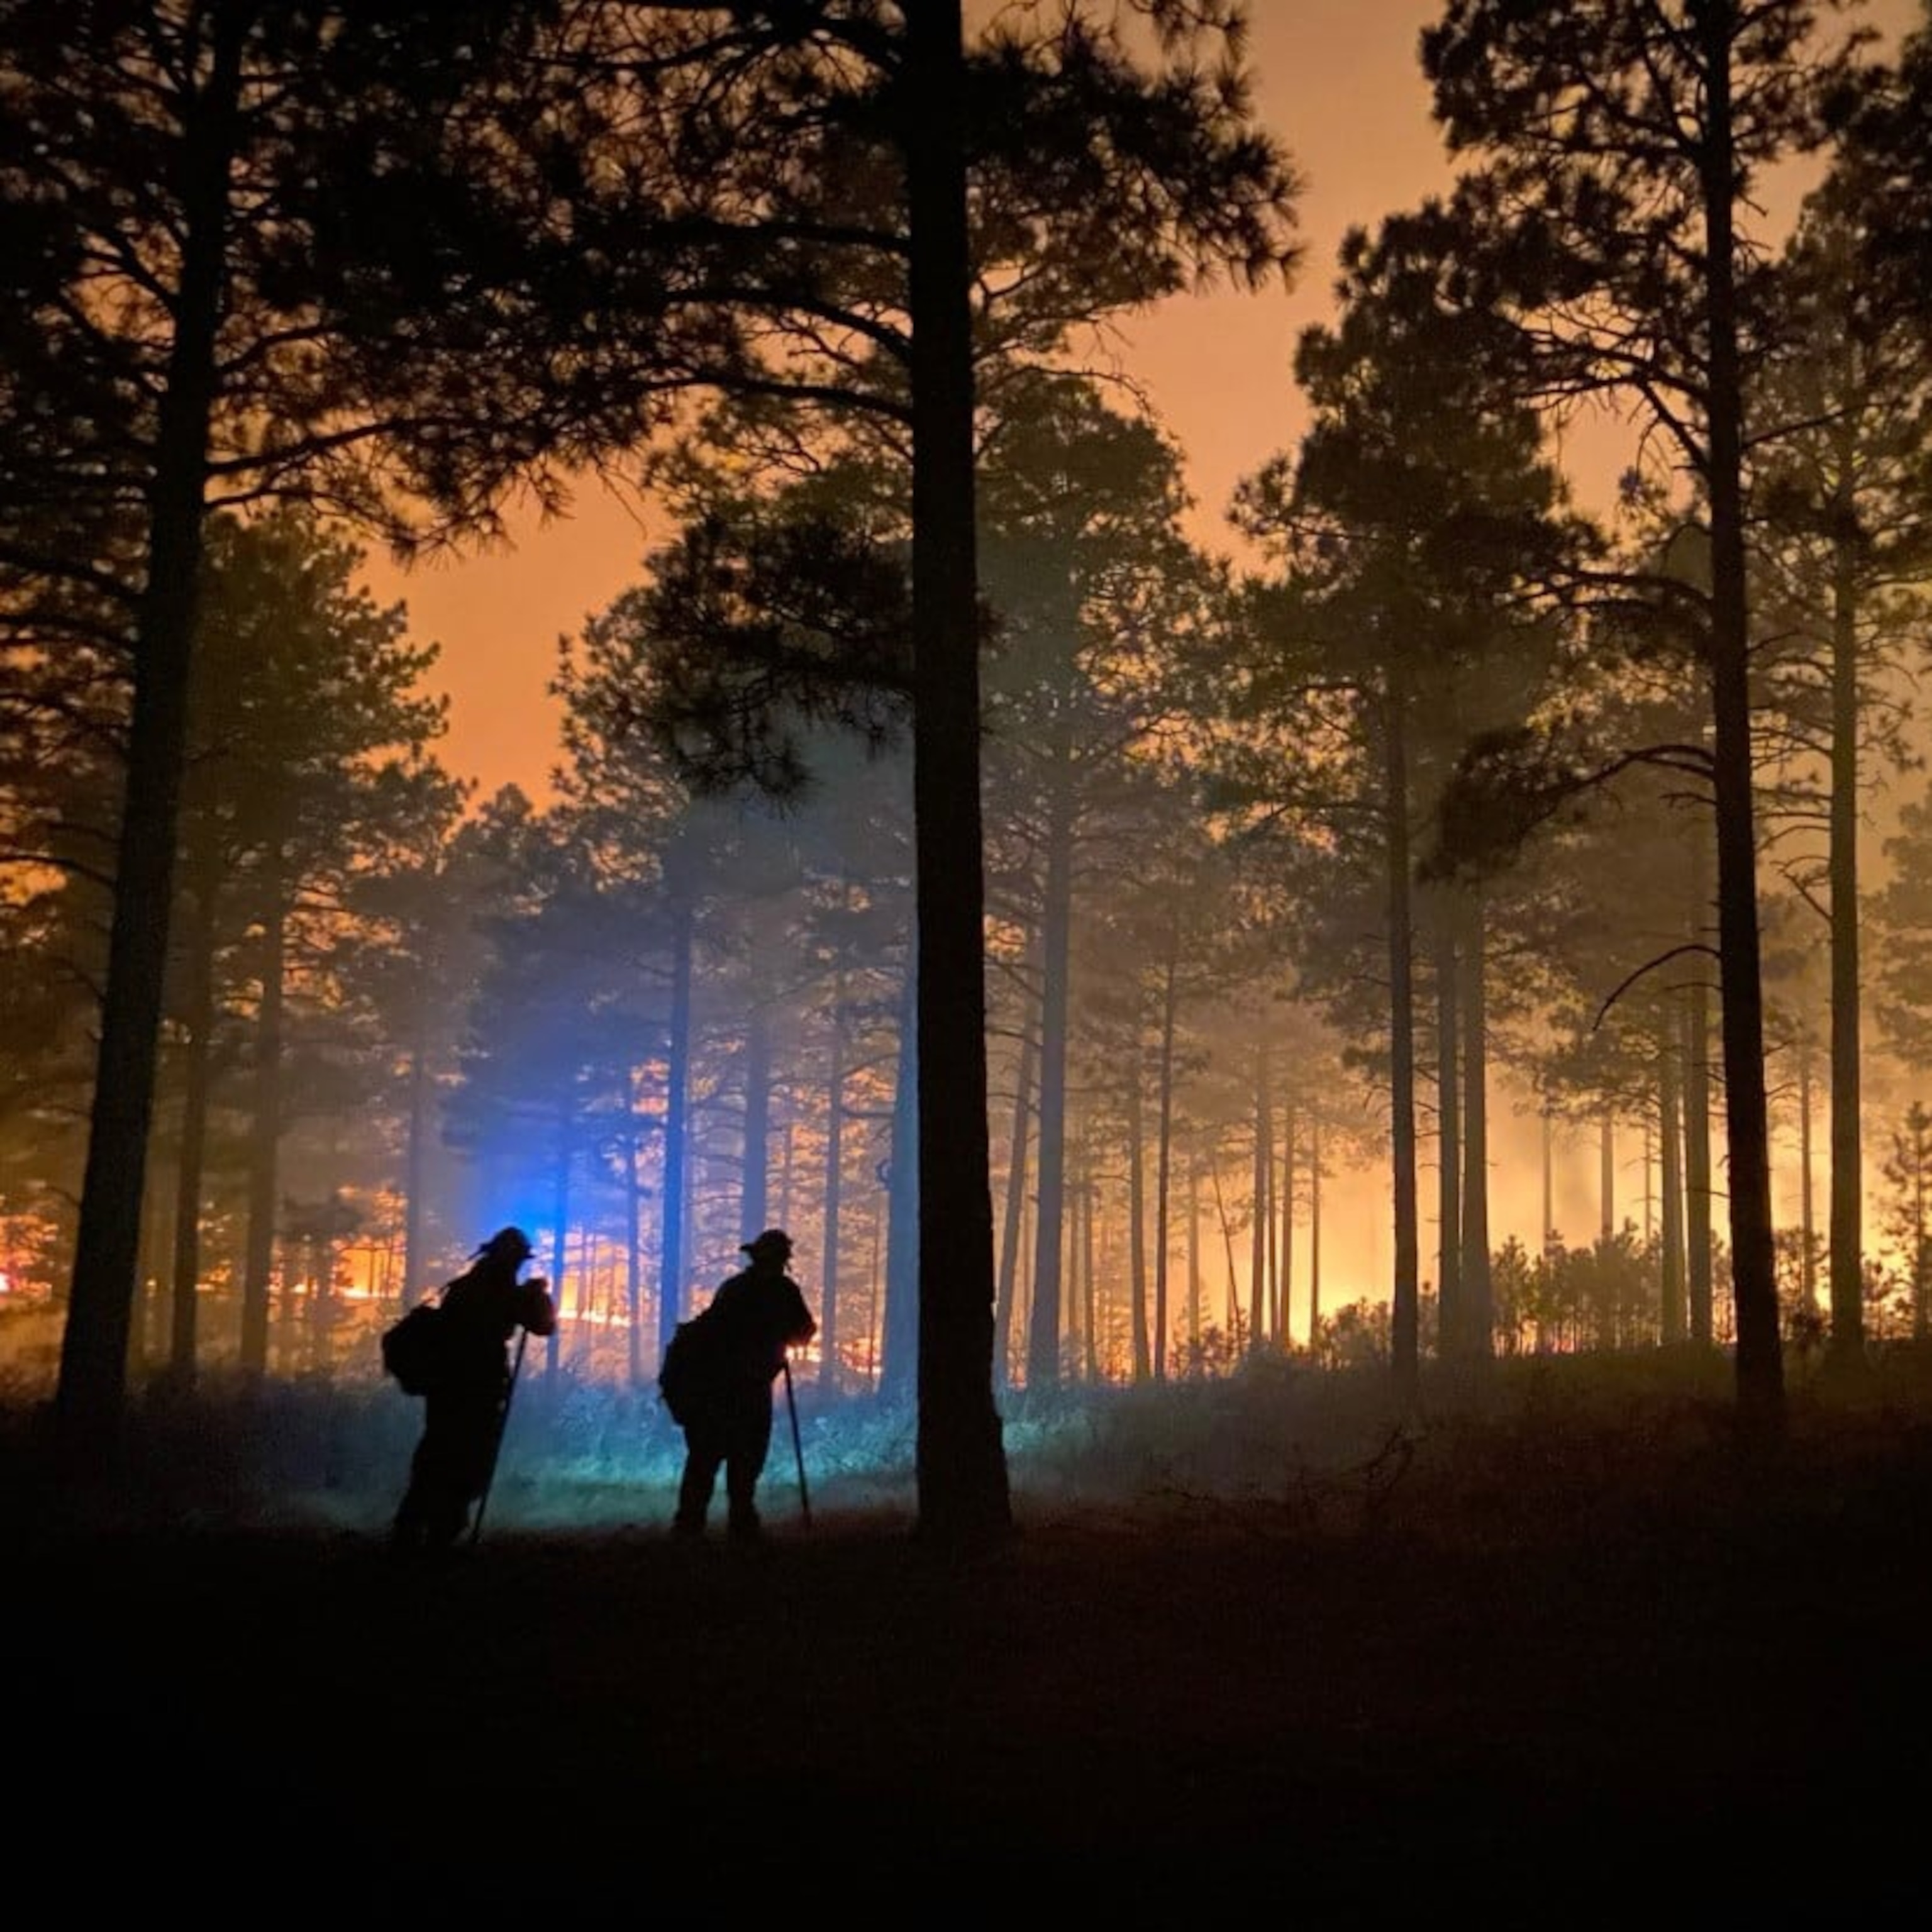
Their house has stood for 130 years. A new wildfire era may change that.
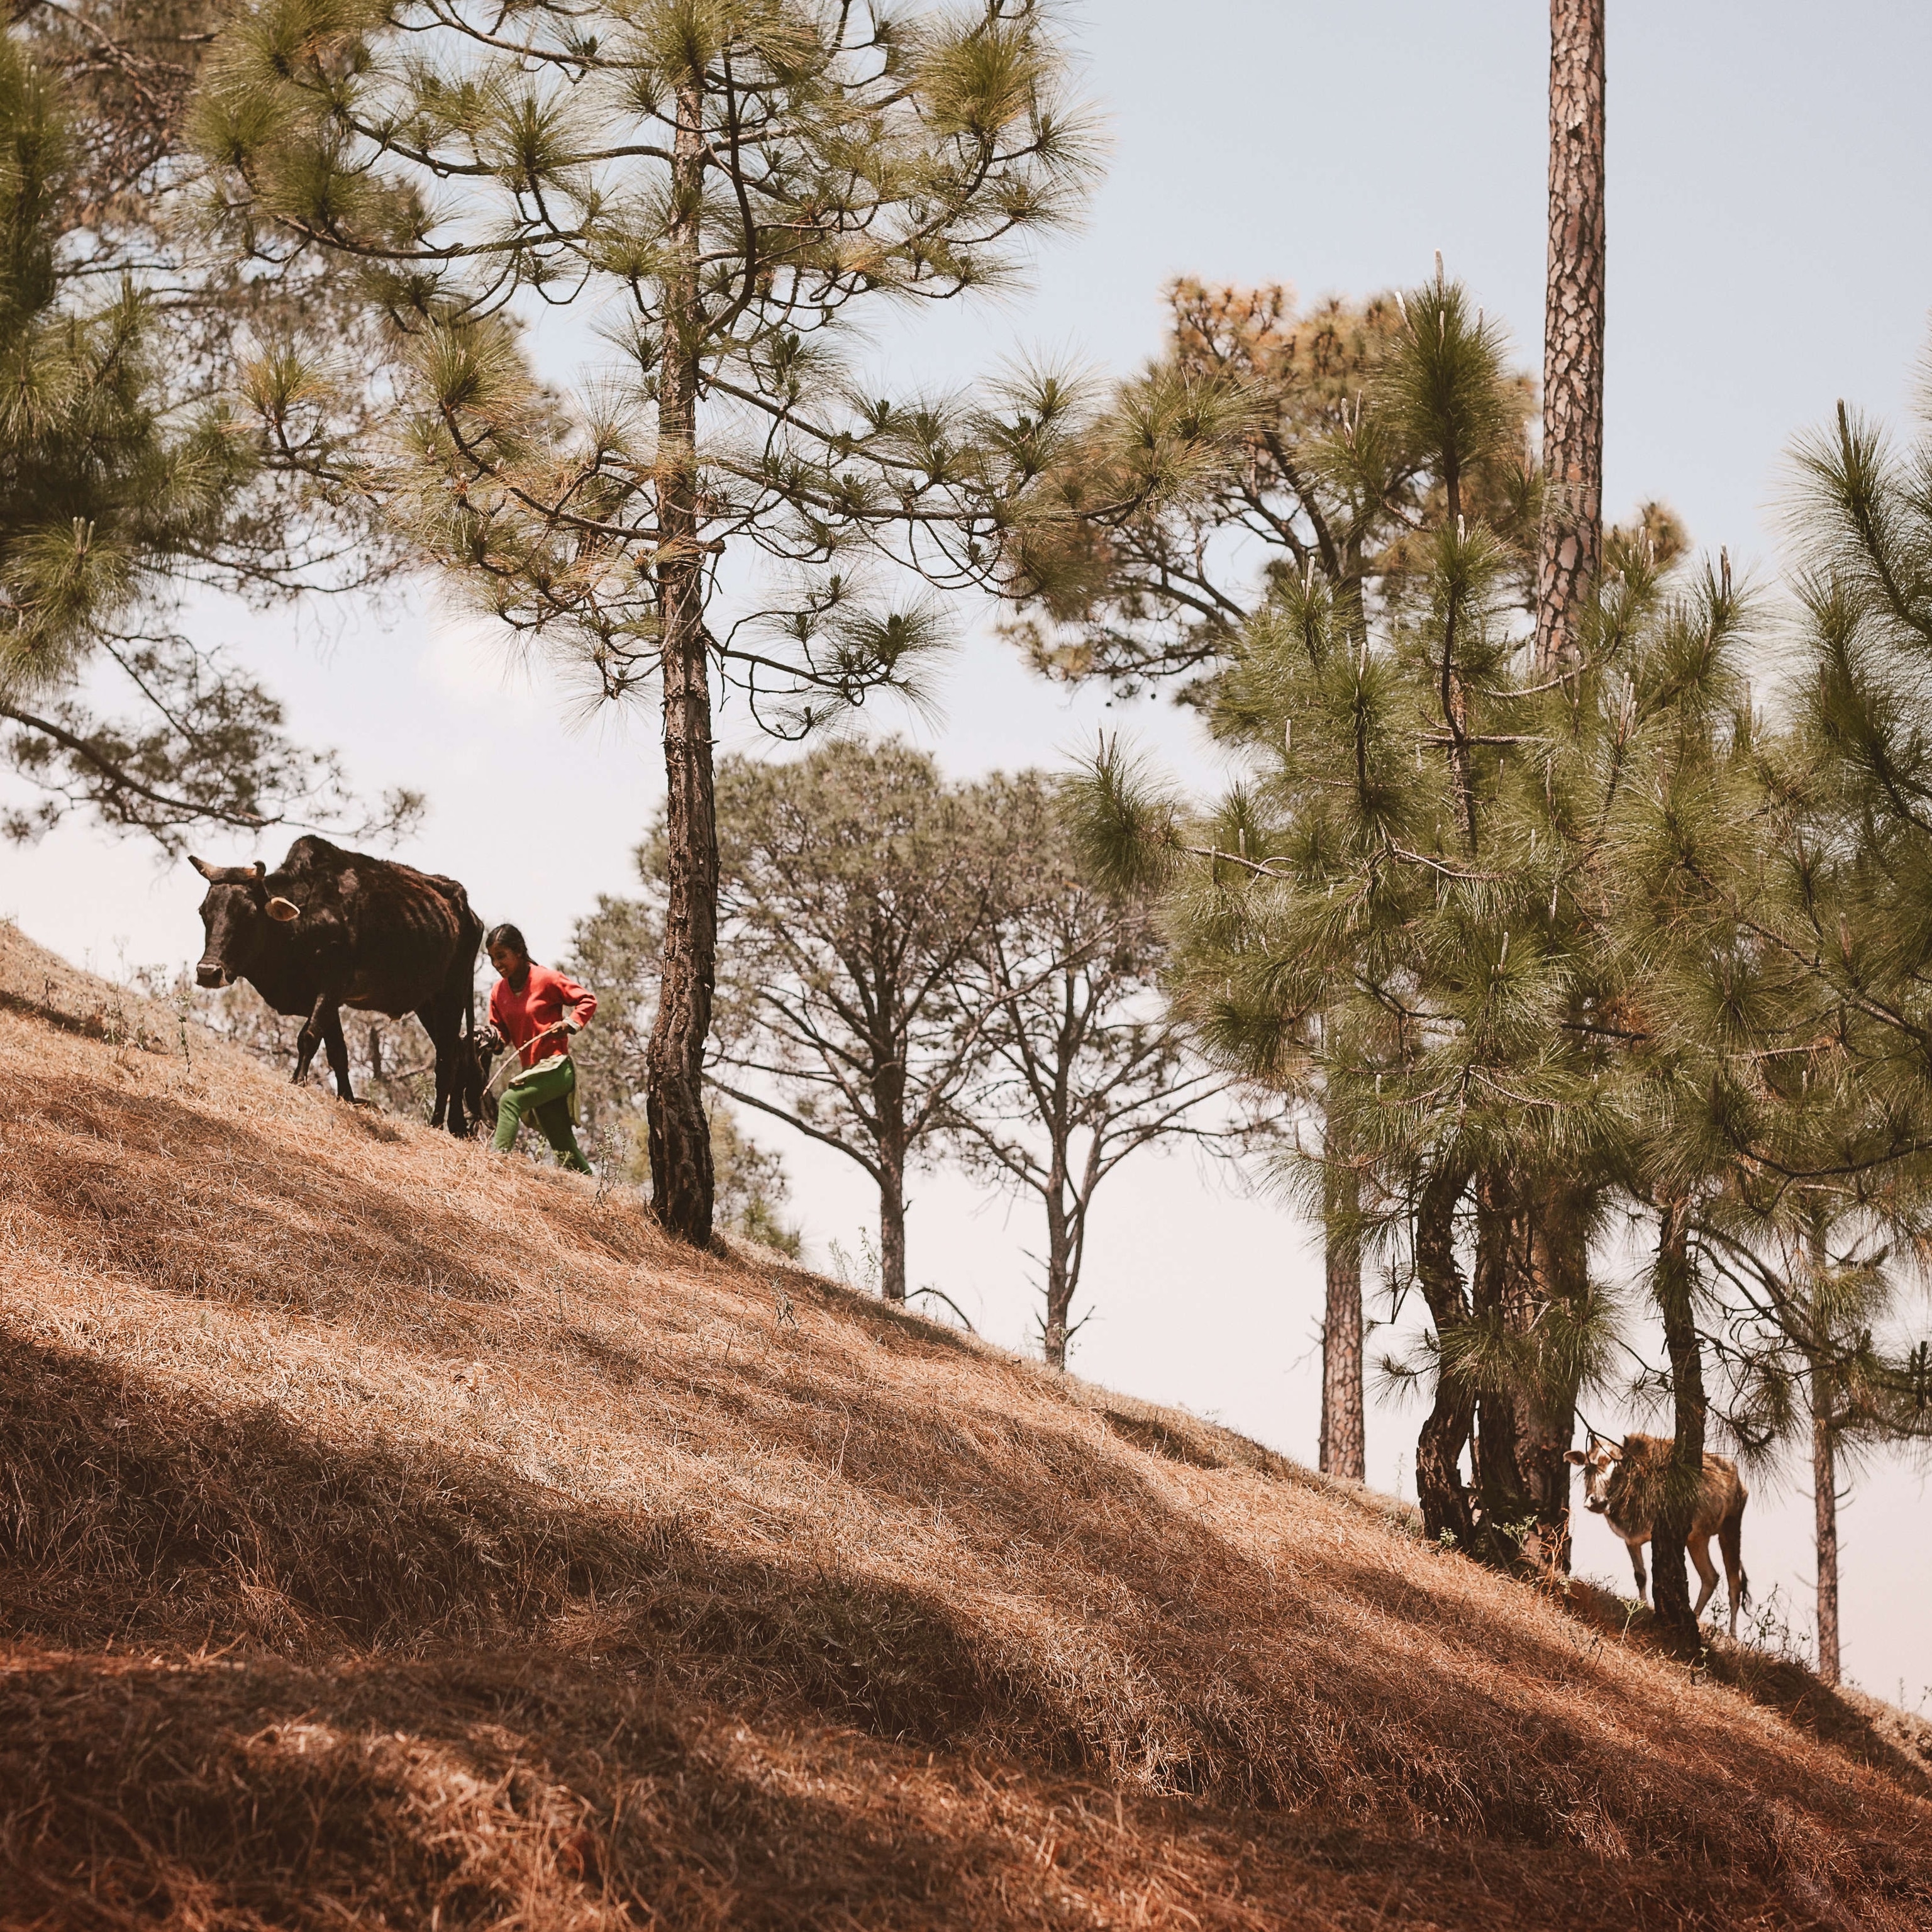
As wildfires increase in Himalayan pine forests, can restoring oaks help?
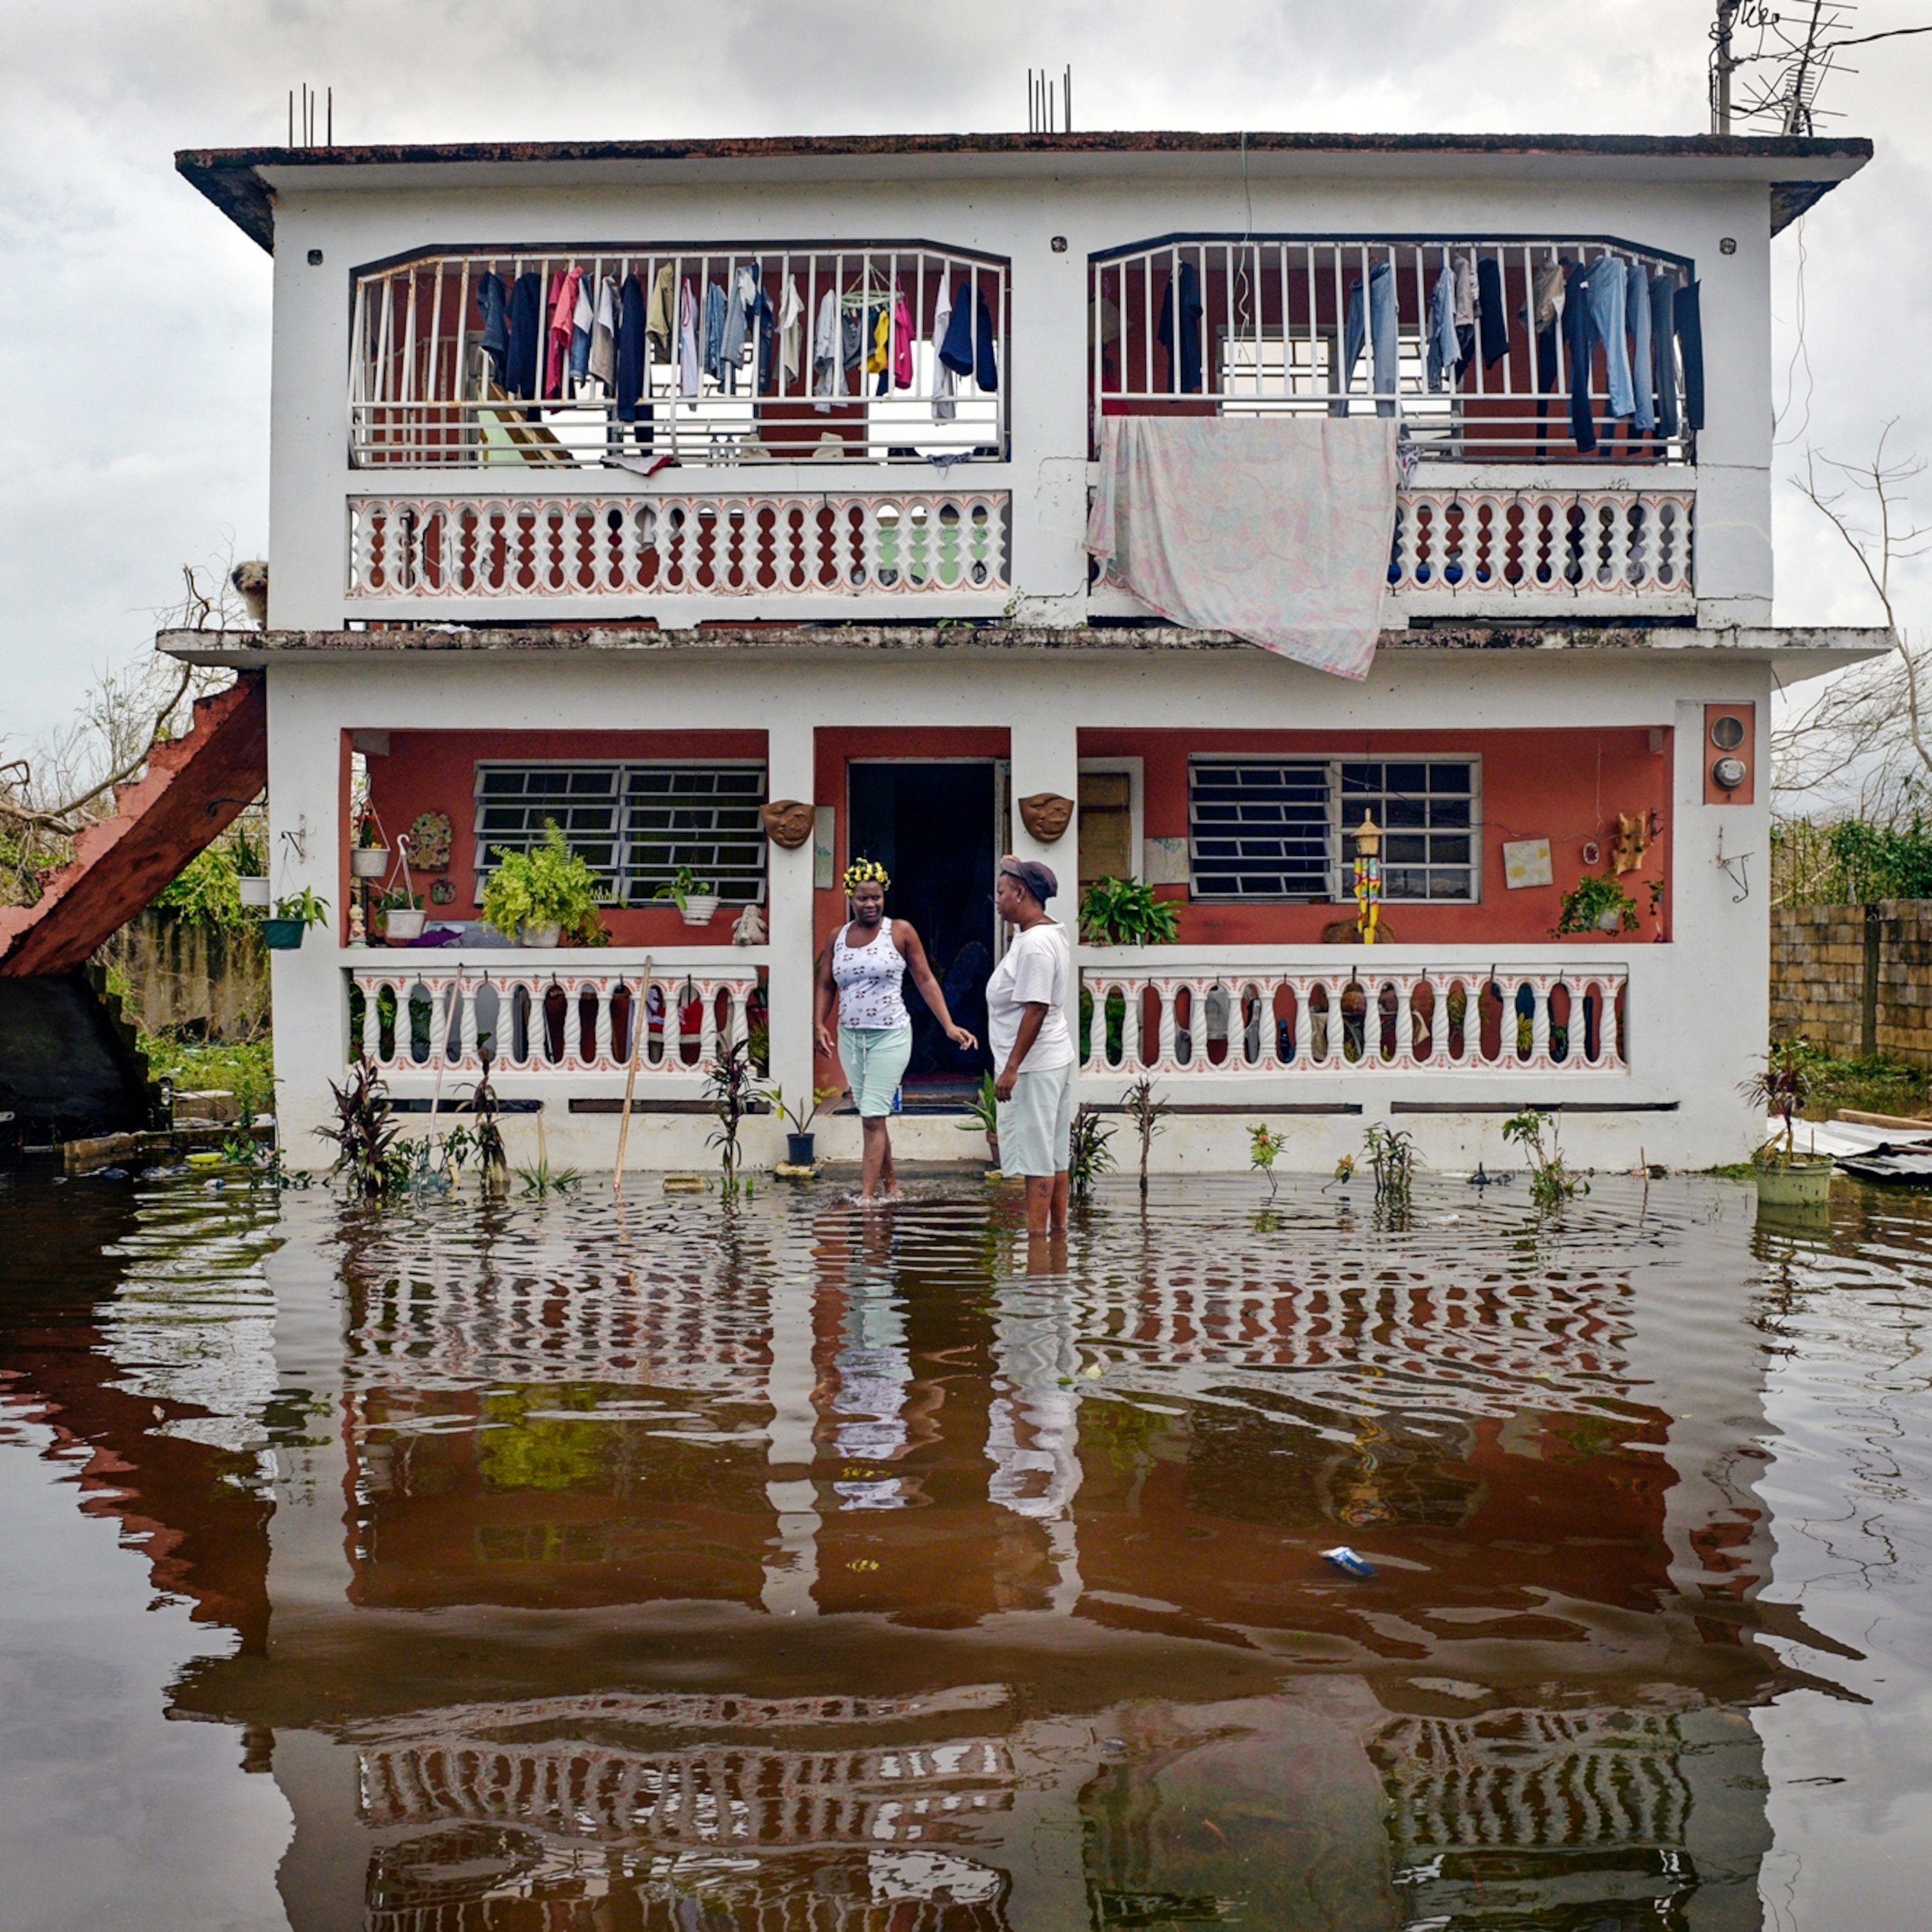
Weather disaster-related deaths are down—warming could undo that trend
Why wildfires in the east present greater risk.
While the fires aren’t as large as they are in the West, the risk to humans is much greater.
“In the East we have a greater wildlife-urban interface, where we’ve seen more people intermingling with wild land vegetation,” says Donovan.
The study points to examples like the 2016 Gatlinburg fire in Tennessee, which, although less than a tenth of the size of the Camp Fire, destroyed nearly 2,500 structures and killed 14 people. When wildfires ignite in densely populated areas, they not only increase the risk of a loss of life, but also become harder to defend.
Additionally, the danger of wildfire smoke extends much farther than just the immediate area of the fire and can impact more people in the eastern U.S. Last year’s Canadian wildfires, for example, placed more than a third of the U.S. population under air quality advisories.
The study also found that 85 percent of wildfires were caused by humans, a statistic which isn’t surprising to Volker Radeloff, a forestry professor at the University of Wisconsin Madison who was not involved in the study. He says that when fires happen in populated areas, the risk of human ignition increases. People can start fires for any number of reasons, and in populated areas it puts the landscape at risk. They might be burning dead leaves in their backyard, and it gets out of hand—or, in the case of the Gatlinburg fire, two teenage boys playing with matches set the land ablaze.
“In these areas where houses and wildlife vegetation intermingle it’s kind of a double whammy because when a fire occurs lots of houses are at risk, you have to evacuate people, and there’s also more people to start fires either intentionally or unintentionally,” says Radeloff.
Planning for the unknown
While the study did show that the number of wildfires in the past four decades have increased, it’s challenging to point to trends because in the East, there’s still so much variability in the weather from year to year, says Loretta Mickley, a senior climate research fellow at Harvard, who was not involved in the study. “There will be one huge fire one year and then not much in the years to follow. You’re left wondering whether it’s a bad year or a trend,” she says.
While in the West you can see a clear upward trend in fires as precipitation decreases and temperatures increase, in the East the weather is less predictable. In an El Niño year, for example, the distribution of rainfall in the South and East may quell the risk of wildfires.
She says that the study is an “important first step” in showing us where we need to be taking care to protect the landscape.
And no matter whether it’s a trend or not, the numbers are concerning. “Right now, it’s safe to say that in the Eastern U.S. there are quite a few eco-regions that have had more fires in the last five to 10 years than in the decades before that,” says Radeloff.
Related Topics
- CLIMATE CHANGE
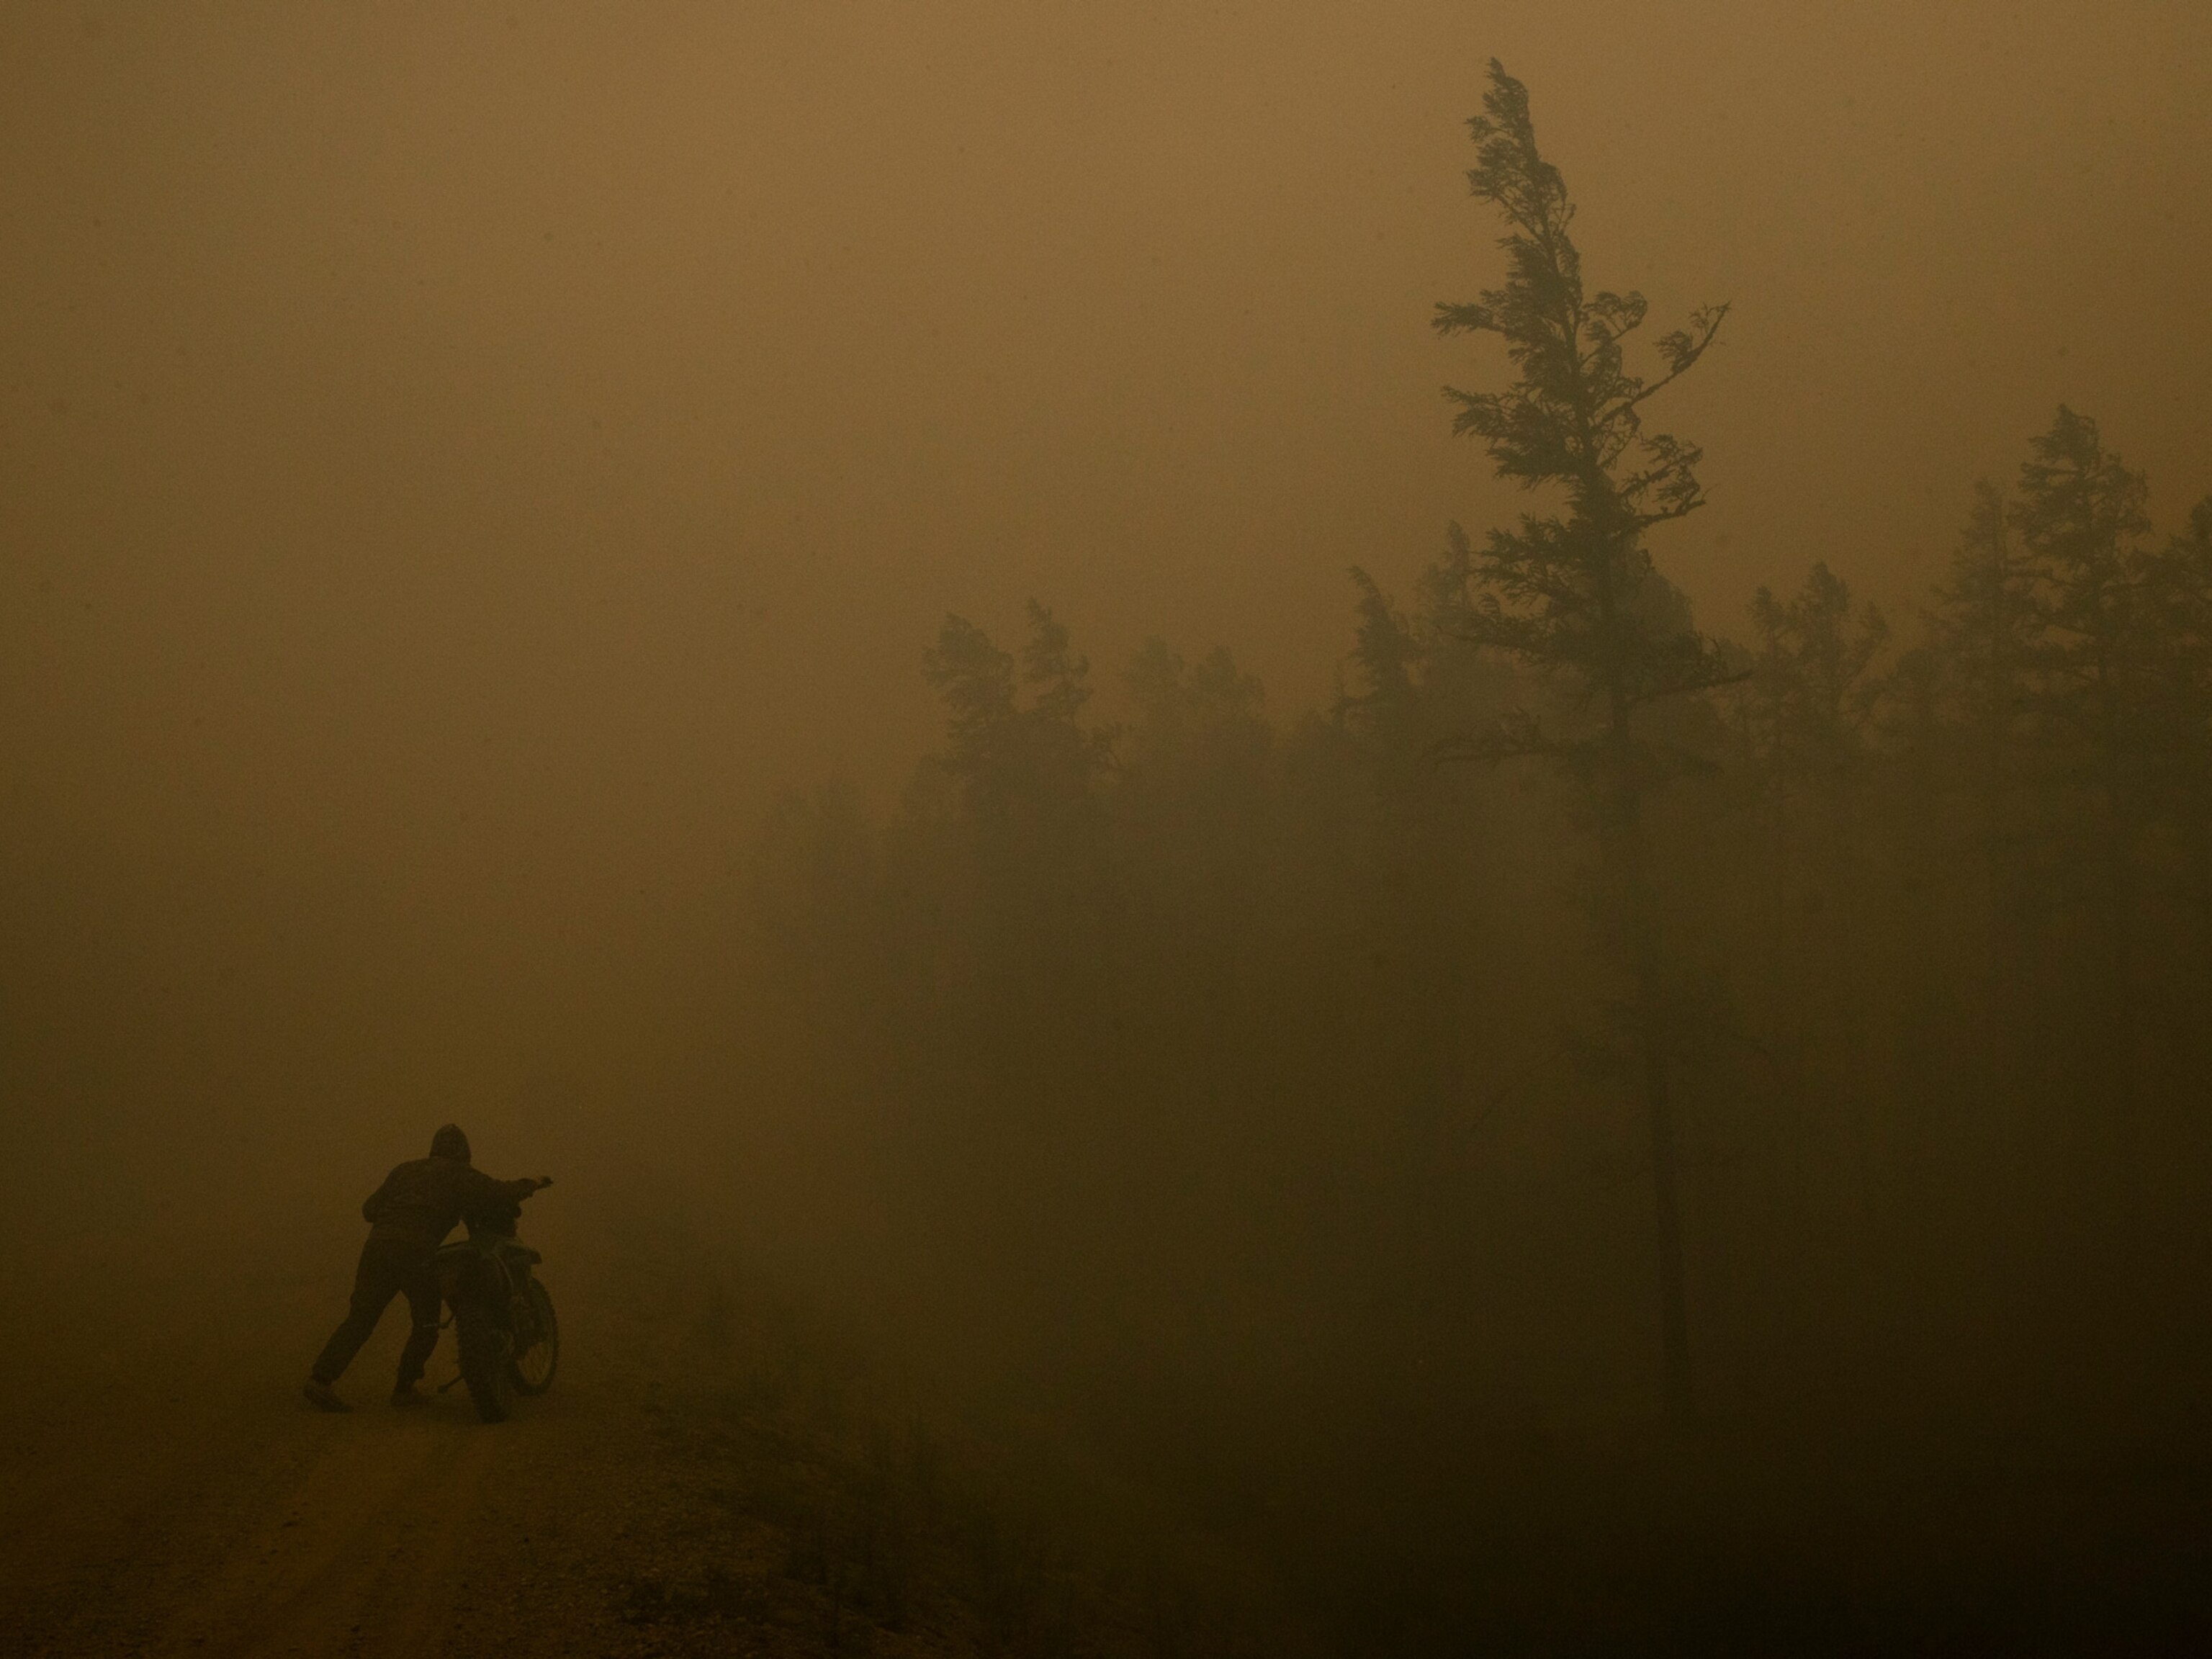
Siberia’s massive wildfires are unlocking extreme carbon pollution
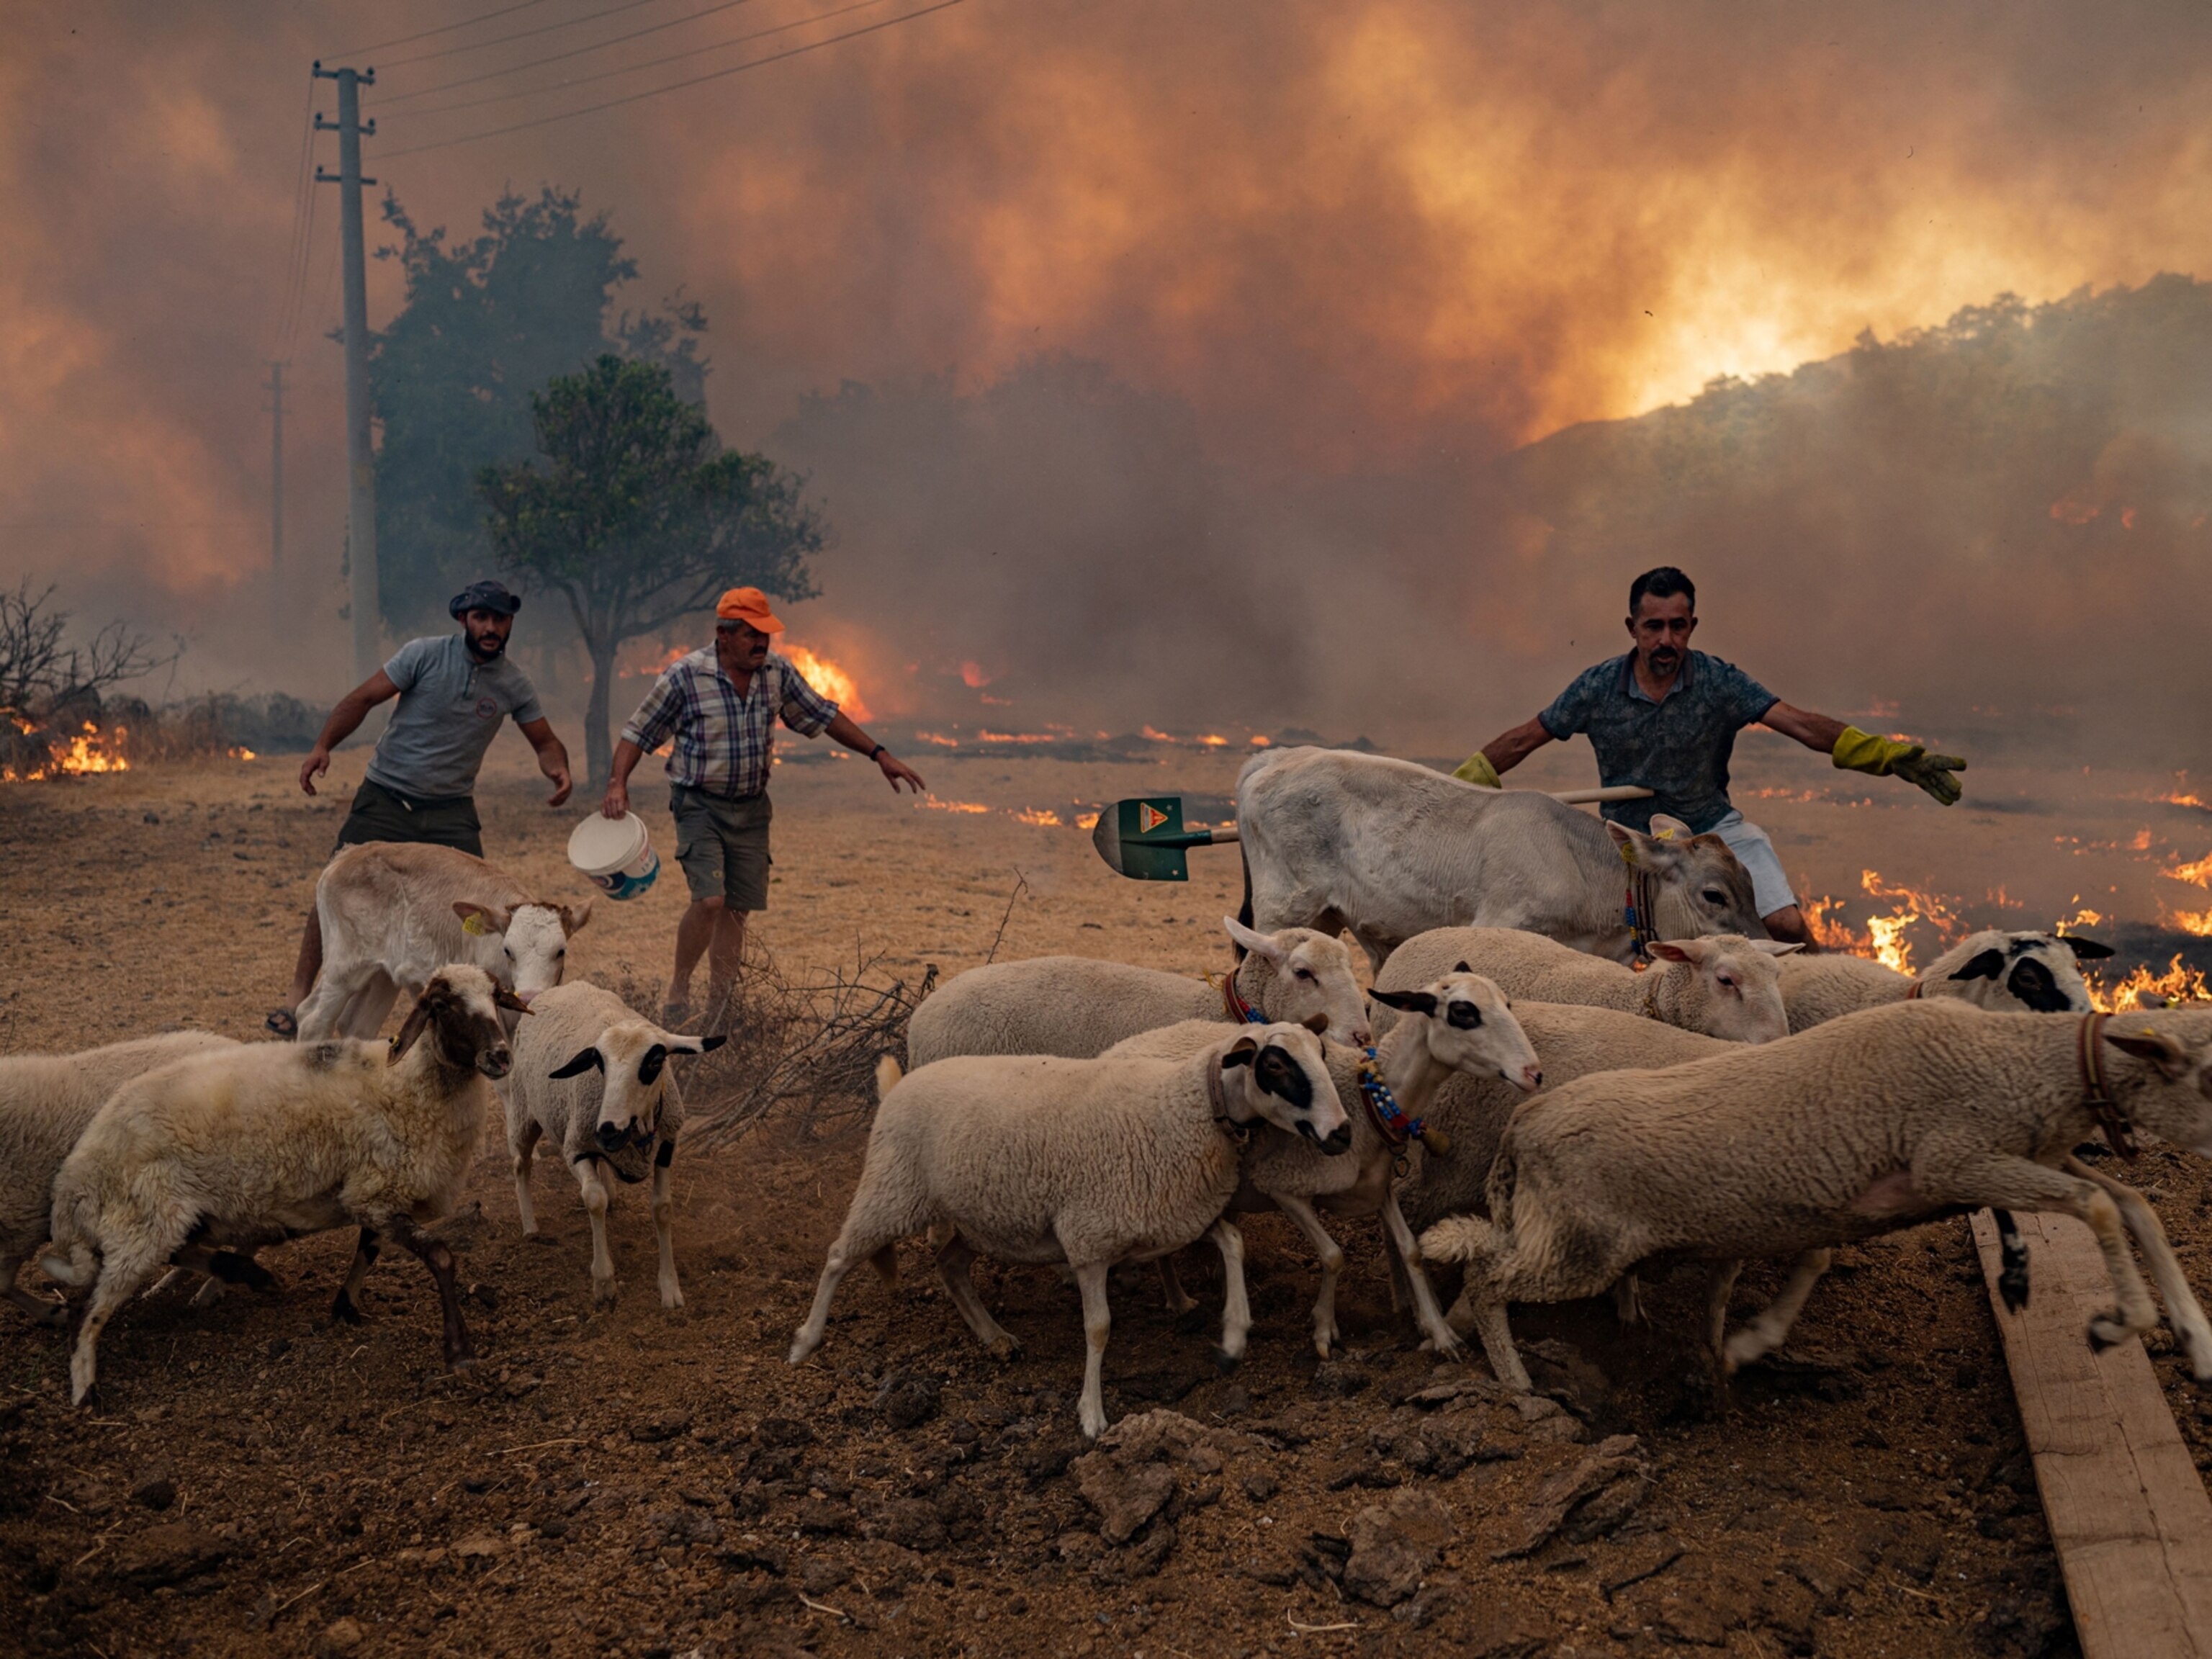
Deadly heat waves, floods, drought will get worse if warming continues
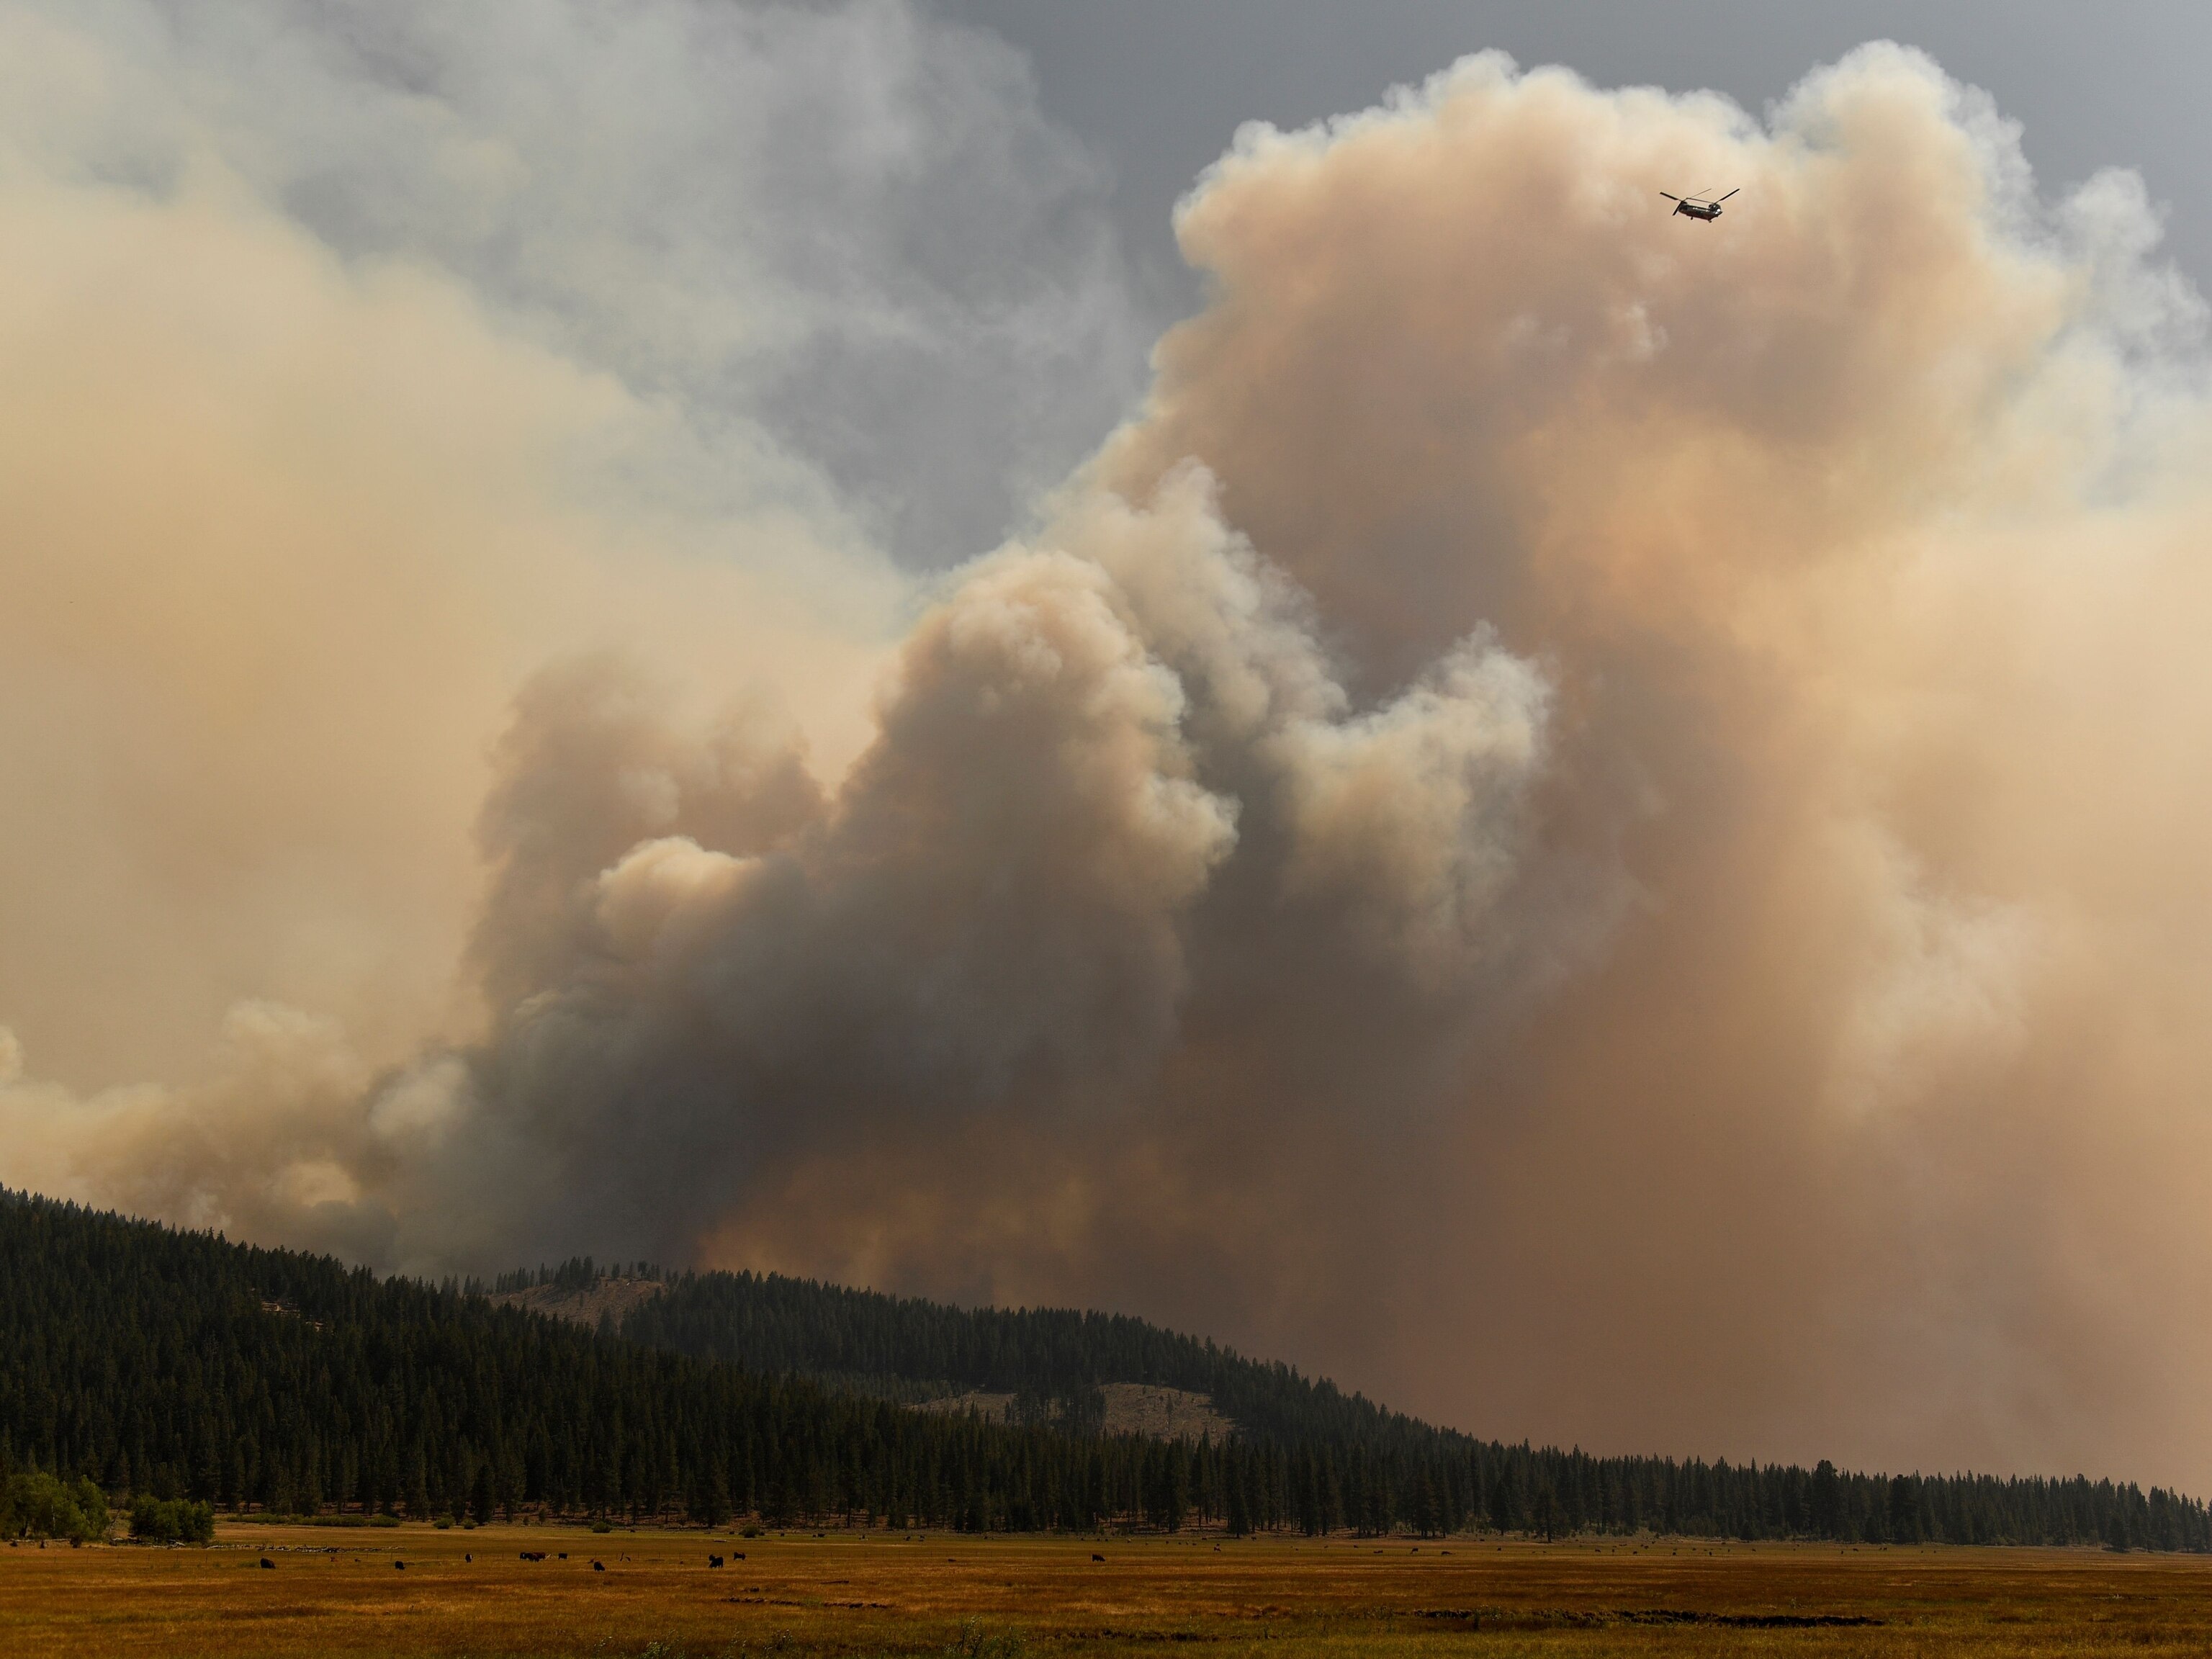
Wildfire smoke is transforming clouds, making rainfall less likely

This ancient society tried to stop El Niño—with child sacrifice
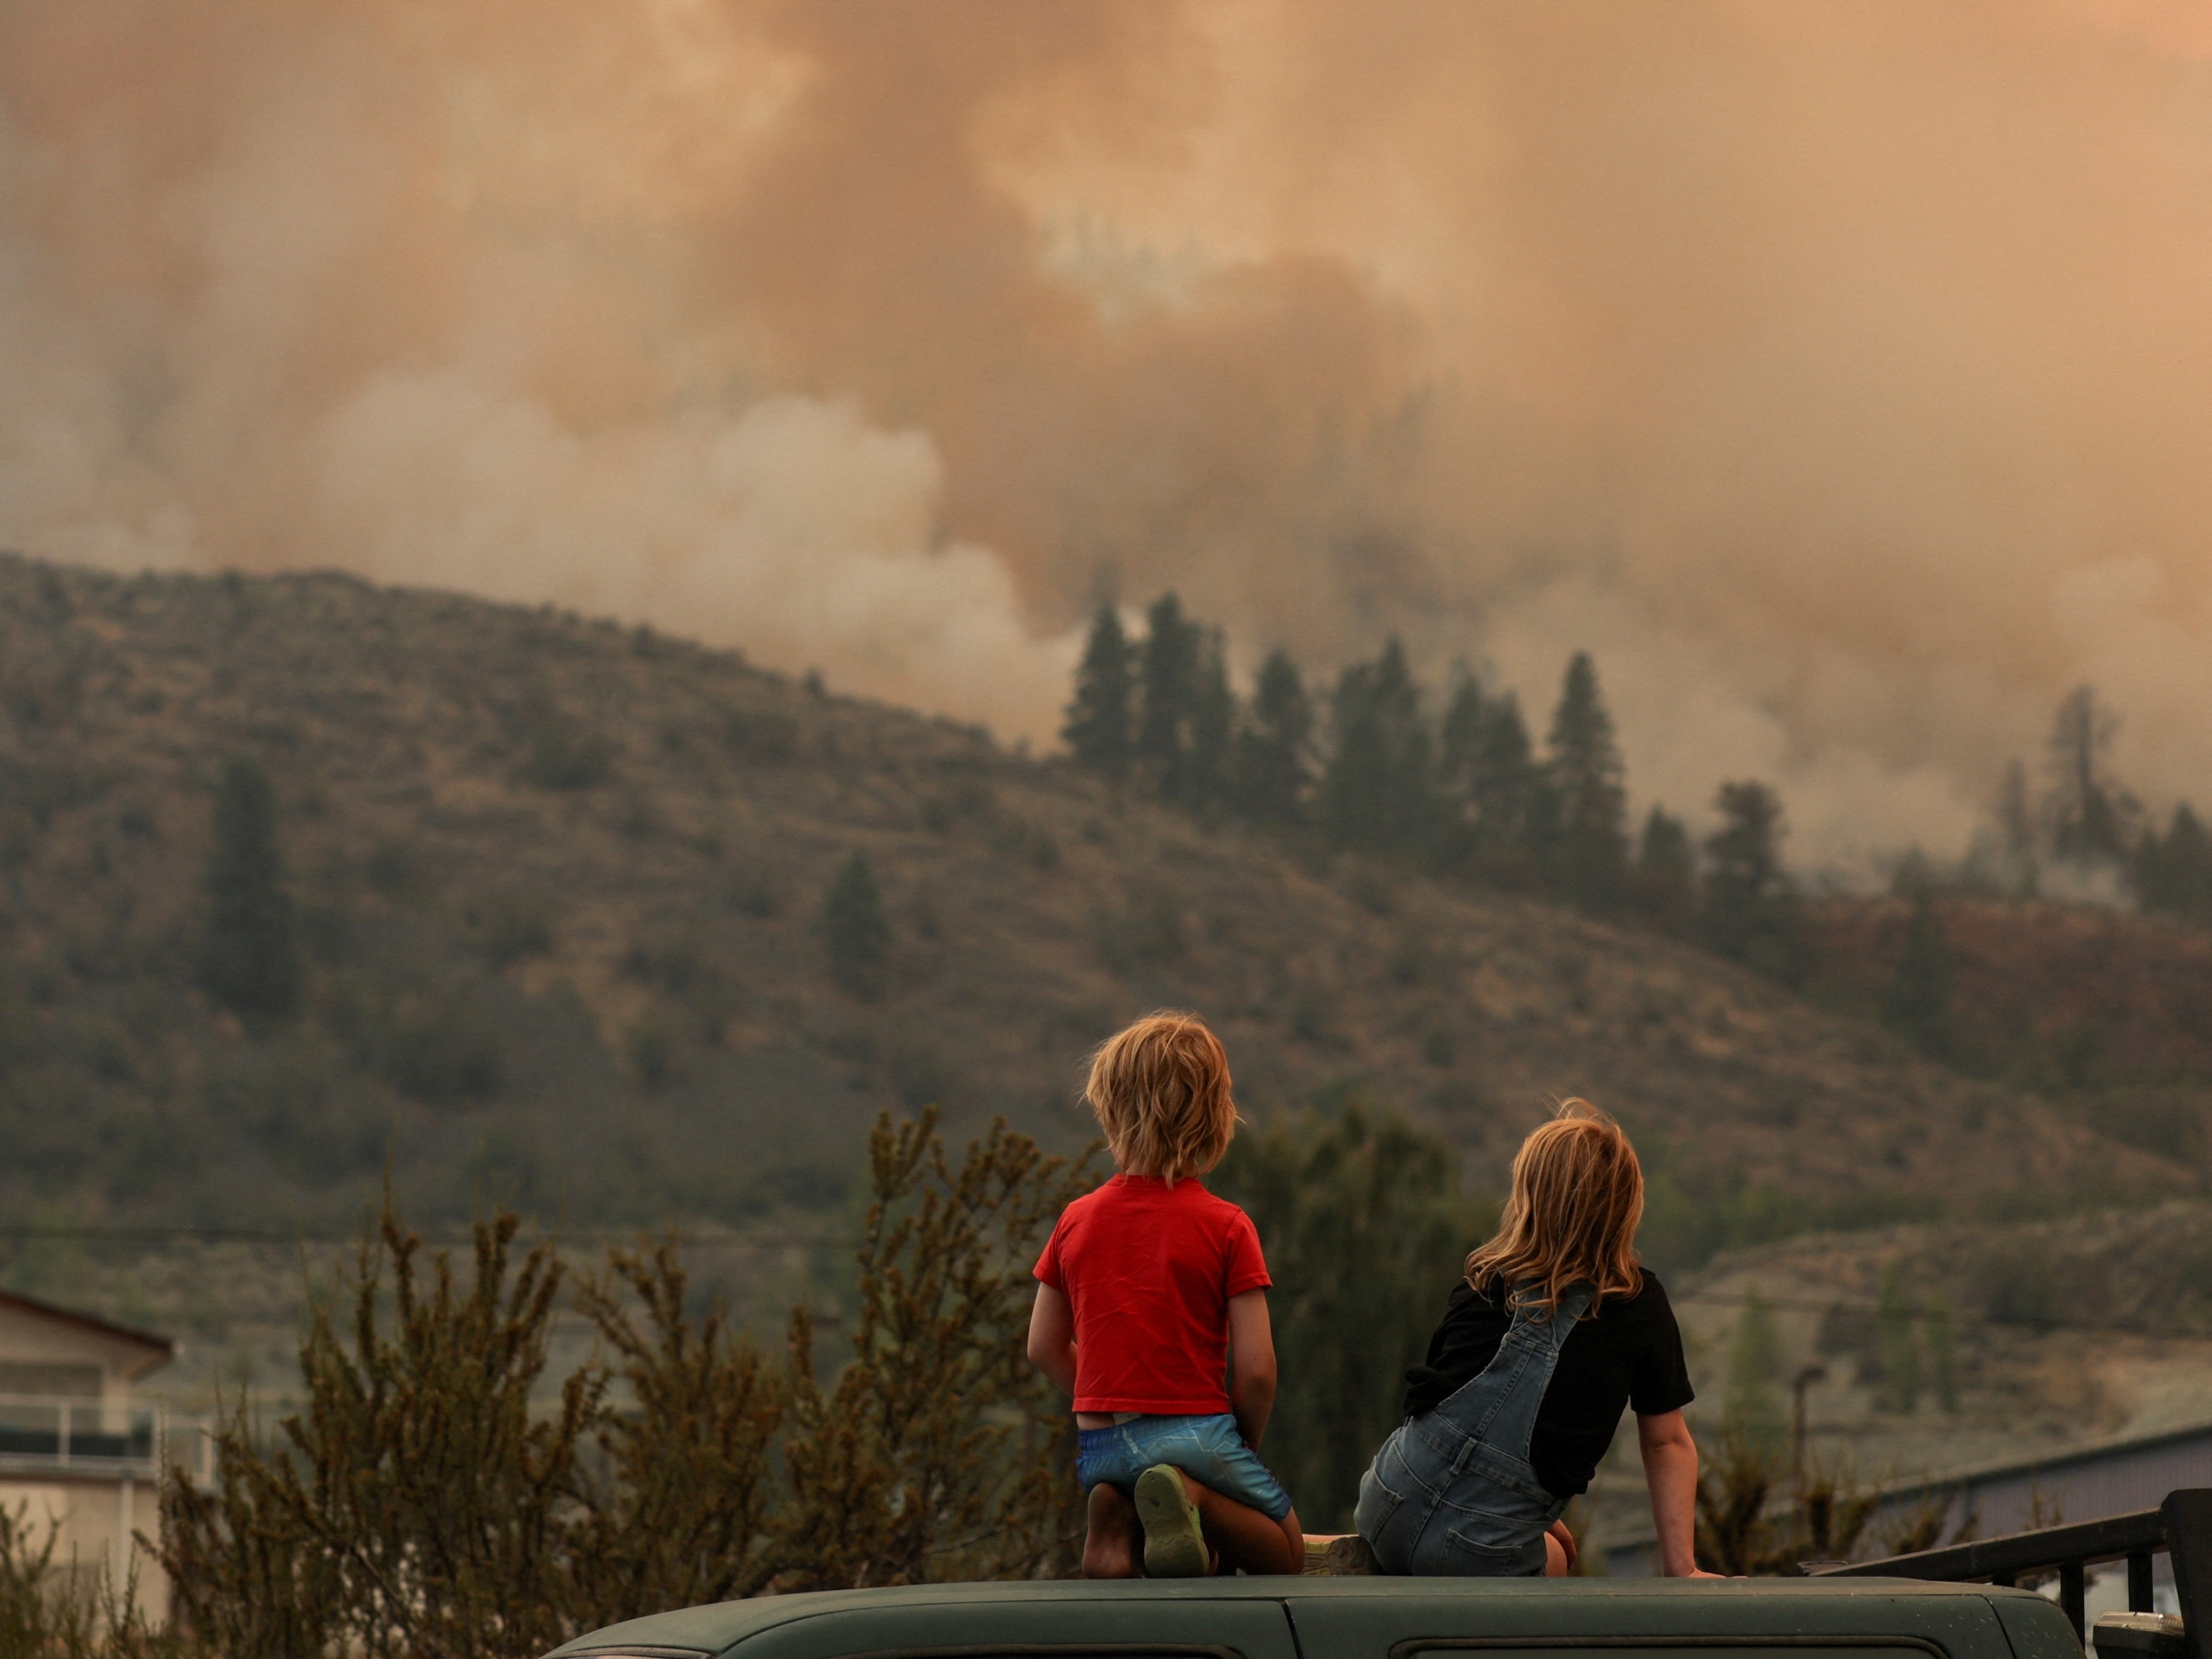
How wildfire smoke can permanently damage your brain and body
- Environment
- Perpetual Planet
- History & Culture
History & Culture
- History Magazine
- Mind, Body, Wonder
- Terms of Use
- Privacy Policy
- Your US State Privacy Rights
- Children's Online Privacy Policy
- Interest-Based Ads
- About Nielsen Measurement
- Do Not Sell or Share My Personal Information
- Nat Geo Home
- Attend a Live Event
- Book a Trip
- Inspire Your Kids
- Shop Nat Geo
- Visit the D.C. Museum
- Learn About Our Impact
- Support Our Mission
- Advertise With Us
- Customer Service
- Renew Subscription
- Manage Your Subscription
- Work at Nat Geo
- Sign Up for Our Newsletters
- Contribute to Protect the Planet
Copyright © 1996-2015 National Geographic Society Copyright © 2015-2024 National Geographic Partners, LLC. All rights reserved
Thank you for visiting nature.com. You are using a browser version with limited support for CSS. To obtain the best experience, we recommend you use a more up to date browser (or turn off compatibility mode in Internet Explorer). In the meantime, to ensure continued support, we are displaying the site without styles and JavaScript.
- View all journals
- Explore content
- About the journal
- Publish with us
- Sign up for alerts
- Review Article
- Published: 05 November 2014
Learning to coexist with wildfire
- Max A. Moritz 1 ,
- Enric Batllori 1 nAff10 ,
- Ross A. Bradstock 2 ,
- A. Malcolm Gill 3 ,
- John Handmer 4 ,
- Paul F. Hessburg 5 ,
- Justin Leonard 6 ,
- Sarah McCaffrey 5 ,
- Dennis C. Odion 7 ,
- Tania Schoennagel 8 &
- Alexandra D. Syphard 9
Nature volume 515 , pages 58–66 ( 2014 ) Cite this article
24k Accesses
695 Citations
342 Altmetric
Metrics details
- Earth and environmental sciences
The impacts of escalating wildfire in many regions — the lives and homes lost, the expense of suppression and the damage to ecosystem services — necessitate a more sustainable coexistence with wildfire. Climate change and continued development on fire-prone landscapes will only compound current problems. Emerging strategies for managing ecosystems and mitigating risks to human communities provide some hope, although greater recognition of their inherent variation and links is crucial. Without a more integrated framework, fire will never operate as a natural ecosystem process, and the impact on society will continue to grow. A more coordinated approach to risk management and land-use planning in these coupled systems is needed.
This is a preview of subscription content, access via your institution
Access options
Subscribe to this journal
Receive 51 print issues and online access
185,98 € per year
only 3,65 € per issue
Buy this article
- Purchase on Springer Link
- Instant access to full article PDF
Prices may be subject to local taxes which are calculated during checkout
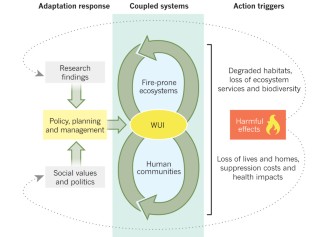
The economic commitment of climate change

Ghost roads and the destruction of Asia-Pacific tropical forests

Climate damage projections beyond annual temperature
McCaffrey, S. Thinking of wildfire as a natural hazard. Soc. Nat. Resour. 17 , 509–516 (2004). This article identifies the importance of viewing fire in the context of natural hazards, which emphasizes human–hazard interactions in ways that most fire research does not.
Article Google Scholar
Holling, C. S. & Meffe, G. K. Command and control and the pathology of natural resource management. Conserv. Biol. 10 , 328–337 (1996).
Driscoll, D. A. et al. Fire management for biodiversity conservation: key research questions and our capacity to answer them. Biol. Conserv. 143 , 1928–1939 (2010). This article examines knowledge gaps and defines a research agenda to better understand species-specific responses to fire regimes, spatio-temporal effects on biota and interactions of fire regimes with other processes.
Naveh, Z. in The Role of Fire in Mediterranean-type Ecosystems (eds Moreno, J. & Oechel, W.) 163–185 (Springer, 1994).
Book Google Scholar
Noss, R. F., Franklin, J. F., Baker, W. L., Schoennagel, T. & Moyle, P. B. Managing fire-prone forests in the western United States. Front. Ecol. Environ. 4 , 481–487 (2006). This article discusses the science underpinning the development and implementation of fire and fuel management policies for forests before, during and after wildfires.
van Wilgen, B. W., Cowling, R. M. & Burgers, C. J. Valuation of ecosystem services. Bioscience 46 , 184–189 (1996).
Gill, A. M., Stephens, S. L. & Cary, G. J. The worldwide “wildfire” problem. Ecol. Appl. 23 , 438–454 (2013). This article provides an overview of fire effects on various environmental, social and economic assets, highlighting the complex and geographically specific context of the problem.
Article PubMed Google Scholar
Fernandes, P. M. Fire-smart management of forest landscapes in the Mediterranean basin under global change. Landsc. Urban Plan. 110 , 175–182 (2013).
Forests and Rangelands. The National Strategy: The Final Phase in the Development of the National Cohesive Wildland Fire Management Strategy http://www.forestsandrangelands.gov/strategy (US Forests and Rangelands, 2014).
FAO. Fire Management: Voluntary Guidelines. Principles and Strategic Actions http://www.fao.org/forestry/site/35853/en (FAO, 2006).
Forest Fire Management Group. National Bushfire Management — Policy Statement for Forests and Rangelands (Forest Fire Management Group for the Council of Australian Governments, 2012).
Myers, R. L. Living with Fire-Sustaning Ecosystems and Livehoods Through Integrated Fire Management (The Nature Conservancy Global Fire Initiative, 2006).
Google Scholar
Moritz, M. A. et al. Climate change and disruptions to global fire activity. Ecosphere 3 , 49 (2012). This article provides projections of future fire activity under climate change scenarios and examines sources of uncertainty in such predictions.
Berkes, F. & Folke, C. in Linking Social and Ecological Systems: Management Practices and Social Mechanisms for Building Resilience (eds Berkes, F. & Folke, C.) 13–20 (Cambridge Univ. Press, 1998).
Chapin, F. S. et al. Policy strategies to address sustainability of Alaskan boreal forests in response to a directionally changing climate. Proc. Natl Acad. Sci. USA 103 , 16637–16643 (2006).
Article CAS ADS PubMed PubMed Central Google Scholar
Chapin, F. S. et al. Increasing wildfire in Alaska's boreal forest: pathways to potential solutions of a wicked problem. Bioscience 58 , 531–540 (2008).
Jakes, P. J. & Langer, E. R. L. The adaptive capacity of New Zealand communities to wildfire. Int. J. Wildland Fire 21 , 764–772 (2012).
Paveglio, T. B., Jakes, P. J., Carroll, M. S. & Williams, D. R. Understanding social complexity within the wildland–urban interface: a new species of human habitation? Environ. Mgmt 43 , 1085–1095 (2009).
Gill, A. M. Landscape fires as social disasters: an overview of 'the bushfire problem'. Environ. Hazards 6 , 65–80 (2005).
Bradstock, R. A., Gill, A. M. & Williams, R. J. in Flammable Australia: Fire Regimes, Biodiversity and Ecosystems in a Changing World (eds Bradstock, R. A., Gill, A. M. & Williams, R. J.) 307–324 (CSIRO Publishing, 2012).
Scheffer, M., Carpenter, S., Foley, J. A., Folke, C. & Walker, B. Catastrophic shifts in ecosystems. Nature 413 , 591–596 (2001).
Article CAS ADS PubMed Google Scholar
Mazzoleni, S., di Pasquale, G., Mulligan, M., di Martino, P. & Rego, F. Recent Dynamics of the Mediterranean Vegetation and Landscape (Wiley, 2004).
Trabaud, L. V., Christensen, N. L. & Gill, A. M. in Fire in the Environment: the Ecological, Atmospheric, and Climatic Importance of Vegetation Fires (eds Crutzen, P. J. & Goldammer, J. G.) 277–295 (Wiley, 1993).
Moreira, F. et al. Landscape-wildfire interactions in southern Europe: implications for landscape management. J. Environ. Manage. 92 , 2389–2402 (2011).
Pausas, J. G. & Fernández-Muñoz, S. Fire regime changes in the Western Mediterranean Basin: from fuel-limited to drought-driven fire regime. Clim. Change 110 , 215–226 (2012).
Article ADS Google Scholar
San-Miguel-Ayanz, J., Moreno, J. M. & Camia, A. Analysis of large fires in European Mediterranean landscapes: lessons learned and perspectives. For. Ecol. Manage. 294 , 11–22 (2013).
Silva, J. S., Rego, F., Fernandes, P. & Rigolot, E. Towards Integrated Fire Management: Outcomes of the European Project Fire Paradox (European Forest Institute, 2010).
Castellnou, M., Kraus, D. & Miralles, M. in Best Practices of Fire Use: Prescribed Burning and Suppression: Fire Programmes in Selected Case-study Regions in Europe (eds Montiel, C. & Kraus, D. T.) 3–16 (European Forest Institute, 2010).
Koutsias, N. et al. Where did the fires burn in Peloponnisos, Greece the summer of 2007? Evidence for a synergy of fuel and weather. Agric. For. Meteorol. 156 , 41–53 (2012).
Swetnam, T. W., Allen, C. D. & Bentacourt, J. L. Applied historical ecology: using the past to manage for the future. Ecol. Appl. 9 , 1189–1206 (1999).
Grissino-Mayer, H. D. & Fritts, H. C. The International Tree-Ring Data Bank: an enhanced global database serving the global scientific community. Holocene 7 , 235–238 (1997).
Hessburg, P. F., Salter, R. B. & James, K. M. Re-examining fire severity relations in pre-management era mixed conifer forests: inferences from landscape patterns of forest structure. Landscape Ecol. 22 , 5–24 (2007).
Allen, C. D. et al. Ecological restoration of southwest ponderosa pine ecosystems: a broad perspective. Ecol. Appl. 12 , 1418–1433 (2002).
Keeley, J. E. et al. Ecological Foundations for Fire Management in North American Forest and Shrubland Ecosystems (US Department of Agriculture, Forest Service, Pacific Northwest Research Station, 2009).
Perry, D. A. et al. The ecology of mixed severity fire regimes in Washington, Oregon, and Northern California. For. Ecol. Manage. 262 , 703–717 (2011).
Schoennagel, T. & Nelson, C. R. Restoration relevance of recent National Fire Plan treatments in forests of the western United States. Front. Ecol. Environ. 9 , 271–277 (2011).
Turner, M. G. & Romme, W. H. Landscape dynamics in crown fire ecosystems. Landscape Ecol. 9 , 59–77 (1994).
Dillon, G.K. et al. Both topography and climate affected forest and woodland burn severity in two regions of the western US, 1984 to 2006. Ecosphere 2 , 130 (2011).
Schoennagel, T., Veblen, T. T. & Romme, W. H. The interaction of fire, fuels, and climate across rocky mountain forests. Bioscience 54 , 661–676 (2004).
Agee, J. K. & Skinner, C. N. Basic principles of forest fuel reduction treatments. For. Ecol. Manage. 211 , 83–96 (2005).
Stephens, S. L. et al. The effects of forest fuel-reduction treatments in the United States. Bioscience 62 , 549–560 (2012).
Odion, D. C. et al. Examining historical and current mixed-severity fire regimes in ponderosa pine and mixed-conifer forests of western North America. PLoS ONE 9 , e87852 (2014).
Article ADS PubMed PubMed Central CAS Google Scholar
Fuhlendorf, S. D., Woodward, A. J., Leslie, D. M. & Shackford, J. S. Multi-scale effects of habitat loss and fragmentation on lesser prairie-chicken populations of the US Southern Great Plains. Landscape Ecol. 17 , 617–628 (2002).
Van Auken, O. W. Causes and consequences of woody plant encroachment into western North American grasslands. J. Environ. Manage. 90 , 2931–2942 (2009).
Article CAS PubMed Google Scholar
Moritz, M. A., Moody, T. J., Krawchuk, M. A., Hughes, M. & Hall, A. Spatial variation in extreme winds predicts large wildfire locations in chaparral ecosystems. Geophys. Res. Lett. http://dx.doi.org/10.1029/2009GL041735 (2010).
Moritz, M. A., Keeley, J. E., Johnson, E. A. & Schaffner, A. A. Testing a basic assumption of shrubland fire management: how important is fuel age? Front. Ecol. Environ. 2 , 67–72 (2004).
Syphard, A. D., Keeley, J. E. & Brennan, T. J. Comparing the role of fuel breaks across southern California national forests. For. Ecol. Manage. 261 , 2038–2048 (2011).
Zedler, P. H., Gautier, C. R. & McMaster, G. S. Vegetation change in response to extreme events: the effect of a short interval between fires in California chaparral and coastal scrub. Ecology 64 , 809–818 (1983).
Balch, J. K., Bradley, B. A., D'Antonio, C. M. & Gómez-Dans, J. Introduced annual grass increases regional fire activity across the arid western USA (1980–2009). Glob. Change Biol. 19 , 173–183 (2013).
D'Antonio, C. M. & Vitousek, P. M. Biological invasions by exotic grasses, the grass/fire cycle, and global change. Annu. Rev. Ecol. Syst. 23 , 63–87 (1992).
Brooks, M. L. et al. Effects of invasive alien plants on fire regimes. Bioscience 54 , 677–688 (2004).
Murphy, B. P. et al. Fire regimes of Australia: a pyrogeographic model system. J. Biogeogr. 40 , 1048–1058 (2013).
Russell-Smith, J. et al. Bushfires 'down under': patterns and implications of contemporary Australian landscape burning. Int. J. Wildland Fire 16 , 361–377 (2007).
Bradstock, R. A. A biogeographic model of fire regimes in Australia: current and future implications. Glob. Ecol. Biogeogr. 19 , 145–158 (2010).
Mooney, S. D., Harrison, S. P., Bartlein, P. & Stevenson, J. in Flammable Australia: Fire Regimes, Biodiversity and Ecosystems in a Changing World (eds Bradstock, R. A., Gill, A. M. & Williams, R. J.) 293–305 (CSIRO, 2012).
Cook, G. D., Jackson, S. & Williams, R. J. in Flammable Australia: Fire Regimes, Biodiversity and Ecosystems in a Changing World (eds Bradstock, R. A., Gill, A. M. & Williams, R. J.) 293–305 (CSIRO, 2012).
Attiwill, P. M. et al. Timber harvesting does not increase fire risk and severity in wet eucalypt forests of southern Australia. Conserv. Lett. 7 , 341–354 (2013).
Price, O. F. & Bradstock, R. A. The efficacy of fuel treatment in mitigating property loss during wildfires: insights from analysis of the severity of the catastrophic fires in 2009 in Victoria, Australia. J. Environ. Manage. 113 , 146–157 (2012).
Penman, T. D. et al. Prescribed burning: how can it work to conserve the things we value? Int. J. Wildland Fire 20 , 721–733 (2011).
Nimmo, D. G., Kelly, L. T., Farnsworth, L. M., Watson, S. J. & Bennett, A. F. Why do some species have geographically varying responses to fire history? Ecography 37 , 805–813 (2014).
Pausas, J. G. & Bradstock, R. A. Fire persistence traits of plants along a productivity and disturbance gradient in mediterranean shrublands of south-east Australia. Glob. Ecol. Biogeogr. 16 , 330–340 (2007).
Krawchuk, M. A. & Moritz, M. A. Constraints on global fire activity vary across a resource gradient. Ecology 92 , 121–132 (2011).
Dunlop, M. et al. The Implications of Climate Change for Biodiversity Conservation and the National Reserve System: Final Synthesis (CSIRO Climate Adaptation Flagship, 2012).
Millar, C. I., Stephenson, N. L. & Stephens, S. L. Climate change and forests of the future: managing in the face of uncertainty. Ecol. Appl. 17 , 2145–2151 (2007).
Moritz, M. A., Hurteau, M. D., Suding, K. N. & D'Antonio, C. M. Bounded ranges of variation as a framework for future conservation and fire management. Ann. NY Acad. Sci. 1286 , 92–107 (2013).
Article ADS PubMed Google Scholar
Hannah, L. et al. Fine-grain modeling of species' response to climate change: holdouts, stepping-stones, and microrefugia. Trends Ecol. Evol. 290 , 390–397 (2014).
Moritz, M. A., Hessburg, P. F. & Povak, N. A. in The Landscape Ecology of Fire (eds McKenzie, D., Miller, C., & Falk, D.) 51–86 (Springer, 2011).
Parr, C. L. & Andersen, A. N. Patch mosaic burning for biodiversity conservation: a critique of the pyrodiversity paradigm. Conserv. Biol. 20 , 1610–1619 (2006).
Mcdonald, R. I. et al. Urban effects, distance, and protected areas in an urbanizing world. Landsc. Urban Plan. 93 , 63–75 (2009).
Theobald, D. M. & Romme, W. H. Expansion of the US wildland-urban interface. Landsc. Urban Plan. 83 , 340–354 (2007).
Schoennagel, T., Nelson, C. R., Theobald, D. M., Carnwath, G. C. & Chapman, T. B. Implementation of National Fire Plan treatments near the wildland–urban interface in the western United States. Proc. Natl Acad. Sci. USA 106 , 10706–10711 (2009).
Gude, P., Rasker, R. & van den Noort, J. Potential for future development on fire-prone lands. J. For. 106 , 198–205 (2008).
Galiana-Martin, L., Herrero, G. & Solana, J. A wildland–urban interface typology for forest fire risk management in Mediterranean areas. Landscape Res. 36 , 151–171 (2011).
Lampin-Maillet, C. et al. Mapping wildland-urban interfaces at large scales integrating housing density and vegetation aggregation for fire prevention in the South of France. J. Environ. Manage. 91 , 732–741 (2010).
Lowell, K. et al. Assessing the capabilities of geospatial data to map built structures and evaluate their bushfire threat. Int. J. Wildland Fire 18 , 1010–1020 (2009).
Bar-Massada, A., Radeloff, V. C. & Stewart, S. I. Biotic and abiotic effects of human settlements in the wildland–urban interface. Bioscience 64 , 429–437 (2014).
Calkin, D. E., Cohen, J. D., Finney, M. A. & Thompson, M. P. How risk management can prevent future wildfire disasters in the wildland-urban interface. Proc. Natl Acad. Sci. USA 111 , 746–751 (2014).
McCaffrey, S., Toman, E., Stidham, M. & Shindler, B. Social science research related to wildfire management: an overview of recent findings and future research needs. Int. J. Wildland Fire 22 , 15–24 (2013).
Article CAS Google Scholar
Handmer, J. & Tibbits, A. Is staying at home the safest option during bushfires? Historical evidence for an Australian approach. Glob. Environ. Change B 6 , 81–91 (2005). This article discusses the historical basis for Australia's 'prepare, stay and defend, or leave early' policy approach to wildfire.
Toman, E., Stidham, M., McCaffrey, S. & Shindler, B. Social Science at the Wildland-Urban Interface: a Compendium of Research Results to Create Fire-Adapted Communities (US Department of Agriculture, 2013).
Whittaker, J. & Handmer, J. Community bushfire safety: a review of post-black Saturday research. Aus. J. Emerg. Mgmt 25 , 7–13 (2010).
Olsen, C. S. & Sharp, E. Building community–agency trust in fire-affected communities in Australia and the United States. Int. J. Wildland Fire 22 , 822–831 (2013).
McCaffrey, S. M. & Olsen, C. S. Research Perspectives on the Public and Fire Management: a Synthesis of Current Social Science on Eight Essential Questions (US Department of Agriculture, 2012).
Whittaker, J., Haynes, K., Handmer, J. & McLennan, J. Community safety during the 2009 Australian Black Saturday bushfires: an analysis of household preparedness and response. Int. J. Wildland Fire 22 , 841–849 (2013).
Viegas, D. X., Ribeiro, L., Viegas, M., Pita, L. & Rossa, C. in Earth Observation of Wildland Fires in Mediterranean Ecosystems (ed. Chuvieco, E.) 97–109 (Springer, 2009).
Cova, T. J., Theobald, D. M., Norman, J. B. & Siebeneck, L. K. Mapping wildfire evacuation vulnerability in the western US: the limits of infrastructure. GeoJournal 78 , 273–285 (2013).
Penman, T. D. et al. Defining adequate means of residents to prepare property for protection from wildfire. Int. J. Disaster Risk Reduction 6 , 67–77 (2013). This article discusses the different aspects of what people need to understand to live safely in a fire-prone environment, including the possibility of having to stay and defend a home during a wildfire situation.
Blanchi, R. & Leonard, J. in Community Bushfire Safety (eds Handmer, J. & Haynes, K.) 77–85 (CSIRO Publishing, 2008).
Cohen, J. Preventing disaster — home ignitability in the wildland-urban interface. J. For. 98 , 15–21 (2000).
Manzello, S. L., Park, S.-H. & Cleary, T. G. Investigation on the ability of glowing firebrands deposited within crevices to ignite common building materials. Fire Saf. J. 44 , 894–900 (2009).
Leonard, J. et al. Building and Land-use Planning Research After the 7th February Victorian Bushfires: Preliminary Findings (CSIRO and Bushfire CRC, 2009).
Foote, E. I. D., Martin, R. E. & Gilless, J. K. in Proc. 11th Conf. Fire Forest Meteorology (eds Andrews, P.L. & Potts, D.F.) 16–19 (Society of American Foresters, 1991).
Gibbons, P. et al. Land management practices associated with house loss in wildfires. PLoS ONE 7 , e29212 (2012). This article presents an analyses of factors leading to residential home losses in the 2009 Black Saturday fires in Australia.
Syphard, A. D., Brennan, T. J. & Keeley, J. E. The role of defensible space for residential structure protection during wildfires. Inter. J. Wildland Fire http://dx.doi.org/10.1071/wf13158 (2014).
Franklin, S. E. California's catastrophic intermix fires causes, culprits and cures. Am. Fire J. 40 , 20–23 (1996).
Cohen, J. D. Relating flame radiation to home ignition using modeling and experimental crown fires. Can. J. For. Res. 34 , 1616–1626 (2004).
Stockmann, K., Burchfield, J., Calkin, D. & Venn, T. Guiding preventative wildland fire mitigation policy and decisions with an economic modeling system. For. Policy Econ. 12 , 147–154 (2010).
Syphard, A. D., Keeley, J. E., Massada, A. B., Brennan, T. J. & Radeloff, V. C. Housing arrangement and location determine the likelihood of housing loss due to wildfire. PLoS ONE 7 , e33954–e33954 (2012). This article presents an analysis of factors leading to residential home losses in fire-prone southern California.
Bovio, G. & Camia, A. Land zoning based on fire history. Int. J. Wildland Fire 7 , 249–258 (1997).
Buxton, M., Haynes, R., Mercer, D. & Butt, A. Vulnerability to bushfire risk at Melbourne's urban fringe: the failure of regulatory land use planning. Geogr. Res. 49 , 1–12 (2011).
Burby, R. J. Hurricane Katrina and the paradoxes of government disaster policy: bringing about wise governmental decisions for hazardous areas. Ann. Am. Acad. Pol. Soc. Sci. 604 , 171–191 (2006).
Cruz, M. G. & Alexander, M. E. Assessing crown fire potential in coniferous forests of western North America: a critique of current approaches and recent simulation studies. Int. J. Wildland Fire 19 , 377–398 (2010).
Rhodes, J. J. & Baker, W. L. Fire probability, fuel treatment effectiveness and ecological tradeoffs in western U.S. public forests. Open Forest Sci . J. 1 , 1–7 (2008).
Download references
Acknowledgements
We would like to thank V. Butsic, S. Cole Moritz, C. English and K. McLeod for comments on drafts of the manuscript, as well as P. Morgan for suggestions that greatly improved the final version. Some of this work was conducted while M.A.M. was a Center Fellow at the National Center for Ecological Analysis and Synthesis, a Center funded by NSF (Grant #EF-0553768), the University of California, Santa Barbara, and the State of California.
Author information
Enric Batllori
Present address: Present address: Forest Sciences Center of Catalonia & Center for Ecological Research and Forestry Applications, Pujada del Seminari, 28250 Solsona, Spain.,
Authors and Affiliations
Department of Environmental Science, Division of Ecosystem Sciences, Policy, and Management, University of California, Berkeley, 130 Mulford Hall, Berkeley, 94720, California, USA
Max A. Moritz & Enric Batllori
University of Wollongong, Northfields Avenue, Wollongong, 2522, New South Wales, Australia
Ross A. Bradstock
Australian National University, Canberra, 0200, Australian Capital Territory, Australia
A. Malcolm Gill
RMIT University, 124 Little La Trobe Street, Melbourne, 3000, Victoria, Australia
John Handmer
US Forest Service, 1400 Independence Avenue, 20250-1111, SW Washington DC, USA
Paul F. Hessburg & Sarah McCaffrey
CSIRO, Clayton South, 3169, Victoria, Australia
Justin Leonard
University of California, Santa Barbara, Santa Barbara, 93106, California, USA
Dennis C. Odion
University of Colorado, Boulder, Boulder, 80309-0450, Colorado, USA
Tania Schoennagel
Conservation Biology Institute, 136 SW Washington Avenue, Suite 202, Corvallis, 97333, Oregon, USA
Alexandra D. Syphard
You can also search for this author in PubMed Google Scholar
Corresponding author
Correspondence to Max A. Moritz .
Ethics declarations
Competing interests.
The authors declare no competing financial interests.
Additional information
Reprints and permissions information is available at www.nature.com/reprints .
Supplementary information
Supplementary information.
(DOCX 66 kb)
Rights and permissions
Reprints and permissions
About this article
Cite this article.
Moritz, M., Batllori, E., Bradstock, R. et al. Learning to coexist with wildfire. Nature 515 , 58–66 (2014). https://doi.org/10.1038/nature13946
Download citation
Received : 16 June 2014
Accepted : 15 September 2014
Published : 05 November 2014
Issue Date : 06 November 2014
DOI : https://doi.org/10.1038/nature13946
Share this article
Anyone you share the following link with will be able to read this content:
Sorry, a shareable link is not currently available for this article.
Provided by the Springer Nature SharedIt content-sharing initiative
This article is cited by
Guiding principles for transdisciplinary and transformative fire research.
- Kelsey Copes-Gerbitz
- Ira J. Sutherland
- Judith Burr
Fire Ecology (2024)
Governance drivers hinder and support a paradigm shift in wildfire risk management in Italy
- Judith A. Kirschner
- Davide Ascoli
- Georgios Boustras
Regional Environmental Change (2024)
Strategies and Barriers to Reconcile Pest Management with Insect Conservation in Temperate and Boreal Forests
- Elena Gazzea
- Andrea Battisti
- Lorenzo Marini
Current Forestry Reports (2024)
The geography of social vulnerability and wildfire occurrence (1984–2018) in the conterminous USA
- Ronald L. Schumann
- Christopher T. Emrich
- Sanam K. Aksha
Natural Hazards (2024)
Assessing changes in global fire regimes
- Sayedeh Sara Sayedi
- Benjamin W. Abbott
- Anne-Laure Daniau
By submitting a comment you agree to abide by our Terms and Community Guidelines . If you find something abusive or that does not comply with our terms or guidelines please flag it as inappropriate.
Quick links
- Explore articles by subject
- Guide to authors
- Editorial policies
Sign up for the Nature Briefing: Anthropocene newsletter — what matters in anthropocene research, free to your inbox weekly.

- 0 Shopping Cart
Geography Case Studies
All of our geography case studies in one place
Coastal Erosion
Use the images below to find out more about each case study.
The Holderness Coast

The Dorset Coast
Happisburgh
Coastal Management
Sandscaping at Bacton, Norfolk
Coastal Realignment Donna Nook
Coastal Realignment Medmerry
Coastal Deposition
Spurn Point
Blakeney Point Spit
Earthquakes
Amatrice Earthquake Case Study
Chile Earthquake 2010
Christchurch Earthquake
Haiti Earthquake
Japan Earthquake 2011
L’Aquila Earthquake
Lombok Indonesia Earthquake 2018
Nepal Earthquake 2015
Sulawesi, Indonesia Earthquake and Tsunami 2018
Taiwan (Hualien) Earthquake 2024
New Zealand 2016
Malaysia Causes of Deforestation
Malaysia Impacts of Deforestation
Alaska Case Study
Epping Forest Case Study
Sahara Desert Case Study
Svalbard Case Study
Thar Desert Case Study
Western Desert Case Study
Energy Resources
Chambamontera Micro-hydro Scheme
Extreme Weather in the UK
Beast from the East Case Study
Storm Ciera Case Study
Food Resources
Almería, Spain: a large-scale agricultural development
The Indus Basin Irrigation System: a large-scale agricultural development
Sustainable food supplies in a LIC – Bangladesh
Sustainable food supplies in a LIC – Makueni, Kenya
Landforms on the River Tees
Landforms on the River Severn
Indus River Basin (CIE)
River Flooding
Jubilee River Flood Management Scheme
Banbury Flood Management Scheme
Boscastle Floods
Kerala Flood 2018
Wainfleet Floods 2019
The Somerset Levels Flood Case Study
UK Floods Case Study November 2019
River Management
The Three Gorges Dam
Mekong River
The Changing Economic World
How can the growth of tourism reduce the development gap? Jamaica Case Study
How can the growth of tourism reduce the development gap? Tunisia Case Study
India Case Study of Development
Nigeria – A NEE
Torr Quarry
Nissan Sunderland
The London Sustainable Industries Park (London SIP)
Tropical Storms
Beast from the East
Hurricane Andrew
Cyclone Eline
Cyclone Idai Case Study
Typhoon Haiyan 2013
Hurricane Irma 2017
Typhoon Jebi 2018
Hurricane Florence 2018
Typhoon Mangkhut 2018
Urban Issues
Birmingham – Edexcel B
Urban Growth in Brazil – Rio de Janeiro
Urban Growth in India – Mumbai
Urban Growth in Nigeria – Lagos
London – A Case Study of a UK City
Inner City Redevelopment – London Docklands
Sustainable Urban Living – Freiburg
Sustainable Urban Living – East Village
Sustainable Urban Transport Bristol Case Study
Bristol – A major UK city
Volcanic Eruptions
Eyjafjallajokull – 2010
Mount Merapi – 2010
Mount Pinatubo – 1991
Sakurajima Case Study
Nyiragongo Case Study
Water Resources
Hitosa, Ethiopia – A local water supply scheme in an LIC
The South-North Water Transfer Project, China
Wakal River Basin Project
Lesotho Large-Scale Water Transfer Scheme
Share this:
- Click to share on Twitter (Opens in new window)
- Click to share on Facebook (Opens in new window)
- Click to share on Pinterest (Opens in new window)
- Click to email a link to a friend (Opens in new window)
- Click to share on WhatsApp (Opens in new window)
- Click to print (Opens in new window)
Please Support Internet Geography
If you've found the resources on this site useful please consider making a secure donation via PayPal to support the development of the site. The site is self-funded and your support is really appreciated.
Search Internet Geography
Top posts and pages.
Latest Blog Entries
Pin It on Pinterest
- Click to share
- Print Friendly
IMAGES
VIDEO
COMMENTS
Tragically, 85 people lost their lives in the fire, making it the deadliest wildfire in U.S. history in the past 100 years. Pulga (★) is a rural community in Butte County, California. It is located along the west slope of the Feather River canyon, at an elevation of 1,398 feet. The distance from Pulga (★) to Paradise ( ) is about 12 miles ...
The Camp Fire, California's most destructive wildfire in history, burned in Butte County from November 8 through November 25, 2018, claiming at least 86 lives and causing an estimated $16.5 billion in damage. It burned more than 18,000 buildings, including the majority of the town of Paradise.
Case Study - Black Summer Bushfires, Australia Background. The 2019-20 bushfire season began in September 2019 and ended in March 2020; It was one of most devastating wildfire seasons in Australian history; The fires burned over 20 million hectares of land and it is estimated that over 1 billion animals were killed
On a brisk November morning in 2018, a fire sparked in a remote stretch of canyon in Butte County, California, a region nestled against the western slopes of the Sierra Nevada mountains. Fueled by ...
Study area. We selected four case study landscapes that were extensively impacted during the 2019-2020 fire season: Casino (69,362 ha burnt), Gloucester (132, 281 ha), Blue Mountains (119,626 ha ...
Alberta wildfire case study. 1 the spatial and temporal setting of the event The Alberta wildfire started on the first of May 2016 and began at the southwest of Fort McMurray, Alberta, Canada. The wildfire spread across northern Alberta and into Saskatchewan and burnt 589,552 hectares (1,456,810 acres) in total.
Case study: wildfires. One of the major predictions made about climate change is that incidents of extreme weather will become more common. This can include weather events such as drought ...
The wildfire lasted for two months in Fort McMurray, Alberta, Canada, and it started to be under control by July 5th, 2016. The wildfire spread cross 590,000 hectares (1500,000 acres) from the edge of the southwest of Fort McMurray to the northern Alberta, and finally stopped in Saskatchewan, a province with prairie and boreal that bordering the west of Alberta. [3]
The Camp Fire in 2018 was one of the most damaging wildfires in US history and was the most damaging wildfire in California history. Such an event affords a chance to study and learn lessons that can hopefully be applied to similar hazards in the future. Using the Camp Fire as a case study, the research will follow a sort of PAR model format ...
Geospatial analysis of forest canopy damage in over half the area burned in the 2019-20 southeast Australian wildfires shows that spatial factors and weather determine burning severity much more ...
Some studies point to increases in the severity of the fire season (FS) 17 and the wildfire potential 18, and a gradual shift to a global fire regime dominated by temperature 19, rather than ...
Andersen LM, Sugg MM (2019) Geographic multi-criteria evaluation and validation: a case study of wildfire vulnerability in Western North Carolina, USA following the 2016 wildfires. Int J Disaster Risk Reduct 39:101123. ... The geography of social vulnerability and wildfire occurrence (1984-2018) in the conterminous USA. Nat Hazards 120, 4297 ...
Wild re Case Studies 2013 Yarnell Hill Fire v Arizona 2013 Black Forest Fire v Colorado 2013 Rim Fire v California. ii recent wildfire trends have shown us that wildfire risk is a real and immediate threat to many homes in the western u.s. the number of homes eposed to the risk and the
All landscapes are forested, have considerable Wildland Urban Interface (WUI), and have a history of both wildfire and prescribed fire. Case study landscapes were approximately 200,000 ha (Table (Table1), 1), intended to align with the upper limit of the size distribution of wildfires in local ecosystems (During the 2019-2020 fire season the ...
The study points to examples like the 2016 Gatlinburg fire in Tennessee, which, although less than a tenth of the size of the Camp Fire, destroyed nearly 2,500 structures and killed 14 people.
Give 5 key primary impacts to do with the California 2018 wildfire. 1. 97 civilians and six firefighters were killed in wildfires. 2. By the 9th of November, 10,321 structures had been destroyed by the fire. 3. 8527 total fires occurred over the duration of the wildfire period. 4.
available to support an in-depth case study of this devastating wildland-urban interface (WUI) fire to increase our understanding of WUI fire spread, fire behavior, evacuation, and structure response. The methodology guiding the case study and a detailed timeline reconstruction of the fire progression and fire behavior are presented. Over 2200
Case studies in rural communities of New Zealand 17 and California 18 also exist. Remarkably, a coupled wildfire SES framework has yet to be adopted for the more densely developed wildland-urban ...
Share this: Geography Case Studies - A wide selection of geography case studies to support you with GCSE Geography revision, homework and research.
the total population consists of... 90,000 residents, in a relatively remote area surrounded by forest -> low population density makes it more vulnerable. Wildfires are a natural event; meaning... we are unable to stop natural cycle. 90,000 evacuated/displaced, and 2,400... homes/structures burnt down- Jobs, livelihoods were restricted this way.
Australian wildfire case study wildfires, australia areas affected causes impacts responses more than million hectares of land were burned. regions across the. Skip to document. ... Drainage basins - Detailed notes for A-level Edexcel Geography. Multi Hazard Environment; Related Studylists
- Challenging to respond to as it couldn't be put out - Area was covered in flammable fuel (plants) - Joined with another fire - Fire service was not prepared as the don't deal with lots of fires, especially not on such a large scale - They would need multiple fire engines from multiple counties which is difficult to co-ordinate
How many people were injured? Marysville, Kinglake, Strathewen and Flowerdale. What 4 areas were completely destroyed? 8th. Where on the list of deadliest fires in history is this fire? AQA A-Level Geography - Black Saturday (Wildfire) Case Study.