- Writing Correction
- Online Prep Platform
- Online Course
- Speaking Assessment
- Ace The IELTS
- Target Band 7
- Practice Tests Downloads
- IELTS Success Formula
- Essays Band 9 IELTS Writing Task 2 samples – IELTS Band 9 essays
- Essays Band 8 IELTS Writing – samples of IELTS essays of Band 8
- Essays Band 7 IELTS Writing – samples of IELTS essays of Band 7
- Essays Band 6 IELTS Writing – samples of IELTS essays of Band 6
- Essays Band 5 IELTS Writing – samples of IELTS essays of Band 5
- Reports Band 9 IELTS Writing – samples of IELTS reports of Band 9 (Academic Writing Task 1)
- Reports Band 8 IELTS Writing – samples of IELTS reports of Band 8
- Reports Band 7 IELTS Writing – samples of IELTS reports of Band 7
- Letters Band 9 IELTS Writing Task 1 – samples of IELTS letters of Band 9
- Letters Band 8 IELTS Writing – samples of IELTS letters of Band 8
- Letters Band 7 IELTS Writing – samples of IELTS letters of Band 7
- Speaking Samples
- Tests Samples
- 2023, 2024 IELTS questions
- 2022 IELTS questions
- 2021 IELTS questions
- 2020 IELTS questions
- High Scorer’s Advice IELTS high achievers share their secrets
- IELTS Results Competition
- IELTS-Blog App

IELTS Report Samples of Band 9
- IELTS Reports- Band 9 , IELTS Writing Samples

Here you can find IELTS Report samples of Band 9, written by a native English speaker and a former IELTS examiner. Robert Nicholson is the co-author of ‘High Scorer’s Choice’ IELTS Practice Tests book series, created in collaboration with Simone Braverman, the founder of this website.
New reports are being added weekly. Last updated: September 15, 2022
IELTS Band 9 sample report 1
IELTS Band 9 sample report 2
IELTS Band 9 sample report 3

IELTS Band 9 sample report 4
IELTS Band 9 sample report 5
IELTS Band 9 sample report 6
IELTS Band 9 sample report 7
IELTS Band 9 sample report 8
IELTS Band 9 sample report 9
IELTS Band 9 sample report 10
IELTS Band 9 sample report 11
IELTS Band 9 sample report 12
IELTS Band 9 sample report 13
IELTS Band 9 sample report 14
IELTS Band 9 sample report 15
IELTS Band 9 sample report 16
IELTS Band 9 sample report 17
IELTS Band 9 sample report 18
Related posts:
- IELTS Essay Samples of Band 9 Last updated: May 3, 2023 Here you can find IELTS...
- IELTS Letter Samples of Band 9 Here you can find IELTS Letter samples of Band 9,...
- IELTS Report, topic: Pie charts of greenhouse gas emissions (from IELTS High Scorer’s Choice series, Academic Set 4) This is a model response to a Writing Task 1...
- IELTS Report, topic: Bar chart of average rainfall by month (from IELTS High Scorer’s Choice series, Academic Set 1) This is a model response to a Writing Task 1...
- IELTS Report, topic: Bar chart describing Scotland’s exports (from IELTS High Scorer’s Choice series, Academic Set 3) This is a model response to a Writing Task 1...
2 thoughts on “IELTS Report Samples of Band 9”
Thank you very much for all the writings that helps me a lot.
Leave a Reply
Your email address will not be published. Required fields are marked *
Save my name, email, and website in this browser for the next time I comment.
IELTS Academic Writing Task 1 Samples
Prepare for the IELTS Academic Test by using this collection of IELTS Academic Writing Task 1 practice samples. This collection is a great way to gain insight and practice for the exam.
the table below gives information on the gender,marital status and age of employees in the retail and manufacturing industries in one country.

The pie charts illustrate the percentage of energy generated from five different sources, namely Hydropower, Oil, Nuclear power, Coal, Natural gas, in a particular nation between 1983 and 2003.

The bar chart illustrates the proportion ogg leisure need’s expenditure in seven European countries, whereas the pie chart indicates the yearly budget of each family living in the UK for entertaining activities.

The chart shows information about the number of customers at three different restaurants during a five-day period

The pie charts below show the sources for UK tax revenue for last year and the total UK government spending for last year.

The chart shows information about the number of customers at three different restaurants during a five-day period. Summaries the information by selecting and reporting the key features and make comparisons where relevant.

The table and pie chart illustrate populations in Australia according to different nationalities and areas. Summarize the information by selecting and reporting the main features and make comparisons where relevant.

The chart below shows the different levels of post-school qualifications in Australia and the proportion of men and women who held them in 1999.

The charts below give information about the way in which water was used in different countries in 2000. Summarise the information by selecting and reporting the main features, and make comparisons where relevan

The graph below gives information about the preferred leisure activities of Australian children. Write a report for a university lecturer describing the information shown leisure activities of Australian children

The graph gives information about the consumption of fast food (in grams per week), in the UK from 1970 to 1990.

The diagram below shows how instant noodles are manufactured. Summarise the information by selecting and reporting the main features, and make comparisons where relevant.

The line graph compares the number of wildlife population per year from 2017 to 2022.

The provided diagram illustrates how bricks are produced for the building industry.

The graph shows the number of people taking part in 4 kinds of sports in a The Particular region between 1985 and 2005.

The chart shows the number of shops that closed and the number of new shops opening in a country from 2011 to 2018.

The maps show improvements that have been made to a university campus between 2006 and the present day. Summarise the information by selecting and reporting the main features and make comparisons where relevant.

The bar chart below shows the US top 10 processed food export markets for last year and six years ago.

The graph below shows the sales of children's books ,adult fiction and education books between 2002 and 2006 in one country.

The chart below shows the percentage of households in owned and rented accommodation in England and Wales between 1918 and 2011. Summarize the information by selecting and reporting the main features and make comparisons where relevant.

This line chart diagram depicts that the number of teenagers in UK follow habit of eating vegetables.

The graph below shows the spending on research into renewable sources of energy in four countries between 1975 and 2000. Summarise the information by selecting and reporting the main features and make comparisons where relevant.

The chart below shows the number of households in the US by their annual income in 2007, 2011 and 2015.

The table below give information about sales of Fairtrade-labelled coffee in 1999 and 2004 in five European Countries. Summarise the information by selecting and reporting the main features, and make comparisons where relevant. Write at least 150 words.

The diagram below shows two different process of manufacturing black tea.

the chart below shows the number of households in the US by their annual inc9ome in 2007, 2011, and 2015. Summarise the information by selecting and reporting the main features, and make comparisons where relevant

The chart shows waste collection by a recycling centre from 2011 to 2015.

The chart below gives information about Southland’s main exports in 2000, *20…, and future projections for 2025.

the chart below shows the changes in three different areas of cime in manchester city center from 2003-2012.

The diagrams show the coastal village of Seaville in 1980 and 2010.

the charts below give information on the ages of the populations of yemen and italy in 2000 and projections for 2050. summarize the information and make comparison.

The chart and table below give information about tourists at a particular holiday resort in Australia. Summarise the information by selecting and reporting the main features, and make comparisons where relevant. You should write at lea

The diagrams below show the changes that have taken place at West Park Secondary School since its construction in 1950. Summarise the information by selecting and reporting the main features and make comparisons where relevant.write at least 150 words

The charts below give information about USA marriage and divorce rates between 1970 and 2000, and the marital status of adult Americans in two of the years.

The table below shows the results of a survey where first-year students were askedto rate some aspects of their courses.

The line graph illustrates the average number of UK worker traveling by three different transport from 1970 to 2030.

The bar chart below shows estimated world illiteracy rates by region and by gender for the last year.

The chart below shows the number of trips made by children in one country in 1990 and 2010 to travel to and from school using different modes of transport. Summarise the information by selecting and reporting the main features, and make comparisons where relevant.

Task 1: The two line graphs below show New Zealand import figures from Australia and Japan in the years 1994 - 2004. Summarise the information by selecting and reporting the main features, and make comparisons where relevant.

The chart below shows the number of households in the US by their annual income in 2007, 2011 and 2015. Summarize the information by selecting and reporting the main features.

The graph below shows the different modes of transport used to travel to and from work in one European city in 1960, 1980 and 2000. Write a report for a university lecturer describing the information below.

The maps below show the changes that occured to a town named Willington in 1780, 1860 and 2000.

The bar chart below shows the number of houses built per year in two cities, Derby and Nottingham, between 2000 and 2009

The pie charts show the amount of money that a Kazakh charity organization spent and received in 2019.

The pie chart shows a group of nutritional ingredients, namely carbohydrates, protein and fat in three different categories.

The charts show the main methodof transport of people travelling to one university in 2004 and 2009

9/2 The table below gives information about salaries of secondary/high school teachers in five countries in 2009.

You should spend about 20 minutes on this task. The graph shows Underground Station passenger numbers in London. Summarise the information by selecting and reporting the main features, and make comparisons where relevant. You should write at least 150 words.

The maps below show the city layout of Brisbane between 1975 and the current day. Summarise the information by selecting and reporting the main features, and make comparison where relevant.

The pie chart shows the amount of money that a children’s charity located in the USA spent and received in one year.

The maps below show the future plan about the Biology School in particular university. Summarize the information by selecting and reporting the main features, and make comparisons where relevant. (Map)

The maps illustrate remarkable transformations in the coastal village of Seaville over a 30-year period, starting from 1980.

The charts below show the average consumption of three nutrients by adults in the UK. All of these nutrients may be unhealthy if eaten too much.

The graph below gives information about the percentage of the population in four Asian countries living in cities from 1970 to 2020, with predictions for 2030 and 2040.

The bar chart below shows the percentage of unemployed graduates, aged 20-24, in one European country over a two-year period. Summarise the information by selecting and reporting the main features, and making comparisons where relevant

The bar chart below shows the percentage of unemployed graduates, aged 20-24, in one European country over a two-year period. Summarise the information by selecting and reporting the main features, and making comparisons where relevant.

You should spend about 20 minutes on this task. The chart below shows the percentage of households owning four types of electronic devices between 1995 and 2015. Summarise the information by selecting and report in the main features, and make comparisons where relevant. You should write at least 150 words.

The given pie charts shows the proportion of British students able yo use languages other than english. Summarise the information by selecting and reporting the main features and make comparisons where relevant. Write at least 150 words.

The pie charts below show the online shopping sales for retail sectors in New Zealand in 2003 and 2013. Summaries the information by selecting and reporting the main features, and ,are comparisons where relevant.

The bar graph represents the average monthly temperature in Lapland region in 2022. Analyze the fluctuations and identify any patterns or trends.

The graph below shows the percentage of Azerbaijan’s export to four countries from 1990 to 2012. Summarise the information by selecting and reporting the main features and make comparisons where relevant.

The bar chart below shows the average duration of housework women did (unemployed, part-time employed and full-time) when compared to men who had full-time work in the UK between 1985 and 2005. Summarise the information by selecting and reporting the main features, and make comparisons where relevant.

The line graph shows the number of books that were borrowed in four different months in 2014 from four village libraries, and the pie chart shows the percentage of books, by type, that were borrowed over this time.

The line graph and pie chart below show information on crime in the UK for the last year. Summarise the information by selecting and reporting the main features, and make comparisons where relevant. You should write at least 150 words.

The chart below shows the annual water usage by different industries.

This line graph illustrates the number of tourists who visited Caribbean islands between 2010 and 2018, measured in millions

Task 1 : The pie charts below describe the electric energy production a major source of energy in the US. Write a short report for a university lecturer describing the information in the charts

The table below gives information about changes in modes of travel in England between 1985 and 2000. Average distances in miles per person per year, by mode of travel. Write 150 words.

The diagram below shows how electricity is generated in a hydroelectric power station. Summarise the information by selecting and reporting the main features, and make comparisons where relevant.

The map bellow show the chances that occurred to a town named Willington in 1780,1860 and 2000.

The table below gives information about a bakery's average sales in three different branched in 2015. Summarise the information by selecting and reporting the main features, and make comparisons where relevant.

The chart below shows the expenditure on three categories among different age groups of residents in the UK in 2004.

The pie charts and table give information about the total and sources of fish imported to the US between 1998 and 2000.

The graph below gives information about the percentage of population in four Asian countries living in cities from 1970 to 2020, with predictions for 2030 and 2040. Summarize the information by selecting and reporting the main features.

The diagram illustrates the various stages in the life of a honey bee.

The charts below show the percentage of monthly household income spent on various items by two different groups in one European country. Summarise the information by selecting and reporting the main features, and making comparisons where relevant.

The graph below gives information about international tourist arrivals in five countries.Summarise the information by selecting and reporting the main features, and make comparisons where relevant.

The Bar Chart Below Shows shares of Expenditures for five major categories in the United States, Canada, The United Kingdom, and Japan in the year 2009. Summarize the information by selecting and reporting the main features and make comparisons where relevant.

The table below gives information about changes in modes of travel in England between 1985 and 2000. You should spend about 20 minutes on this task. Describe the information in the table and make comparisons where appropriate. Write at least 150 words.

The given diagram clearly depicts the step-by-step process of carbonated drink production.

The table below gives information about population in Australia and Malaysia in 1980 and 2002. Summarise the information by selecting and reporting the main features, and make comparison where relevant.

The bar chart shows the number of volunteers in New Zealand who helped in sports organizations in 2010. The pie chart illustrates the number of volunteers doing different types of jobs for that same period. Summarize the information by selecting and reporting the main features, and make comparisons where relevant.

the bar diagram shows Expenditure of two countries france and uk on consumers goods in 2010.

The diagram illustrates main changes that have occurred at West Park Secondary School over a thirty-year period and its proposed development in 2010.

The graph below shows food consumption in Australia between 1950 and 2010. Summarise the information by selecting and reporting the main features, and make comparisons where relevant.

The pie charts show the average consumption of food in the world in 2008 compared to two countries; China and India. Write a report to a university lecturer describing the data.

the chart below shows the average age of men and women who retired from work in 7 countries in 2004 and 2008.

The diagrams below show two hostel rooms that can be occupied by several people. Summarise the information by selecting and reporting the main features, and make comparison where relevant.

- Unlimited Essay Checks: Practice and perfect your skills.
- Detailed Error Analysis: Spot every mistake.
- In-Built Grammar Checker: Say no to grammatical errors.
- Personalized Suggestions: Know how to boost your score.
- Progress Tracking: View your checked essay history.
- Still thinking? We have a 14-day money-back guarantee. Take a leap of faith!
IELTS Task 1 Band 9 – Writing sample
Ielts task 1 band 9.
Below is a sample IELTS Task 1 question and a model answer. The answer is estimated to get a Band 9 Score. Have a look at the answer first and then we can look at it in more detail.

source: IELTS Buddy
The table below shows the estimated oil capacity of six countries, in millions of barrels per day, from 1990 to 2010.
Summarise the information by selecting and reporting the main features, and make comparisons where relevant.
You should spend about 20 minutes on this task.
Write at least 150 Words.
Model Answer The bar chart illustrates the estimated amount of oil produced in 6 countries between 1990 and 2010, measured in millions of barrels per day. Overall, oil production capacity tended to increase during this 20-year period. The figures for Saudi Arabia were significantly higher than in the other countries, while production was lowest in Qatar. From 1990 to 2010, there was a significant increase in oil production in Saudi Arabia. In 1990, just over 8 million barrels per day were produced and this rose steadily, reaching a peak of over 14 million barrels per day in 2010. In contrast, the smallest producer was Qatar. Despite a slight increase in 2000, production in Qatar remained relatively stable at less than 1 million barrels per day. The other countries saw a slight rise in oil production over the period. The estimated figure for Iran in 1990 was over 3 million barrels per day, compared with around 2 million barrels in the other three countries. Although production did not increase in 2000 in the UAE, the amount of oil produced peaked in 2010 in Iran at over 4 million barrels and at almost 4 million barrels in Iraq, Kuwait and the UAE. (198 words)
IELTS Task 1 Band Score 9
Task achievement: 9, coherence & cohesion: 9, lexical resources: 9, overall score: band 9, paragraph 1.
The opening paragraph has all the key information about the graph but it paraphrases the question. This is very important. Make sure you use synonyms and rephrase your answer. For example, in this case:
“shows” to “illustrates”
“oil capacity” to “amount of oil”
“from 1990 to 2010” to “between 1990 and 2010”
Paragraph 2
This paragraph gives a clear overview of the chart. The overall trend is that the capacity increased, but there is a big difference between Saudi Arabia and Qatar. This paragraph demonstrates an excellent knowledge of the required grammar and vocabulary. “Tended to increase”; “20-year period” (and not 20-year s period); “significantly higher than”.
Paragraph 3
This paragraph goes into detail about the two most significant countries: Saudi Arabia and Qatar. It follows clearly from the previous paragraph which has highlighted these two countries. All the key vocabulary to describe movement in a graph is used correctly (“significant increase”; “rose steadily”; “reaching a peak”; “remained relatively stable”). There are two sentences about Saudi Arabia and then two about Qatar, correctly using the linking phrase “in contrast”. The paragraph is very well structured and cohesive, with no grammar mistakes and an excellent range of vocabulary.
Paragraph 4
Paragraph 4 gives details about the four remaining countries. Again, all the language for describing a graph is accurate – “saw a slight rise”, “peaked in 2010”. The prepositions are also used correctly (something students often mix up) – “a rise in production”, “ in 1990”, “compared with” , “peaked in 2010 in Iran at over 4 million barrels”
This answer displays everything needed for a Band 9 answer on IELTS Task 1. The answer is clear and well-structured with a skilful use of paragraphs and links. There is a wide range of very natural vocabulary needed to describe a graph and there are no spelling mistakes. There are no grammar mistakes in the answer and there is an excellent range of complex structures.
IELTS task one marking scheme:

You can prepare for the IELTS exam in Dublin in one of our IELTS preparation courses.
Share this:
- Click to share on Twitter (Opens in new window)
- Click to share on Facebook (Opens in new window)
Related Posts

IELTS Discuss both views… (Writing task 2)

Prepare for IELTS Task 1 (Process)

IELTS in Dublin with Everest Language School

IELTS Writing: Task 1 Pie Chart Question
Learn more about our english courses, start learning.
We will send you our brochure, prices and accommodation options, so that you can start planning your trip to learn English in Dublin with Everest!

- Skip to primary navigation
- Skip to main content
- Skip to primary sidebar
- Skip to footer
IELTS Advantage
IELTS Preparation Courses
IELTS Writing Task 1: Everything You Need to Know
Ielts writing task 1 in 6 simple steps.

Academic Writing Task 1 Strategy
- Understand how the test is marked. Knowing the marking criteria will allow you to give the examiner exactly what they need.
- Paraphrase the question. It is best to paraphrase the question in the first paragraph. You can do this by using synonyms.
- Write the overview. To write your overview , pick 3 or 4 of the main features and write about them generally without referencing any data.
- Support the main features. In a new paragraph, support the key features with the data in the information given to you.
- Check your work. Check your report for spelling and grammar mistakes. Make sure that the data you mentioned is also accurate!

Essential Writing Task 1 Skills
- How to Write an Overview Paragraph
- How to Paraphrase
- How to Write a Complex Sentence
- How Many Words?
- Task 1 Charts Checklist
- Task 1 Tips
- The Danger of Synonyms
- 6 Common Mistakes
- Paragraphing and Editing
Writing Task 1 Full Lessons
- Writing Academic Task 1 in 5 Easy Steps
- Charts Lesson
- Maps Lesson
- Multiple Charts/Graphs
- Process Lesson

Academic Task 1 Sample Answers

- Bar Chart Sample Essay (Cars in Asia)
- Process- Cement and Concrete Production
- Pie Chart (Italy and Yemen Populations)
- Process Question
- Bar Chart Question (UK Telephone Usage)
- Line Graph (US Consumption of Energy)
- Bar Chart Sample Answer (International Students)
General Training Writing Task 1

General Training Writing Task 1 in 5 Simple Steps
- Understand how the test is marked. Knowing the marking criteria is the best way of giving the examiner exactly what they need and nothing else.
- Decide whether the letter is formal or informal. This part is easy. If the question asks you to write to a ‘friend’, it should be an informal letter. If the question asks you to write to anyone else, it should be a formal letter. It is that simple!
- Discuss each bullet point from the question. Make sure to take a new paragraph for each bullet point. This will make your letter easy to read and understand.
- Sign off your letter. Don’t overcomplicate this part. Include a sign-off suitable to your letter’s tone and write your name beneath.
- Check your work. Make sure your letter doesn’t contain any grammar or vocabulary mistakes.
- Letter Writing Tips
- How to Write an Informal Letter
- How to Write a Formal Letter
General Training Essential Writing Task 1 Skills
- Task 1 General Training Writing Strategy
- Task 1 General Training Writing Guide
Sample Answers
- Formal and informal sample letters.
Writing Task 1 Essential Information
- People doing the Academic test will write a report on a data set, map, or process. People doing General Training will write a letter.
- You must write 150 words or more.
- You should spend around 20 minutes on this part of the test.
- Task 1 is worth 1/3 of your total mark on the Writing test.
- You will be assessed in four areas: Task Achievement (25%) Coherence and Cohesion (25%) Lexical Resource (25%) Grammatical Range and Accuracy (25%)
- The most important thing is that you can demonstrate that you can clearly communicate in English.
- The key to doing well is to know exactly what the examiners want and give it to them.
- Grammar and Vocabulary Guide

- Top 10 Grammar Mistakes
IELTS Writing Task 1 FAQs
How can i improve my writing.
You will find all the resources you need on our Writing Task 1 page. Click the link below:
Writing Task 1
If you need serious help or personalised feedback, you should check out our online course. There is a waiting list, but you can add your name here:
How can I get a Band 7, 8 or 9?
The answer to this question is different for every individual IELTS student, as it depends on a number of factors, including your work ethic, English skills and exam strategy. You'll find a guide to answering this question in this article
If you need serious help with improving your IELTS scores, you should check out our online writing course. There is a waiting list, but you can add your name by clicking the link below:
Can you correct my writing?
Please click the link below and it will give you all the information you need about our writing correction service:
Writing Correction Service
Do you have any sample answers?
Yes, you will find them at the link below:
Task 1 Sample Answers
Will using 'high level' or 'academic' words help me improve my score?
Probably not.
Read my recent article about IELTS vocabulary here:
5 Things You Need to Know about IELTS Vocabulary
How many paragraphs should I write?
Introduction
You can put the overview at the end if you'd like.
Can I use idioms?
No, you should typically avoid using idioms in Writing Task 1.
The only time this is acceptable is if you are taking the General Training test and must write an informal letter.
Should I write a conclusion for Task 1 Academic?
No. A conclusion is a summary of YOUR ideas and your opinion. Task 1 is simply reporting what you see, so there shouldn't be any of your ideas or your opinion.
Instead of a conclusion, you should write an overview.
The reason lots of people get confused about this is that some teachers, books and even one British Council website call the overview a 'conclusion'. It's not a conclusion, it's an overview.
Finally, it does not matter where you put the overview paragraph. We teach our students to put it after the introduction, but it is also fine to have it as your final paragraph.
How many words should I write?
You must write at least 150 words in Writing Task 1 (yes, the examiners will count them!)
I would suggest that you aim to write around 160-170 words for Task 1. Aiming for 20-30 words more than the required amount makes you more likely to reach the word limit without setting an unrealistic goal.
Will I lose marks if I don't write enough words?
Yes. If you don't write the required number of words, you will lose marks in 'Task Achievement' for not answering the question fully. Read more here .
Can I use contractions?
No, should not use contractions when you are writing an academic essay or formal letter. However, it is fine to use contractions in an informal letter.
When should I write formally?
There are a few signposts that indicate when you should write formally or informally. Watch our video lesson to find out what they are:
IELTS Writing Task 1 General Training: Formal or Informal Letters?
Press ESC to close

How to Get Band 9 in IELTS in Writing Task 1? An Ultimate Guide for Preparation
How to get band 9 in IELTS writing task 1? Many aspirants have this doubt in their minds but they don’t have the right plan. We are here discussing how to score band 9 in the IELTS writing task one and essay. Here we will provide a complete guide about the preparation, exam pattern and how to solve the questions in writing task 1. So, let’s begin!
IELTS Writing Task 1
IELTS writing task one constitutes thirty third of the full total of IELTS writing. The best example of that IELTS writing task one is estimated square criterion – Task performance, vocabulary, grammatical preciseness, coherence and cohesion. Whereas the IELTS writing task one deals with infographic-related questions, the IELTS general writing task one has a section of letter writing.
Each IELTS academic and general writing task has one rightful criterion marked on a record of zero – nine. For IELTS writing task one, aspirants ought to compose a summary on the analysis of chart, bar graph, line graph or chart.
The main purpose of the IELTS writing task 1 is to survey the understanding and logical skills of the aspirants who train up to check abroad. Now, institutes abroad have a substantial way of teaching that isn’t cliche. The examiners expect the aspirants to clearly analyse graphs, tables, diagrams, bars, flow charts, etc
Also Read: What is Linking Words? How to Use Linking Words in IELTS?
IELTS General Writing Task 1

How to Get Band 9 in IELTS in General Writing Task 1?
#Recognize the kind of letter you are being expected to compose – Formal, Semi-formal & Informal.
#Recognise the objective of the letter
#Open and finish off the letter correctly. Do this on the kind and objective of the letter
#Commence the letter suitably
#Learn and adopt characteristic written words.
#Spell normally used phrases correctly
#Segregate your letter into passages.
The letter has four paragraphs
-Introduction
-Problem / Situation
-Outcome / Solution
-Conclusion
# Use precise writing
#Compose at least 150 words
#Comprise all three bulleted facts
#Complete it in time
#Examine category letters but don’t get by heart them
#Comprehend the scoring norms.
Also Read: What Sort of Vocabulary should be Used for IELTS? Six Techniques to Improve Your IELTS Writing Vocabulary Easily
Types of Letters and How to Write Them?
Also Read: IELTS Writing Task 1 Academic Topics 2021: A Complete Guide to Writing Preparation
IELTS Academic Writing Task 1
How to get band 9 in ielts in academic writing task 1.
#Read the title
You are required to halt and concentrate on the formulation of the headline to make certain that you will note the evidence accurately and in the exact decree. Occasionally, exam takers hurry into composing only to comprehend that they had misunderstood the title.
#Decide what are the central captions that you want to compose roughly or summarize in that diagram, table or any distinct visual that you are associating, inferring, observing.
#Give yourself assertions why those are the extensively significant ones and assist them with digits from the visual.
#Aim to specify categories of data, results, minimums, maxima, and structures.
#Plan your paragraphing, make a degree of keeping an introduction, and at least two body passages.
#Write an enormous introduction.
#The first, initial passage should be only one statement. Here, memorize the WHAT-WHERE-WHEN logic, the opening should say WHAT the diagram illustrates, as reasonably as WHERE and WHEN the evidence is put.
#In the beginning you can also compose your statement, just in case you don’t have time near the stop.
Types of Illustrations for Academic Task 1
Here are some examples of how you have open and close your writing.
Also Read: IELTS Writing Task 1 Academic Topics 2021: Get Yourself into Practice Mode
IELTS Writing Task 1: Quick Tips
#Understand how the test is marked.
#Paraphrase the question.
#Write the overview.
#Support the main features.
#Check your work.
Hopefully, this article provided you with everything that you need to get a score because scoring a band 9 is a tough job and you should first be familiar with the test pattern and then the quick tips should be kept in mind while you are going for the examination because these tips are necessary and should be followed in sequence. If further any doubts please feel free to comment down in the comments section below.
Also Read: How to Write Flow Chart IELTS Writing Task 1? Things to Know about Task 1 Flow Chart

One Comment

Thank you for providing this article, it was fabulously written and also it was very helpful and gave every small detail, what do you guys think about it?
Leave a Reply Cancel reply

Share Article:
About the Author
Amiksha kantam.
Amiksha is a budding Content Writer. A young writer who has written over 250 poems and quotes and also an author of a famous Wattpad novel named “Ma and the Magical Kingdom” and always sets her goals high with her determination like the sky. Her mother is her inspiration and her family is her biggest support. She has her interest in writing, reading novels and craft. She has developed her hardworking and disciplined persona from her mother. She is very out going and loves travelling, trekking and hiking. She believes in the quote “Creativity lies in actions not experience
You might also like

Recent IELTS Writing Task 1 Exam Question: Letter Of Complaint To A Hotel

Recent IELTS Writing task 1 Exam Question: Bar Chart On Work Performance

Recent IELTS Writing Task 1 Exam Question – Map of a town
Other stories, what is computer delivered ielts know the merits and myths about ielts cbt, essay writing skills for ielts: how to write essay for writing task 2.
How Do You Score in IELTS Academic Writing Task 1 Band 9?

If you’re taking the IELTS, it’s likely that you want to get a top score on both writing tasks. So just what does it take to move up in writing band descriptors and get IELTS Writing Task 1 Academic band 9? In other words, how do you get a perfect score in the graph writing task?
Overall, your IELTS Writing band scores are determined using an official rubric , marking your tasks from 0 (lowest) to 9 (highest) in four categories: Task Achievement; Coherence and Cohesion; Lexical Resource; and Grammatical Range and Accuracy. In this post, I’ll take a close look at each one and how to build your skills in each area. This, in turn, will lead you to a higher band score. So here it is: what you need to get a top score on Task 1!
Table of Contents
Task achievement, grammatical range and accuracy, lexical resource, coherence and cohesion, example ielts academic writing task 1 band 9 essay, final takeaways for ielts academic writing task 1 band 9, ielts academic writing task 1 scoring categories.
As you study for IELTS Writing Task 1, your goal should be to focus on making improvements that will have a significant impact on your score. To accomplish this, it helps to understand the four scoring categories for Academic Task 1 (graph writing).
Here are the resources that can help you maximize your IELTS Academic Writing Task 1 band 9 essay score in each of the categories!
This is a measurement of how well you fulfilled the basic requirements of the task, based on the instructions. In other words: are you doing what’s being asked, completely?
According to the official rubric, the criteria for Band 9 in this area are:

- Fully satisfies all the requirements of the task
- Clearly presents a fully developed response
Curious how to do this? Check out the IELTS Writing Task 1:Paragraph Structure post to see our recommended template!

This is a measurement of your ability to use a wide range of grammatical structures without making a lot of grammatical errors. If you have enough time (a few months or more) before you take the IELTS, consider taking an English class or investing in a good grammar book for self-study. I often recommend this grammar book to intermediate and advanced students. It offers clear grammar explanations and contains many practice exercises.
Just how important is this? Very! In fact, the only criteria for an IELTS Academic Writing Task 1 Band 9 essay score in this category is:
- Uses a wide range of structures with full flexibility and accuracy; rare minor errors occur only as ‘slips’
Click here for our full guide to grammmatical range and accuracy for IELTS Writing Task 1.
This is your ability to use a wide range of vocabulary correctly (without errors) and appropriately (in the proper context) in your written responses. It should go without saying that studying vocabulary regularly will help you improve most in this area. Magoosh has (free!) IELTS vocabulary flashcards to get you started. You should try to learn 15-20 new words each day!
This will help you meet the IELTS official criterion for this category:
- Uses a wide range of vocabulary with very natural and sophisticated control of lexical features; rare minor errors occur only as ‘slips’
What does this mean? Glad you asked! We have a full article on lexical resource for IELTS Academic Writing Task 1 .
Beyond reading that full guide learning new words, however, there are a few additional steps you can take to improve your “Lexical Resource” score.
First, check out Magoosh’s video guide to IELTS Task 1 for tips!
This a measurement of your ability to present ideas logically and clearly. In other words, the IELTS wants to see that your ideas make sense in the order you present them and that they work together in a logical way. One of the best things you can do to improve your “Coherence and Cohesion” score is to master useful transition words.
Here’s how the IELTS rubric describes the criteria for a Band 9 score in this area:
- Uses cohesion in such a way that it attracts no attention
- Skilfully manages paragraphing
To learn more about how to skillfully manage your paragraphs, check out our blog post all about coherence and cohesion for IELTS Academic Writing Task 1 .
Now that you’ve looked out for all this advice, check out Magoosh’s model band 9 essay . This essay comes with an answer explanation that explains how the writing meets IELTS Academic Writing Task 1 Band 9 standards.
For other model band 9 essays, check out:
- IELTS Academic Writing Task 1: Process Diagram with Model Answer
- IELTS Academic Writing Task 1: Map With Model Answer
- IELTS Academic Writing Task 1: Bar Chart with Model Answer
- IELTS Academic Writing Task 1: Pie Chart with Model Answer
- IELTS Academic Writing Task 1: Comparing two Graphics with Model Answer
Approaching the graph writing task can feel overwhelming at first. Luckily, though, the IELTS rubric is really clear about what it takes to get an IELTS Writing Task 1 academic band 9 score!
By staying on topic, developing your grammar skills, using a broad and precise vocabulary, and building coherence and cohesion, you’ll boost your IETLS Task 1 (graph writing) band score—and your English skills as well. And once you’ve mastered this task, don’t forget the biog picture: getting a top score ont he exam as a whole. To get started on that larger goal, check out our podcast episode “ What is a Good IELTS Band Score “? And from there you can go even bigger, and check out our complete guide to every aspect of IELTS Writing .

Eliot Friesen-Meyers is the Senior Curriculum Manager for Magoosh IELTS and TOEFL. He attended Goshen College (B.A.), New York University (M.A.), and Harvard University (M.T.S.), gaining experience and skills in curriculum development, ESOL instruction, online teaching and learning, and IELTS and TOEFL test prep education. Eliot’s teaching career started with Literacy Americorps in Pittsburgh, Pennsylvania, and later, taught ESL programs at Northeastern University, University of California-Irvine, and Harold Washington College. Eliot was also a speaker at the 2019 TESOL International Conference . With over 10 years of experience, he understands the challenges students face and loves helping them overcome those challenges. Come join Eliot on Youtube , Facebook , and Instagram . Recent blog posts Complete Guide to IELTS Writing Task 1 Complete Guide to IELTS Writing Task 2
View all posts
More from Magoosh

Leave a Reply Cancel reply
Your email address will not be published. Required fields are marked *
by Mohsen Keshmiri
- Search for:
IELTS Writing Task 1 Academic Sample (Maps), Band 9, Written by Dave Lang, Modified by Mohsen Keshmiri
The maps below show Pebbleton 20 years ago and today.
Summarise the information by selecting and reporting the main features, and make comparisons where relevant.
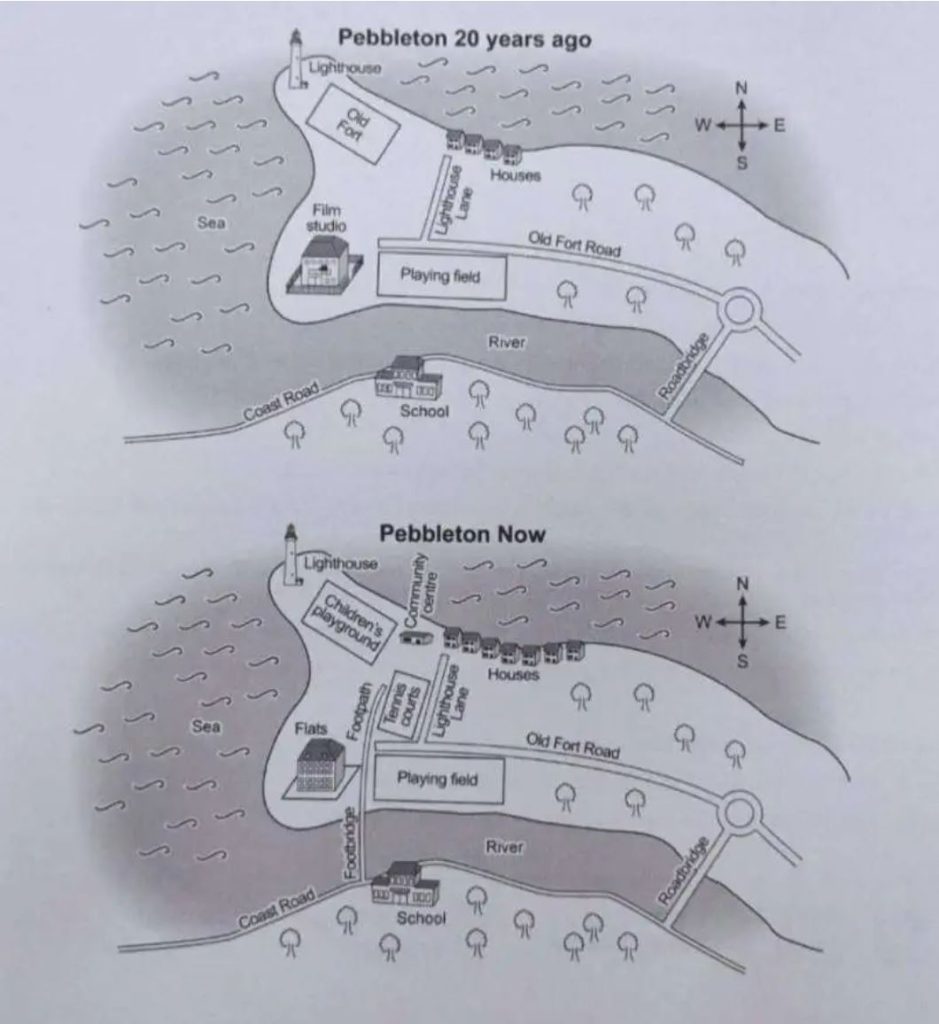
The two maps compare the town of Pebbleton 20 years in the past and in the present day. Looking from an overall perspective, it is readily apparent that the town has become more residential and offers more access for pedestrians.
The most noteworthy changes to the town relate to the expansion of housing. On the northern end of the narrow peninsula, adjacent to a new community centre, there are now additional houses and the old fort has been replaced with a children’s playground, though the lighthouse has remained unchanged. South of the community centre are new tennis courts that link with a footpath as well as Lighthouse Lane, and Footbridge that connects with the school along Coast Road on the other side of a small river.
The final change is that a former film studio on the southwestern tip of the peninsula is presently a block of flats. The areas that have remained the same are the main roads, a playing field on the southern shore alongside Old Fort Road, and most of the wooded space around the town.
1. The two maps compare the town of Pebbleton 20 years in the past and in the present day. 2. Looking from an overall perspective, it is readily apparent that the town has become more residential and offers more access for pedestrians.
- Paraphrase the overall essay topic.
- Write a general over for the map. Include the major changes and group them generally.
1. The most noteworthy changes to the town relate to the expansion of housing. 2. On the northern end of the peninsula, there are now additional houses and the old fort has been replaced with a children’s playground, adjacent to a new community centre, though the lighthouse has remained unchanged. 3. South of the community centre are new tennis courts that link with a footpath as well as Lighthouse Lane, and Footbridge that connects with the school along Coast Road on the other side of a small river.
- Begin to describe the changes.
- Be sure to compare as much as possible.
- Link together lots of locations on the map.
1. The final change is that a former film studio on the southwestern tip of the peninsula is presently a block of flats. 2. The areas that have remained the same are the main roads, a playing field on the southern shore alongside Old Fort Road, and most of the wooded space around the town.
- Switch to another part of the map.
- Don’t include any opinion and don’t forget any areas.
One thought on “ IELTS Writing Task 1 Academic Sample (Maps), Band 9, Written by Dave Lang, Modified by Mohsen Keshmiri ”
Although I’m into podcast , your analysis was wonderful ! : )))
Interesting👏👏
Leave a Reply Cancel reply
Your email address will not be published. Required fields are marked *
Save my name, email, and website in this browser for the next time I comment.
- Preparing for IELTS
- Practice tests
- Free online IELTS Writing practice tests
- Free online IELTS Academic Writing practice tests - paper
IELTS practice Academic Writing test - Task 1
How to approach academic writing task 1.
In the IELTS Academic Writing test, you will have one hour to complete both of the two set writing tasks. Keep an eye on the time it takes you to complete practice Tasks 1 and 2 to make sure you don’t go too far over, and to use as a benchmark for how long you can expect each task to take you.
In the actual test, you will move from the first to the second task without a break. However, while practising, you may wish to reflect on the outcomes of practice Task 1 using the model answer provided before moving on to practice Task 2. Or you may wish to complete them both before looking at the model answers to give you a more accurate sense of timing.
An easy reminder…
Q: How long should I spend on IELTS Writing Task 1?
A: We suggest 20 minutes – saving 40 minutes for Task 2.
Q: How many words for IELTS Writing Task 1?
A: 150 words is about the right length, but don’t be afraid to go a little over.
Q: Should I be formal or conversational in style?
A: You should write in a formal style, suited to an academic environment.
Q: What are the do’s and don’ts in IELTS Writing task 1?
A: Do pay attention to time - task 1 is worth one third of the total marks (while task 2 is worth two thirds), Don’t let nervousness stop you from trying your best.
Get more tips to help you prepare for the writing tasks
Task 1 – Take a look at the chart below and perform the task as outlined:
This graph shows the proportion of four different materials that were recycled from 1982 to 2010 in a particular country.
Summarise the information by selecting and reporting the main features, making comparisons where relevant.

What should I do next?
Once you’ve finished, you can download the model answer for Writing Task 1 and see how your work compares.
This sample offers a useful guide for how to structure your answer for IELTS writing task 1, as well as the style of writing expected. A good way to improve is to reflect on how your answer compares to the model answer – and, of course, keep practicing.
If you want to see an example of an actual answer sheet for the IELTS Academic Writing test (‘on paper’ version), you can download a sample copy below.
- IELTS practice Academic Writing test - Task 2

A Step-by-Step Guide to Band 9 in IELTS General Writing Task 1 (with a Sample Answer)

Today I’ve prepared for you a Band 9 sample answer to an IELTS General Training Writing Task 1 topic. I’ll take you through the sample answer step by step and show you what you should do to meet each requirement examiners use to assess your answers. Ready?
Here’s our topic:
A friend has written to you asking your advice about whether to spend a year before starting university travelling or to work for the year.
Write back to your friend. In your email
- say why he or she wouldn’t enjoy travelling
- explain why getting a job is a good idea
- suggest types of jobs he or she could do
Remember that Task 1 is worth one-third of the total Band Score. That’s why you should spend no more than 20 minutes on Task 1.
Now, we’ll look in detail at the main features and see how they match the Task 1 descriptors in the four areas tested: Task Achievement, Coherence and Cohesion, Lexical Resource, and Grammatical Range and Accuracy.
Task Achievement
- The tone is consistent and appropriate (Band 7 and up)
An important aspect in Task Achievement is the tone. It’s mentioned in Band 7 and assumed for Bands 8 and 9 as something that is “consistent and appropriate”. What it refers to is the level of formality and the language we use to show those levels.
You can see the different levels of formality in this example:
Letter to a bank manager
How’s everything at the bank?
Take care of yourself.
I am writing in reply to your letter dated October 15 in which you requested some information concerning...
Letter to a friend
How’s everything at home?
I am writing in reply to your letter dated October 15 in which you asked me for advice concerning your gap year.
- Cover all requirements of the task sufficiently
- Present, highlight and illustrate bullet points clearly and appropriately
Another key requirement is to cover all three bullet points. According to the Task 1 IELTS Band Descriptors, a Band 8 requires that you “cover all requirements of the task sufficiently” and that means that you “present, highlight and illustrate bullet points clearly and appropriately”.
Now let’s check each paragraph, and analyse how this letter scores on Task Achievement.
Paragraph 1
Dear Monica,
It was great to hear from you and congratulations on your brilliant exam results! I’m sure you can’t wait to start university, but you’ve asked for my thoughts on what you should do over the next twelve months and I honestly believe getting a job is the answer.
Paragraph 1 opens by making it clear that this is a reply to a letter and states what the writer’s opinion is with regard to the two options. It’s a great way to open the letter because it paraphrases the task details (the friend asking for advice) and also has a friendly tone typical of personal letters ( great to hear from you; congratulations on your brilliant exam results ).
In other words, in the first paragraph, we have a friendly tone, we have a context and we have started to tackle the three bullet points.
Paragraph 2
- Say why he or she wouldn’t enjoy travelling
Although travelling seems such an attractive option, I’m convinced that you wouldn’t enjoy it. You’ve never been the type of person who liked going without home comforts so I can’t imagine you sleeping in cheap student hostels. Remember that time we went camping and you were miserable all week!
Paragraph 2 follows with an explanation as to why travelling for a year is not the best option, exactly as stated in the first bullet point. The tone is friendly and sincere. It gives an impression of a friend using first-hand knowledge to support her point of view by mentioning “ not the type of person who likes going without home comforts ” .
Adding an example of that time you went camping is a good touch. Examiners like to see examples to back up the main points.
Paragraph 3
- Explain why getting a job is a good idea
On the other hand, working abroad for a year would give you invaluable first-hand insight into another culture as well as the chance to improve your fluency and, as you want to study modern languages, the experience could be really worthwhile. Not only that, you’ll be making lots of new friends.
Paragraph 3 justifies the job option and that is done through the fact that the friend wants to study languages at university so it’s quite easy to show how a year working abroad would be a great preparation for such studies. The tone is neither overly formal or informal because it is the most serious part of the letter where she is trying to convince her friend that the job option is the best.
Paragraph 4
- Suggest types of jobs he or she could do
If I were you, I’d start looking at schools either in France or Spain that want assistant teachers. You won't need any previous experience and I’m sure it’d be very rewarding. An alternative might be working as an au pair, you know, living with a family and probably taking care of their young children though that has its pros and cons as you can imagine.
In the fourth paragraph, two job options are suggested together with reasons for taking them. Again, it’s a fairly neutral tone starting off with a classic conditional form of offering advice ( If I were you, I’d … ).
How does the letter end?
Of course, it’s up to you but, believe me, a year’s work experience is the best.
Nicole
It’s good to finish your letter strongly, not only with an expression of farewell but also, as in this case, with a conclusion. And the tone returns to friendly ( it’s up to you; Take care).
Our letter is hundred and twenty words long, excluding the name. This is a good length. A “short” letter may not develop all the bullet points and therefore not score so well on Task Achievement.
Grammatical Range and Accuracy
In Grammatical Range and Accuracy, a Band 8 will be given to a letter that includes a wide range of grammatical structures which are sufficiently complex where necessary. Very few IELTS answers are completely error-free so as long as you can produce a good number of error-free sentences, then you will get a high Band score.
In our letter, I counted just 10 sentences, all complex with the verb tenses handled well. We see good use of the present perfect to refer to events from the past that are still relevant ( you’ve asked me, you’ve never been ).
Above all, the letter has several examples of modal verbs and conditional forms. Altogether I counted 12 examples of these forms in the letter. This is expected because the objective is to discuss future possibilities and compare options. So, we see how the writer makes assumptions based on how well she knows her friend ( you can’t wait; you wouldn’t enjoy it; I can’t imagine you; you can imagine ).
She also gives advice and speculates on that advice ( what you should do; would give you invaluable insight; could be really worthwhile; you’ll be making lots of new friends; you won’t need; it’d be really rewarding; an alternative might be ) using a range of modal verbs. We also have the elegant conditional form of giving advice ( If I were you, I’d... ).
Although travelling seems such an attractive option, I’m convinced that you wouldn’t enjoy it. You’ve never been the type of person who liked going without home comforts, so I can’t imagine you sleeping in cheap student hostels.
If I were you, I’d start looking at schools either in France or Spain that want assistant teachers. You won't need any previous experience and I’m sure it’d be rewarding . An alternative might be working as an au pair, you know, living with a family and probably taking care of their young children though that has its pros and cons as you can imagine…
At the same time, remember that this is an informal letter and that’s why there are so many verbal contractions throughout, ranging from I’m and you’ve to I’d, it’s and wouldn’t, won’t. All are perfectly acceptable in a letter of this sort but in formal letters, they should not be used.
Lexical Resource
In this letter, the vocabulary used is familiar without being overly specialized. There is a mention of "insight into another culture" and "fluency" in relation to studying languages, as well as "assistant teacher" and "au pair" when discussing possible jobs.
However, these terms are not exceptionally unusual, which is appropriate to keep the letter personal and informal. The examiner is primarily interested in assessing how effectively you use English, rather than testing your insider knowledge on any particular topic.
Nevertheless, what is of interest is the use of collocation, that is, how you combine familiar words to make your English appear as good or even better than that of native speakers.
This letter provides some good examples, such as "make...friends," "a worthwhile experience," and "previous experience." Moreover, incorporating one or two colloquial phrases like "pros and cons" or "It's up to you" can emphasize specific elements that examiners seek when evaluating for a high score.
On the other hand, working abroad for a year would give you invaluable first-hand insight into another culture as well as the chance to improve your fluency and, as you want to study modern languages, the experience could be really worthwhile . Not only that, you’ll be making lots of new friends .
If I were you, I’d start looking at schools either in France or Spain that want assistant teachers . You won't need any previous experience and I’m sure it’d be rewarding. An alternative might be working as an au pair , you know, living with a family and probably taking care of their young children though that has its pros and cons as you can imagine.
Coherence and Cohesion
In the model essay, the paragraphs as well as the sentences within them are well-organised and well-connected. There are good examples of cohesive devices or linking words. Look at Paragraph 3:
“ Although travelling seems”, “ So I can’t imagine”.
Paragraph 4 then contrasts that by opening with “On the other hand” and the letter also has examples of “and”, “but”, “though” and “not only that”.
Dear Monica,
On the other hand , working abroad for a year would give you invaluable first-hand insight into another culture as well as the chance to improve your fluency and, as you want to study modern languages, the experience could be really worthwhile. Not only that , you’ll be making lots of new friends.
If I were you, I’d start looking at schools either in France or Spain that want assistant teachers. You won't need any previous experience and I’m sure it’d be rewarding. An alternative might be working as an au pair, you know, living with a family and probably taking care of their young children though that has its pros and cons as you can imagine.
Of course, it’s up to you but , believe me, a year’s work experience is the best.
This model letter is just one example of how to answer this topic, but you can see how the paragraphs are all linked thematically, grammatically and lexically, the all-important aspect of vocabulary.
If you’d like to learn how to write letters of each type and more generally, how to meet all the IELTS Writing and Speaking requirements and answer each type of task, check out my IELTS General Pack below. It will help you prepare in less time and achieve a higher score.

Here are some other blog posts you may be interested in:
How to Write a Band 9 IELTS Writing Task 2 Essay | Two Direct Questions
10 IELTS Writing Tips to Get Band 7+ Score
See all recent posts
Terms & Conditions * Privacy Policy * Cookie Policy * Disclaimer
© 2014-2024 Fastrack Education ltd. All Rights Reserved
Do you need any help? [email protected]
IELTS Mentor "IELTS Preparation & Sample Answer"
- Skip to content
- Jump to main navigation and login
Nav view search
- IELTS Sample
Band 9 Essay
Ielts materials.
- IELTS Bar Graph
- IELTS Line Graph
- IELTS Table Chart
- IELTS Flow Chart
- IELTS Pie Chart
- IELTS Letter Writing
- IELTS Essay
- Academic Reading
Useful Links
- IELTS Secrets
- Band Score Calculator
- Exam Specific Tips
- Useful Websites
- IELTS Preparation Tips
- Academic Reading Tips
- Academic Writing Tips
- GT Writing Tips
- Listening Tips
- Speaking Tips
- IELTS Grammar Review
- IELTS Vocabulary
- IELTS Cue Cards
- IELTS Life Skills
- Letter Types

- Privacy Policy
- Cookie Policy
- Copyright Notice
- HTML Sitemap
IELTS Preparation with Liz: Free IELTS Tips and Lessons, 2024

- Test Information FAQ
- Band Scores
- IELTS Candidate Success Tips
- Computer IELTS: Pros & Cons
- How to Prepare
- Useful Links & Resources
- Recommended Books
- Writing Task 1
- Writing Task 2
- Speaking Part 1 Topics
- Speaking Part 2 Topics
- Speaking Part 3 Topics
- 100 Essay Questions
- On The Day Tips
- Top Results
- Advanced IELTS
IELTS Table Band Score 9 Model Answer
Below is an IELTS table model answer for writing task 1. The IELTS table below is taken from IELTS Cambridge book 7. The sample answer is estimated at band score 9. This page was last up-dated 2019.
The table below gives information about consumer spending on different items in five different countries in 2002.
Source: IELTS Cambridge English Test Book 7
IELTS Table Model Answer
The table illustrates the proportion of national expenditure in Ireland, Italy, Spain, Sweden and Turkey on three types of consumer items in 2002.
Overall, the category of consumer goods that all countries spent most on was food, drinks and tobacco, which was three times higher than on the other types of goods. The lowest spending could be seen in the category of leisure and education in all five countries. The outlay of Turkey was generally higher than the other four countries.
In terms of food, drinks and tobacco, Turkey spent the most at 32.14%. The expenditure of Ireland was also high (28.91%) compared to Sweden which spent the least (15.77%). Spain and Italy spent 18.80% and 16.36% respectively. On the other hand, the lowest expenditure was on leisure and education which accounted for under 5% in all countries. Turkey spent most on these items at just 4.35% of their national expenditure which is around double that of Spain (1.98%).
Clothing and footwear was the third category of consumer goods and outlays for those items were between 9% in Italy and 5.40% in Sweden. The national spending in this area for the remaining countries averaged around 6.5%.
Tips for IELTS Tables
- Put all your key features in the overview. Note one key feature is not enough for a high score.
- Divide your body into paragraphs.
- You don’t have to give all details. You can group details together by giving averages or ranges.
- Be selective. Don’t put too many details in your report.
- Make sure you write over 150 words but aim for less than 200.
- Use a range of linking devices eg compared to / as opposed to / in terms of / while etc
- Try to avoid being repetitive with your sentence structures.
- Some words will be repeated. There is always a limit to how many synonyms one word has. As long as you show the skill or paraphrasing and avoid errors, it’s fine.
Other Writing Task 1 Models
- Bar Chart Model
- Line Graph Model
- Pie Chart Model
- All Writing Task 1 Tips and Model Answers
Main IELTS Pages
Develop your IELTS skills with tips, model answers, lessons, free videos and more.
- IELTS Listening
- IELTS Reading
- IELTS Writing Task 1
- IELTS Writing Task 2
- IELTS Speaking
- Vocabulary for IELTS
- IELTS Test Information (FAQ)
- Home Page: IELTS Liz
Get my free lessons by email
Subscribe for free to get my new IELTS lessons sent to your email inbox.
Email Address
Hi, dear Liz. I just wanted to know if the data was from the previous year, I assume, then why in the last sentence of the third paragraph it was not “… which was around that of Spain”, in place of “is”. Could please….
As you see from the information given in the rubric (that is the description given of the table, above the table” and the table, that the date is 2002. That is in the past.
the table illustrates the proportion of the national expenditure spent on consumers goods in Ireland, Italy,Spain,Sweden and Turkey in the year 2002. overall, a look across the table, shows that the in all of the five countries, most of their money was spent on food, drinks and tobacco. while the least amount went to leisure and Education. moreover, Turkey had the most percentage in two of the categories. in terms of consumables, Turkish and the people of ireland spent 32.14% and 28.91 respectively emerging the first and second in position, while the exepenses for the remaining countries were under 20%. On the other hand, the least spending were on leisure and education which was below 5% in all of the countries. however, Turkey was still the highest with 4.35% as opposed to Spain who spent 1.98%. Moreover, all of the countries spent less than 10% on clothing and footwear. However, Italy emerged the highest with 9.00% and Italy the lowest in this category with 5.40%.
The table illustrates the national expenditure on three different items in several countries (Ireland, Italy, Spain, Sweden, and Turkey) in 2002.
Overall, most of the countries spent the most money on food, drinks, and tobacco. In contrast, the least amount of spending in all countries was on leisure and education.
In terms of food, drinks, and tobacco, Turkey showed the highest expenditure at about 32,14% compared to other countries. In contrast, Sweden spent the least money on this item which was only 15,77% of their total national expenditure. The outlay of the remaining countries ranged between 16,36% to 28,91%. On the other hand, Italian people’s spending on clothing and footwear was the highest (9,00%) compared to the remaining countries, while Sweden only spent around 5%. The expenditure on the last items, which were leisure and education, by Turkey reached around 4% as opposed to Spain which expended less than 2%. The outlay of Ireland, Italy, and Sweden was more than 2%.
The table illustrate five different countries on the expenditure on food /drink/tobacco, clothing/footwear and leisure/education in 2002.
Overall food/drink/tobacco has the most significant expenditure by consumer on all the five countries whereas less than five percentage were accounted for in all the spending among the countries on leisure/education
However Turkey been the most significant country with about 32.14%expenditure on food /drink/tobacco which has the highest consumer compare to Spain with 1.98%.Ireland ,Spain,Italy and Sweden are as follows with 28.9%,18.0%,16.36%,and 15.77% respectively.Leisure/education represent the least of all spending in 2002 with about less than 5%in all countries
In contrast to the other items clothing/footwear is triple that of leisure where Italy represent the most significant expenditure of about 9.00%.
The table illustrate the five countries (Ireland, Italy, spain, Sweden, turkey) consumer spending their money on various kind of item in 2002. Overall, here we seen that in each country consumer spend large of their money in food / drinks/tobacco. While on the other hand, they spend amount portion on leisure and education. Here, Ireland and turkey spend their big portion on food , drinks and tobacco which is 28.91% and 32.14% respectively. Others three country Italy , spain and Sweden spend also in this portion under 20%. But, mostly significantly seen that each country expenditure on leisure and education under 5% while the turkey is the highest 4.35%. Now on the other hand, clothing and footwear each country spend on this portion under 10 % and Italy spending on this almost 9% which is one the highest in those five countries and the lowest percentage of this is seen that in sweden which is 5.40% respectively.
The table illustrates the percentages of the spending habits of people in three categories both in four European countries and Turkey in 2002.
Overall, consumers spent the highest proportion of their money on food/drinks/tobacco and then clothing/footwear. The percentages were higher in Turkey and Italy than other countries respectively, and the lowest rates were in Sweden. Furthermore, leisure/education was popular in Turkey and it was lower in Spain than other nations.
When the table is examined in detail, food/drinks/tobacco was higher in Turkey with 32.14% and it followed by Ireland by almost 3% difference. In the other European countries consumers spent 15.77% to 18.80% of their money on it. Regarding clothing/footwear Italy ranked at the top with 9% and Ireland, Spain and Turkey had almost the same percentage at 6%.
Leisure/education was the least spending category among all, Turkey was at the top of the list with 4.35%. Approximately 3% accounted for Italy and Sweden and they followed by Ireland and Spain with 2.21% and 1.98% respectively.
Hi Liz, could you please mark my answer.
The table shows how three categories of consumer goods were spent in five countries percentagewise in the year of 2002.
Overall, spendings in food, drinks and tobacco made up the largest proportion followed by the category of clothing and footwear, while leisure and education expenses contributed the least. Moreover, the general outlay of Turkey was higher than the other four countries.
Regarding Turkey and Ireland, they were the biggest spenders on food, drinks and tobacco, with spendings at 32.14% in the former and 28.91% in the latter. They also spent around 6.5% of their outlays on clothes and footwears. In the meantime, Turkey’s expenditure for the category of leisure and education was at 4.35% although Ireland only spent slightly over half of Turkey’s (2.21%).
As far as Italy, Spain and Sweden are concerned, food, drinks and tobacco items accounted for 16.36%, 18.80% and 15.77% respectively. Among them, clothing and footwear related expenses in Italy were the most at 9% in contrast to Sweden’s 5.4%. Approximately, total percentage for the leisure and education costs in Sweden and Italy is 3.2% while only 1.98% of national expenditure were utilised in Spain’s leisures and educational sector.
The table depicts the information about the national expenditure in Ireland, Italy, Spain, Sweden and Turkey on three types of consumer spending in the year 2002.
Overall, the category of the consumer goods that all countries spent the most was food, drinks and tobacco, which was three time higher than the other types. While, the lowest spending could be seen in leisure and education in all five countries.
evidently, it is clear from the table that Turkey and Ireland spent the most on food, drinks and tobacco that is 32.14% and 28.91% respectively. Where as, Sweden spent the least on food, drinks and tobacco in all the five countries which is 15.77%, meanwhile Italy and Spain spent 16.36% and 18.80% correspondingly. Further, the lowest expenditure was on leisure and education goods which is accounted for under 5% in all the five countries. Turkey spent the most on this items at just 4.35% as compared to Spain which spent the least on leisure and educational goods that is 1.98%.
shifting attention towards the rest of the information that both the countries Italy and Sweden spent the same amount of their national expenditure on leisure and educational goods that in around 30% . After that clothing and footwear was the third category in which Italy spent the highest which is 9% and Sweden spent the lowest which is 5.40%. Turkey, Ireland and Spain spent the almost same amount of expenditure on clothing and footwear items.
Hello Liz and others, Is there someone else to rate my writing. The table illustrates the proportion of annual expenses of consumer spending in Ireland, Italy, Spain, Sweden and Turkey in year of 2002. In terms of leisure and educational expenses, Spain spent the lowest at 1.98%. The expenditure of Ireland also low compared to Turkey. Italy and Sweden spend 3.20% and 3.22% respectively. On the other hand, Turkey hit the top of this table with 32.14% on food, the other countries numbers are partially follows this high proportion on this same category. Clothing and footwear was the third category of consumer goods and outlay for those items were between 9% in Italy and 5.4% in Sweden. The national spending in this area for the remaining countries averaged around 6.5%. Overall, all countries spent the most amount of money on food, drink and tobacco, which was a way higher than the other 2 categories of expenditure. The lowest could be seen in educational and leisure expenses category. The highlight of this chart is Turkey with generally higher numbers in all category of expenses than the other countries.
The table below depicts data about the expendature of goods of five countries in 2002. Overall, it is clear that all the nations spent the most on food, drinks and tobacco however least on leisure and education. In details, Turkey spend the most on food, drinks and tobacco than all the given nation that is 32.14% while the lowest is spent by Sweden that is 15.77% . The second most is spent by Ireland that is 28.91% which is greater than Italy and Spain that are 16.36% and 18.80% respectively. The least is utelize on leisure and education that has the highest value of 4.35% of Turkey and least is 1.98% that is of spain . However Italy, Ireland,and sweden spends about 3.20% , 2.21%, and 3.22% respectively. Clothing and footwear comes in middle category that has the highest value of 9.00% that was of Italy and least value 5.40% that is of Sweden. The other nations such as Ireland , Spain , and Turkey that has the values of 6.43%, 6.51% and 6.63% respectively.
The Table compares the annual expenses on various consumer items in five different regions. Overall, there are three different segments of consumer spending have been listed-food, clothing and expenses related to leisure & education. While the food and education expenses are found to be highest in Turkey, consumer spending for clothing is the most in Italy. On the other hand, though the consumer spending in food & beverage and clothing is the lowest in Sweden, annual expenses regarding education and other leisure items are the least in Spain. Italy and Ireland are the two countries which accounted for the highest consumer spending on food including beverage and tobacco, 32.14% and 28.91% respectively. On the contrary, the consumer expenses in those items are found to be almost half of that percentage in other three countries, averagely around 17.00%. National spending on clothing was under 10.00%, where the spending in consumer clothing items in Italy is accounted for the most and the least in Sweden. The expenses people tend to make in this field is quite similar in all the countries; almost around 7.00%. The consumer spending in education and other free activities are quite lower compared to the annual consumer spending in food and clothing in the mentioned countries. Like the food expenses, the spending in leisure and education are also the highest in Turkey. The average spending of the other countries stands at less than 4.00%, while the spending in this sector is the lowest in Spain.
Hi Liz, It will my pleasure if you help me with my writing. Thanks in advance…
The table illustrates Ireland, Italy, Spain, Sweden and Turkey data on end users expenditure on various items in 2002. Overall, it is clear that, the total national investment on food, drinks and tobacco was greater than clothing, footwear, leisure and education categories. Moreover, Turkey has the greatest on foods, leisure and education items while Italy had the most investment in clothing and footwear. In terms of food, drinks and tobacco consumption, Turkey national consumer expenditure was 32.14% which was greater than other four countries. Furthermore, Ireland had the second largest investment and it was 28.91%. The percentage of consumer expenditure for Spain and Sweden were 18.80 and 15.77 percent respectively. However, the expenditure of Italy was the least to that category and it was around half of Turkey’s expenditure. Although Italy had lowest consumer expenses in previously described category, it had the greatest 9% expenditure in clothing and footwear. For the consumer of Ireland, Spain and Turkey, the expenditure value ranges between 6 and 7 percent. However, Sweden had the least consumer expenditure on both clothing and food category with around 5.40%. Finally, in leisure and education category, the percentage of national investment was 4.35% which was greater than others in 2002. Both Italy and Sweden had minimal differences to the category and their costs were 3.20 and 3.22 percent respectively. Ireland had very little expenditure in educational and leisure category and just 1.98% was spent by Spain.
please reviw this and lemme know if i had mistaken somewhere?
the graph below shows the sales of children’s books, adult diction and educational books between 2002 and 2006 in one country. the given line graph depicts information about three different kinds of books being sold from 2002 to 2006 in a particular country. units are mentioned in million dollars.
Overall, it is conspicuously seen that there was an increase in trend in both children’s and educational books throughout the given period while sales of adult fiction decreased gradually.
According to the given graph, it is clear that in 2002, sales of children’s books stood at about 33 million dollars, but then it rise slightly to just over 40 million in 2003, and the figure went up significantly to about 55 million. similarly, from 2003 to 2003 the purchases of books in education surges dramatically to just over 30 million; this trend, however, experienced a slight decrease between 2003 and 2005, but then grew to more or less 33 million.
On the other hand, a substantial increase had been seen in the sales of adult fiction from the commencing of the year till 2003 (which accounted for around 50 to 33 million dollars), before witnessing a sharp growth where it constituted precisely $ 40 million. Eventually, this trend again started to drop steadily by ($10 million) till the end of the given period.
the table depicts information about different items where people mostly spend their money in five countries in 2002.
overall, a greater portion of people consumed money for food items. Next, wearing items and a few of them are for free time and gathering knowledge.
In turkey and Ireland higher parcent of folk spend for food items like drinks and tobacco which is 32. 14% and 28.91 % respectively in 2002. at the same period in Italy and Sweden’s people consumtion are lower like 16.36% and 15.77% gradually. though Spain’s people consumed half percent of turkey consumption on food items
about clothing and footwear items the information shows that Italian sonsumer were spending 9.00% on the other hand Ireland, Spain and Turkey Consumers had been spending 6.43%, 6.51 % and 6.63% respectively whivh is almost same portion while almost 4.00% less Sweden consumer were spending for this items than Italy. lastly, 4.35% consumer were spending for their leisure time and education in Turkey in 2002 when just 1.92% of consumtion had been spending in Spain and others three cuuntries consumers were spending gradually 2.21%, 3.20% and 3.22%.
Hi Liz! That was an excellent sample essay! I had a doubt :
“Consumers of Italy, Spain, and Sweden spent around 15-20% in this category.”
Could I write something like this?
“Consumers in Italy …” would be correct.
Hi Liz, I joined your youtube channel 2 ago. I noticed that you do not continue your youtube channel, Please, continue to put new videos, I will wait you…
As soon as my health allows me to make videos without risking serious consequences, I’ll start again.
Recover soon dear.
the table illustrate the percentage of how much consumers spent on certain consuming goods and services in 5 countries (Ireland, Italy, Spain, Sweden and turkey) through the year of 2002.
Overall, the five countries spent the most amount of money on food, drinks and tobacco comparing to other consuming goods with Turkey in the lead, spending less on clothing and footwear and under 5% on leisure and education.
With regards to tobacco consumption, Turkey, Ireland and Spain were the three leading countries with 32.14%, 28.91% and 18.80% respectively, while Italy (16.36%) and Sweden (15.77%) spend less comparing to other countries.
In terms of clothing and footwear, a 9% was spend in Italy slight above of what Ireland (6.43%), Spain (6.51%), Sweden (5.40%) and Turkey (6.63%) spent on the same items. Furthermore, all of the studied countries spent a marginal proportion of their money in the same year on services (leisure and education).
The data given illustrates about the consumer spending on various items in 5 countries namely Ireland, Italy, Spain, Sweden, and Turkey. The expenses are broadly categorized into 3 parts: food/drinks/tobacco, clothing/footwear, and leisure/education. Turkey heads the country with the highest percent of spending in the food/drinks/tobacco column being 32.14%. Trailing Turkey is the country of Ireland with 28.91% of its expenses being in the food department as well. Italy is the country with the least percent of amount being spent on food/drinks/tobacco being 16.36%. Lagging behind in the food parameter, Italy tops all the 5 countries in clothing and footwear aspect that being 9%. Sweden is the country with the minimum amount of spendings of 5.4% in the clothing arena. Sweden though does spend a fair amount on education with 3.22% of its consumer spending, coming second when compared with a fair rate of 4.35% of Turkey. Spain remains almost average in the clothing and food sector but comes last in the percent spent on leisure and education with a low percent of 1.98.
Thanks so much for your patient teaching, Miss Liz.
The table given sheds light on information related to proportion of consumer expenditure on various items in five different countries (Ireland, Italy, Spain, Sweden, Turkey) in year 2002. Units are measured in percentage.
Overall, the share of food, drinks and tobacco was the largest among three categories with an average of 22.4% when leisure and education was the least at 2.99%, following a proportion of clothing and footwear (6.79%).
When it comes to a nation with the largest consumption on food, drink and tobacco, the first rank was Turkey which was close to Ireland (28.91%), but far different from the other three countries with below 20% percentage – Italy, Spain as well as Sweden. Likewise, Turkey was also the highest spending nation in a category of Leisure and Education with a number of 4.35%, but the remaining countries were much lower in their sharing percentage.
In terms of clothing and footwear, 9% of the distribution by Italy was the most outstanding amount. Comparatively, the other 4 countries are all below 7%. Sweden was the lowest percentage in this category which was at 5.4% merely.
The table depicts the proportion of expenditure in five different countries (Ireland, Italy, Sweden, Spain and Turkey) on three items in 2002.
Overall, it is clearly shown that all these countries spent the most on food/ drinks/ tobacco. Whereas, leisure/ education was the item with least expenditure across these countries.
Generally, Turkey recorded the highest in spending for food/drinks/tobacco at 32.14%, swiftly followed by Ireland with 28.91%. Further, there was only a slight gap between Italy, Spain and Sweden that accounted for about 2-3% differences. Surprisingly, Italy dominated all other countries as they spent the highest in clothing/ footwear at 9%, while the rest spent roughly 3-4% lower.
It is also worth noting that in terms of leisure/ education, it was still the Turkish who ruled the highest at 4.35%, in contrast to Spanish which was over 2% less. Expenditure differences on this item were marginally insignificant among other three countries.
Mam, you are an amazing teacher. what is your health condition now? please, get well soon. Lots of love.
Thanks for asking. I’m still sick unfortunately, but I do feel a bit stronger this year than the previous few years. Hopefully this is a good thing. I’ll see how I am later this year. I’ll make a video with an update of my personal situation soon so you all know.
Godspeed recovery. Sending warm hugs and snuggles to you our fighter ❤️
Hey Liz! Can we use “i.e” to list data in intro?? Btw you’re an amazing teacher! Lots of love..
No, you should not use “ie”. You are not presenting examples of data, you are presenting data. Just give the stats directly.
Hi Liz, your explanation is very useful for everyone. Thank you ❤️
Please rate my writing:
The given table illustrates the data of three kinds of consumers, who spent their money on mentioned products in five different countries during 2002.
First of all, people from Turkey spent the most on food, drinks and tobacco which is 32.14%, while Italians were the least to spend on that area(16.36%). In the clothing and footwear section, they were also at the top position by contributing 9% whereas Sweden was operating at the lowest rate, 5.40%. Spain’s budget for leisure and education was 1.98% but Turkey spent 4.35% of their money in that area.
On the other hand, people from Ireland spent 28.91%, 6.43%, and 2.21% respectively for mentioned items in the table. However, Sweden almost spent three times more on food and drinks than on leisure and education.
Overall, it’s pretty clear that consumers from all five countries were more interested in food, drinks, and tobacco as they have spent the hugely as against the rest of the items. However, Turkey spent the most combining all three departments.
The table illustrates the diferent percentatges of consumer spendings five diferent countries had on various items in 2002. Overall, all five countries had the higest expenditure in the category of food, drinks and tobacco which was between 15 and 28% and the least expenditure in leisure and education which was under 5%. Also, while Turkey was the country with more expenses in all items, Spain and Sweden were the lowest expenders. On the one hand the higher expenders in food, drinks and tobaco were turkey with the higest percentatge of 32.14% followed by Ireland with a 28.91%. Also, in both clothing/footwear and leisure/education Italy and Turkey were in general the countries which consumed more. On the other hand, the lowest expenders in food/drinks/tobaco were Sweden with a 15.77% followed by Italy with a 16.36%. Moreover, in clothing/footwear the lowest expender was Sweden with a 5.40% and in Leisure/education was clearly Spain with the lowest percentatge of 1,98%. n
The table illustrates proportion of national expenditure ( Ireland,Italy,Spain,Sweden,Turkey) on three different consumer types in 2002. Overall, all countries spent more on food/Drinks/Tobaco Which was around three times higher than other goods.on the other hand education was least amount spent all countries. The outlay of Turkey was generally higher than the other four countries. In terms of food Turkey spent most at 34%.while ireland expendiure also high compared to Sweden.Spain and Italy spent at 16%&18& respectively.On the otherhand lowest expenditure was on all leisure/education which accounts for all countries. Turkey spent most on this at 4.5% and which is double of spain expenditure on this goods. Clothing/Footwear is third consumer good total outlay for those items were inbetween 5% & 9%. Remaining Nations spent around average of 6 % on this items.
The table provides data on expenditure by five different countries on three consumer items for the year 2002. Overall, It is apparent that all these nations spent the highest on the category named food, drinks, and tobacco. On the contrary, category clothing and Footwear, and category food and drinks occupied the second and third position respectively. In the category food, drinks, and tobacco, among five countries, Turkey(32.14%)spent more money than any other country did. On the other hand, the next country behind Turkey was Ireland(28.91%), followed by Spain(18.80%), Italy(16.36%) and finally Sweden(15.77 %). Even though clothing and footwear was the second-highest, there is a significant reduction in expenses by each of these five countries. The expenditures by Ireland,Italy,Spain, Sweden and Turkey are 6.43 %,9.00%,6.51%,5.4%,& 6.63% respectively . Furthermore, these five nations individually spent less than 5% on leisure and education. Spain(1.98%) contributed the lowest for this category, while Turkey gave 4.35% of its share. .
Hello, Liz. Thanks for all these useful preparation materials. My question is, as I study academic writing task 1, I sometimes come across model answers with only one body paragraph, especially for questions that include tables. Is it okay to have only one body paragraph, or should we necessarily write a second one all the time?
The body must always be divided in to two or three paragraphs. This is part of how you distinguish categories and illustrate key features further.
Hi Liz, I stumbled upon your website while I was researching for preparation materials, being a total newbie to IELTS. The contents of your website gave me a holistic and comprehensive idea on what I should expect, what is expected of me during the exam and how to tackle the same. I successfully achieved a band score of 8 in my IELTS, and I have you and your website to thank for that. I think you do splendid work enhancing the lives of aspirants like me. 🍻
Great score! Very well done 🙂
The table shows information about coustmor of five different nation ( Ireland, Italy, Spain, Sweden and turkey) whose spend their income of three various item in 2002. The data is calebrated in percentage. Overall, data reveals that people of all the nation spent big amount on food/drinks/tobacco. While least money were spending on leisure and education. It is clear from the graph, Turkey spent the highest percentage of money on food and drinks while sweden spend minimum money on food. It was 32.14% and 15.77% respectively. Moreover, there was unnoticeable difference between Ireland and Turkey expenditure of clothing and footwear items. It was only 0.20 percentage. However, 1.98 % money spended by Spain on education and leisure particular. Whearas, Turkey expenses on this item was 4.35%. Nonetheless, italy more expenditure on clothes and footwear than other countries. Italy and Sweden spent same amount on education and leisure items.
The cited table gives us an insight into the fortune expended by the citizens of five European nations on three classified categories in the year 2002. An overall glance of the given table suggests that the focus weighs towards the eatables and least interest is found on leisure or education. Turkey has recorded the majority of chunk being spent on food, drinks, or tobacco, while the Spanish show the least participation in spending money on leisure and education. Moreover, it is can be observed from the table that the citizens of Ireland, Italy and Spain show thrice willingness to spend on sartorial goods when compared to knowledge and entertainment. Furthermore, the majority of their income is contributed to consumable items ranging from 18.80% in Spain to Ireland with 28.91%, while Italians are found to be more trend-conscious and have spent 3% more on fashion. In addition, the provided distribution table illustrates that Sweden is likely to spend half of the amount Turkish spends on food, drinks, and tobacco; however, Turkey enjoys a slight more lavish life than Sweden when it comes to the other two categories, contrasting with a difference of nearly 1.2%.
Greetings of peace Liz! If you have ample of time. Please do evaluate this one. Thank you so much!
The table chart shows the amount of money spent on five various countries namely Ireland, Italy, Spain, Sweden, and Turkey in terms of three different categories particularly food, drinks and tobacco, clothing and footwear, and leisure and education last 2002. Units are measured in terms of percentage.
Overall, Turkey had the highest money spent in food, drinks, and tobacco while Sweden had the lowest. In the latter country, it had the smallest utilization of money in clothing and footwear, whereas Italy had used their money much on it. Meanwhile, Turkey spent their money much on leisure and education than Spain, which had the minute spending on the aforementioned category. It is noticeable that Turkey is the leading country in spending money on food, drinks and tobacco, and leisure and education as well.
With regards to the food, drinks, and tobacco spending, Turkey had 32 per cent which is doubled than the amount of money spent by the Swedish people. Italy, on the other hand, had approximately 4 per cent larger than Sweden.
Furthermore, Turkey had 4.35 per cent expenses on leisure and education while Spain had only 1.98 per cent. Although Sweden and Italy had an almost similar percentage (with 3.22 per cent and 3.20 per cent, respectively), Ireland had 2.21 per cent on the aforesaid category spending.
Thank you so much for the feedback Liz! 🙂
Please evaluate. The table illustrates the household expenditure of five countries (Ireland, Italy, Spain, Sweden and Turkey) on three distinct consumer goods. Overall, in the category of food, drinks and tobacco each country spent most compared to least spending on Leisure and Education. The expenditure of Italy was highest on clothing and footwear while on the remaining two good, Turkey spent more. In the category of food, drinks and tobacco, Turkey spent the most at 32.14% while Ireland spent 28.91%. Spain and Italy spent 18.80% and 16.36% respectively but the expenditure of Sweden was 15.77% which was the least among this category. On the other hand, the lowest expenditure was on Leisure and education (below 5%) by all countries. Spain spent as low as 1.98% on this category. In terms of clothing and footwear, the household expenditure of Italy was the most at 9% compared to Sweden which spent least to 5.40% while the remaining three countries spent near 6.5% on this category.
👍👍👍👍👍👍👍👍👍👍👍👍👍
The mention table illustrate the percentage of consumer spending on different items food,drink,,tobacco,clothing, flower,leisure and education in five different countries in year 2002.
Overall, the highest percentage of consumer spending went on food,drink,and tobacco in each country. Whereas clothing, footwear, leisure,education had the lowest percentage of consumer spending in five country.
First of all, consumer spending on food,drink and tobacco was the highest percentage in Turkey at 33.14% followed by Ireland 28.91%. Whereas, Sweden hat the lowest percentage at 15.77%. In addition, Italy spent 9.00% in clothing and foodwere. Sweden expenditure was the last position, the figure was 5.40%.
In terms of, consumer spending on leisure and education was the largest percentage in Turkey at 4.35% after that sweden was the next position 3.22% in 2002. On the other hand Spain had the lowest percentage. In addition Turkey was the second position on consumer spending in clothing and foodwere the amount was 6.63%.
If i writing task 1 in this system which band i got in ielts main exam, please answer me.
Hi liz It’s really helpful for me Thanks for this task
Hi Liz, I congratulate you for your page, which is one of the best that I have visited. Your lessons are very clear and simple to learn from. Also, watching you from your youtube videos, I see a perfect english teacher transmitting the information in the most effective way for us viewers (speaking personally). Actualy I am preparing for IELTS exam and your lessons of task 1 in Writing are the best I have ever seen, very easy to remember when I work on differents topic of this task. Many thanks for this opportunity!
I’m pleased you found my website and can benefit from my lessons. Good luck with your test !! 🙂
Thank you sooooooooo much ♥️ for sharing this task and tips. I’m really glad to get these. I am Ruhi, from Bangladesh
If pie chart is given along with the table, then, do we have to write over view from both or from pie chart only?
The overview is for everything on the paper. If you have two charts, or one chart and one table, it all goes in the overview together.
Can I use bracket to mention percentages?
You can use brackets in Writing Task 1. However, be flexible with how you present information and don’t overuse them.
Thank you for all the good work Liz, this indeed has been very helpul for me.
I’m glad it’s useful 🙂
The table shows the proportion of consumer expenses in three categories in five countries in 2002. Looking from the overall perspective, it is readily apparent that the category of food, drinks, and tobacco was the most popular, and it was followed by clothing and footwear. In contrast, people spent the least expenditure on leisure and education.
Among the five countries, Ireland and Turkey recorded the highest percentages in food, drinks, and tobacco section, at 28.91% and 32.14%, respectively. The proportion of expenditure of Turkish people was also the highest in leisure and education, at 4.35%. For the clothing and footwear category, a significant percentage of 9% of Italian people were consumers.
However, it can be seen that Sweden had the lowest percentages for food/drinks/tobacco and clothing/footwear sections, at just under 16% for the former and 5.40% for the latter. Meanwhile, the percentage of expenditure on leisure and education of Spanish consumers was just around 2%.
Thanks for all the website, it’s REALLY awesome and indeed assists me with preparation for IELTS.
Maybe, you could help me out, for I’m a bit perplexed. In the sentence “A similar pattern could be observed for Turkey, who/which spent the highest percentage…” should “who” or “which” be used. Since, generally, they use “which” with countries and “who” when talking about people. In this situation, the sentence is about people who spend, although it is expressed by country. So what is the correct option to use?
Thanks in advance)
“Turkey” is not people, it is a country so you need “which”.
I took the IELTS indicator last week. everything went like I planed before, however, in the writing section task 1, I was given a line chart. They only put 2 lines in this line chart and both were increasing. I did not have much to write because they were not a lot of information. Which cause me to have 5 in writing. I’m taking the exam again and I am really scared that they would give me the same one . What can I do….
Do you want to recreate the line graph you got so I can write a model answer?
Hello Liz! Thank you for your valued material. I just have a question for you, referring to tables (or probably it applies to other types of charts). When we are given groups, such as age groups or food groups, that implies different variables in the same category, can I change it by numbers? For example, Instead of saying “food/drinks and tobacco, can I use the expression: first group? or the second group (clothing, footwear), depending on the place in the table?
Thank you! 🙂
You would only be able to refer to them that way if you had introduced them in order in the introduction paragraph. Even then, you should alternate your expressions.
Thank you for your help! 🙂
Hi Liz, I can not thank you enough. Thank you so much for your help By the way, I have one question. Why is it “consumer items?” I thought it was consumed items.
“consumed” means either used or eaten. “Consumer” is a customer who buys products. Go to a dictionary and take a look for more precise definitions.
Perfect. Thanks a lot!
Hi Liz! I am doing the IELTS general test, do I need to practice table and chart exercises on the writing tasks?
Or does it come up only in the academic version of the test?
Can you see the RED MENU BAR at the top of the website? Go to “TEST INFO” and select “GT” from the drop down list. That page will explain it all for you. There are loads of pages of tips, lessons, advice, information on this site. Use the RED BAR to open the main pages which will give you access to the lessons etc.
Hi Liz Loved this answer. I have a doubt if we write the overview as 2 nd para will that be counted as a summing up/conclusion. I heard that conclusion has extra points for writing. Please help. Thanks Sandra
The conclusion is essential for writing task 2. If you fail to write a conclusion for writing task 2, you will get a lower score for Task Response. Writing task 1 is not an essay, it is a report. An overview is required for task 1. It is more logical to give the key features before the smaller details in a report.
Hi Liz!I really appreciate the organisation of this task it is clear and coherent.But one thing that confuses me ,why did you describe Sweden at your 2 body ,i mean sweden’s data is not highest 🤔
You task is not only to present the highest. It is to highlight key features and that includes the lowest. In body paragraph 1, Sweden was the lowest. In body paragraph 2, Sweden was the lowest.
Hi Liz, I really appreciate for your amazing posts. It helps me A LOT!!!! By the way, I have a question, Some of the answers separate the overview paragraph and some don’t. Is either way correct?
Both ways are correct. I tend to put my overview in the same paragraph as the introduction for diagrams if the introduction is only a few words in length. Otherwise I keep it entirely separate.
liz you’re very smart teacher…
This report was just great! I really liked how the information was grouped and delivered. However, I have one question with respect to the report on this topic I wrote myself trying to make use of paragraphs in order to group the similarities. Can I use ” ” to refer to a certain category? (e.g. in terms of “foods, drinks and tobacco” and “leisure and education”, the Turkish spent the most on these.)
No, it is best not to use “”.
Your contents regarding IELTS are really usefull and important. But I’ve a little doubt. You’ve recommended to use 2 paragraphs for the body and other 2 for the introduction and overview. But my IELTS teacher taught me to use 3 paras(for body) for the 3 columns in the table. And 3 paras(for body) if there are 3 pie charts in the task. And 3 paras(for body) if it is a line graph. (1 for starting year, 1 for ending year, 1 for the rest of the duration)
Could you please explain whether it is correct or wrong !
Paragraphing needs to be logical and that is certainly logical. But it also needs to be used to group information together and highlight similarities – your paragraph is more than just 3 charts = 3 body paragraphs. Start looking more at the information being presented and see if you can find trends or features that can be grouped together making paragraphing more effective rather than simplistic and obvious. Your teachers recommendation limits your score in Coherence and Cohesion – not a problem is you are not aiming for a high score.
Dear Liz, ı really can’t find the words to tell you how grateful I am of your content. After taking the exam for the 5th time, ı finally managed to get a 7,5. my previous score was 7, by reading the model essays and suggestions ı got the sore that ı needed. thank you sooo sooo much. ı really don’t think that ı could have done this without your help. ı wish you an amazing life, my you be happy just like you make others happy.
Well done getting the score you needed 🙂 I’m so pleased my lessons were useful for you 🙂
Hello, Liz, I saw you just wrote “on the other hand” without mentioning “on the one hand” before, is that proper? Thanks for replying.
Sure. No problem. You can use “on the other hand” without using “on the one hand” – but not vice versa.
hi Liz i m extremely thankful to you for your guidance.
In the above example essay for table, the discussion about expenditure on clothing and footwear category is only about highest and lowest nation. Isn’t there a chance that the essay may marked down for the task achievement metric???? Also for the education and leisure also the averaged percentage are used to represent the intermediate countries, so can we proceed in that manner without violating the task achievement rubric???
That is incorrect. The paragraph about clothing and footwear contained information about all categories. You forget to look at the final sentence of that paragraph: “The national spending in this area for the remaining countries averaged around 6.5%………..”. This is called grouping information together and is a vital skill for writing task 1.
Finding very easy to describe the table chart thanks for your help. I have a question ‘Is there any way we add end note at last? Like overall table show the European consumer expenditure.
Be very careful of adding another statement which presents overall information. If you do that, it would mean that you have split the overview into two separate statements which exist, not together in one paragraph, but split into different parts of the report. This will lower your score for Coherence and Cohesion which is about logical organisation of information and paragraphs. Do you see what I mean?
Hi Liz, I noticed the tense you used in your text is past tense, is this due to as the statement says 2012? What if the there is no specific dates given then present tense would be the appropriate tense to use correct? I have seen other teachers use present tense regardless of the year. Please advise.
Kind regards, Ahmed
Never ignore the dates given.
Hi Liz. I really love your video. I want to ask you why my Australian teacher said I will lose score if I use “ illustrate” in task 1 except for diagrams. I learn how to write task 1 from your video and what he said today made me confused.
The word is fine to use. That is completely untrue. Your teacher is probably getting confused with the word “illustration” which means picture. The noun and the verb do not have 100% the same meaning.
Hi just wondering can i use ‘ The pie chart provided above gives information about….:is that correct in the report speech? Or that must to be only ‘ The pie chart illustrates the information/data….
You have written “above”/ But what is above the answer sheet? Nothing. You can’t use that word. Otherwise, it is fine.
Hi Liz, I really like your website, you are doing amazing work.
Can I start to overview with ‘to sum up’ instead of overall? Besides, is there any problem with writing an overview in the last paragraph?
The examiner is specifically looking for an overview. It is the most important paragraph. Which linking device do you think is most suitable? You aren’t going to lose marks because you use “To sum up”, but it isn’t the most appropriate for an overview.
Speak Your Mind Cancel reply
Notify me of new posts by email.
Advanced IELTS Lessons & E-books

Recent Lessons
Ielts model essay -two questions essay type, ielts bar chart of age groups 2024, ielts topic: urban planning, ielts listening transcripts: when and how to use them, 2024 ielts speaking part 1 topics, vocabulary for government topic.

Click Below to Learn:
- IELTS Test Information
Copyright Notice
Copyright © Elizabeth Ferguson, 2014 – 2024
All rights reserved.
Privacy Policy & Disclaimer
- Click here: Privacy Policy
- Click here: Disclaimer
Return to top of page
Copyright © 2024 · Prose on Genesis Framework · WordPress · Log in
- Skip to main content
IELTS Podcast
Pass IELTS with expert help.
35 Sample Band 9 IELTS Essays

Take a look at these 35 sample Band 9 IELTS essays for writing task 2 of the IELTS exam . Task 2 can cover a wide range of essay topics for the IELTS writing task section of the test, so preparation is key. Use the following samples when preparing your IELTS essays to see how close you are to a band 9!
These IELTS band 9 essay samples will help you highlight your mistakes and improve your writing band 9 level.
See the below IELTS essay writing sample questions and answers to practice for your IELTS writing task 2 .
You will find the IELTS essay questions and answers categorised by the following essay types.
- Do you agree/disagree
- Discuss both views and give your opinion
- Discuss the advantages and disadvantages
- Discuss the problems and possible solutions
- Is this a positive or a negative development
For a FREE ebook of our top 10 IELTS Band 9 essay samples in PDF, click here!
1. agree or disagree .
- Some people believe that technology has made man more social. To what extent do you agree or disagree with this opinion?
- Some people think that a person improves their intellectual skills more when doing group activities. To what extent do you agree? Use specific details and examples to explain your view.
- In some countries, the number of shootings increase because many people have guns at home. To what extent do you agree or disagree? Give specific reasons and examples to support your answer.
- Some people believe that international sporting events are the ideal opportunity to show the world the qualities of the hosting nation. Others believe that these events are mainly a large unjustifiable expense. To what extent do you agree or disagree?
- Crime is a big problem in the world; many believe that nothing can be done to prevent it. To what extent do you agree or disagree? Give your own opinion.
- Doing an enjoyable activity with a child can develop better skills and more creativity than reading. To what extent do you agree? Use reasons and specific examples to explain your answer.
- Improvements in health, education and trade are essential for the development of poorer nations. However, the governments of richer nations should take more responsibility for helping the poorer nations in such areas. To what extent do you agree?
- Advances in health and biology and other areas of society in the last 100 years have transformed the way we live as well as postponing the day we die. There is no better time to be alive than now. To what extent do you agree or disagree with this opinion?
- The world is consuming natural resources faster than they can be renewed. Therefore, it is important that products are made to last. Governments should discourage people from constantly buying more up-to-date or fashionable products. To what extent do you agree with this statement?
- Some people believe that children’s leisure activities must be educational, otherwise, they are a complete waste of time. Do you agree or disagree? Give reasons for your answer and include any relevant examples from your experience.
- Many governments in the world spend large amounts of money on art, which helps to improve the quality of people’s lives. However, governments should spend money on other things rather than art. Do you agree or disagree? Give your opinion.
2. Discuss both views and give your point of view?
- NEW SEPTEMBER 2022: Some people believe that professionals such as doctors and engineers should be required to work in the country where they did their training. Others believe they should be free to work in another country if they wish. Discuss both these views and give your own opinion.
- Nowadays most green energy is becoming evermore prevalent in both developed and developing countries. Some argue they greatly reduce costs and are better for the environment, others believe they are a serious threat to energy security. Discuss both views and give your opinion.
- Some people are of the opinion that children should be rewarded for good behaviour. Others think they should be punished for bad behaviour. Discuss both views and give your personal opinion and reasons.
- Some people think that keeping pets is good for children while others think it is dangerous and unhealthy. Which opinion do you agree with? Discuss both options and give examples .
- Some people think that secondary school children should study international news as one of the school subjects. Other people think that it is a waste of valuable school time. What do you think? Give reasons for your answer and include any relevant examples from your own knowledge or experience.
- Some products can be made quickly by a machine. Other items take a long time to be made by hand. As a buyer, which do you prefer and why? Give specific details and examples in your answer.
- Some people think women should be given equal chances to work and excel in their careers. Others believe that a woman’s role should be limited to taking care of the house and children. Which opinion do you agree with and why? Include specific details and examples to support your choice.
- Most schools are planning to replace sports and exercise classes with more academic sessions. How will this change affect children’s lives in your view?
- Some people think that schools have to be more entertaining, while others think that their sole purpose is to educate. Which do you agree with? Use specific reasons and examples to support your opinion.
- Some people think that it is acceptable to use animals in medical research for the benefit of human beings, while other people argue that it is wrong.
- Should humans adapt to technology or should technology be adapted to us? Is technology making us intellectually weaker or more intelligent?
- Do copyright laws limit creativity or reward it? Would society function better without such rules and regulations?
- Should education and healthcare be free of charge and funded by the government, or should it be the responsibility of the people to pay for these services? Discuss the above and give your opinion using examples.
3. Discuss the advantages and disadvantages
- Is it good for children to start using computers from an early age and spend long hours on them? Discuss the advantages and disadvantages.
- Some people think high school graduates should travel or work for a period of time instead of going directly to study at university. Discuss the advantages and disadvantages of both approaches. Give reasons for your answer and include any relevant examples from your own knowledge or experience.
4. Two questions, for example: Why is this happening? Is this a positive or negative development?
- These days some people spend a lot of money on tickets to go to sporting or events. Do you think this is a positive or negative development ?
- Some people like to travel outside their country. Others would rather travel to tourist spots in their own country first, before travelling abroad. Which do you prefer to do and why? Include specific details and examples to support your choice.
- Women can do everything that men can and they even do it better. They also can do many things that men cannot. But it is a fact that their work is not appreciated as much as men’s, although they have to sacrifice a lot for their family and career… It is said: “A woman’s place is in the home.” What do you think?
5. Discuss the problems and possible solutions OR discuss the causes and what problems it causes?
- People are using a lot of online language translation apps. Do the benefits of this outweigh the disadvantages?
- Obesity is a serious problem in many countries, especially in rich countries. Discuss ways to solve the problem. Provide specific reasons and examples to support your answer.
- Today, the quality of life in large cities is decreasing. Discuss the causes and solutions.
- Research shows that global warming is caused by human activity. What are the possible effects of climate change and what can governments and individuals do to reduce these?
- In many countries, recently young single people have been living far from their parents, from the time they began studies or work and until they married. Do you think there are more advantages or disadvantages to this trend?
- Traditional schooling is out of date, boring and stifles a child’s natural talents, various professionals have pushed for an education revolution. Are there alternatives in the education system? Is traditional education doing more harm than good?
Take a look at some of our writing tasks to help you prepare for your IELTS exam , and if you need more help, we have a course that is guaranteed to help you pass IELTS. Practicing IELTS writing task 2 essays is very important for your exam preparation.
Video: IELTS Band 9 Writing Sample – Body Paragraphs
Click here for a FREE ebook of our top 10 IELTS Band 9 samples for writing task 2 in PDF,
For more preparation, take a look at our latest tutorials:.
- Band 9 Model Essay and Vocabulary-Cryptocurrency
- Sample task 2 questions
- Sample Band 9 Essay: Children and Education
- Sample Answers: discuss the advantages and disadvantages
- How to get ideas for task 2
- Full guide to academic collocations
- How to write a agree/disagree essay
- IELTS Writing Task 2: advantages and disadvantages questions
For a FREE ebook of our top 10 sample essays, click here!
Enhance Your Essays with Our Efficient Online IELTS Essay Checker
Practicing for IELTS Writing Task 2? You’re in the right place. But after you practice, how can you know if your essay is good? We have a tool to help! It’s called the online IELTS essay checker .
You can find it here . This tool is very easy to use. You write your essay, and our tool checks it. It tells you what mistakes you made and how to fix them. This means you can learn and get better faster. The best part? You save money.
Many students pay a lot for IELTS classes or teachers to check their essays. But our online IELTS essay checker is cheaper and works fast. You don’t have to wait! So, after you read the sample essays on this page, use our online IELTS essay checker .
It can help you see where you can do better. And it’s a good way to get ready for the IELTS exam without spending a lot of money. So, if you want to write better essays and save money, try our online IELTS essay checker .
We made it for students like you. We hope it helps you get the score you want.
Frequently Asked Questions (FAQ)
How to score band 9 in ielts writing.
You can score band 9 in IELTS writing by following these steps:
- Make sure you understand the question and answer what is being asked.
- Plan out your essay before you start writing
- Write your essay, review it and then “rewrite” it .
- Get feedback on your essays and find out where you may be losing points.
- Improve your language skills.
Read this post for more tips.
How do you write a 9 band essay?
Practice each essay type and be clear about the criteria for a perfect score. Basically, you need clear formal paragraphing, an essay that ‘flows’ logically and stays focused on the question, which is answered fully with high-level vocabulary and near-perfect grammar.
How can I get 9 in IELTS writing?
Look at model answers and memorize phrases that work for most essays – ‘In the modern world’ is a great way to start. A focus on global issues and international examples rounds out your answer and practice timed essays before the test.
Can you get 10 in IELTS?
No, the top band score is a 9. Be realistic though, some of the best universities in the world require a band 7 or 7.5 for their most challenging courses so a perfect score isn’t necessary in most situations.
IMAGES
VIDEO
COMMENTS
New reports are being added weekly. Last updated: September 15, 2022. Here you can find IELTS Report samples (Academic Writing Task 1) of Band 9, written by a native English speaker and a former IELTS examiner. Robert Nicholson is the co-author of 'High Scorer's Choice' IELTS Practice Tests book series, created in collaboration with Simone ...
IELTS Academic Writing Task 1 Samples. Get a band score and detailed report instantly. Check your IELTS essays right now! Read more ». Prepare for the IELTS Academic Test by using this collection of IELTS Academic Writing Task 1 practice samples. This collection is a great way to gain insight and practice for the exam.
Task 1 Sample Questions and Band 9 Model Answers ... Essay 1 The line graph displays the stock values of four different high-tech corporations from 2011 to 2016. Overall, Facebook's value steadily increased, while Yahoo's decreased. Apple's
Below is a sample IELTS Task 1 question and a model answer. The answer is estimated to get a Band 9 Score. Have a look at the answer first and then we can look at it in more detail. source: IELTS Buddy. The table below shows the estimated oil capacity of six countries, in millions of barrels per day, from 1990 to 2010.
on. March 22, 2021. in. IELTS Academic Writing Task 1. On IELTS test day, you may encounter line graphs in the Academic Writing Task 1 section. To help you understand what components make up a good response to a line graph question, let's take a look at a model band 9 essay. To see why this essay is band 9, see our scorer commentary after the ...
In writing, this means you need to achieve a band 9 in each of the four IELTS marking criteria: Task response. Coherence and cohesion. Lexical resource. Grammatical range and accuracy. Here is a description of the marking criteria for an IELTS Band 9 Essay for Writing Task 2: Task response. Coherence and cohesion.
How to compare two pie charts in IELTS writing task 1. This sample answer illustrates the method of organising the report as well as useful language and sentence structures to get a band score 9. IELTS Pie Charts. The pie charts below show the comparison of different kinds of energy production of France in two years.
People doing the Academic test will write a report on a data set, map, or process. People doing General Training will write a letter. You must write 150 words or more. You should spend around 20 minutes on this part of the test. Task 1 is worth 1/3 of your total mark on the Writing test.
This is an estimated band score 9 writing task 1 report for the academic paper. Recommended. How to Describe a Bar Chart: Free Video Tutorial; All Bar Chart Lessons; Model Pie Chart; ... All task 1 reports and task 2 essays should be written exactly as shown in my model answers. If I don't use headings, you don't use headings. Reply.
The resources below include an IELTS writing task 1 sample answer pdf. Line graph IELTS academic task 1 sample essay 26: Thermal conductivity of material at 25C. Line graph IELTS academic task 1 sample essay 7: January 2015 temperature variation in the Philippines. Line and bar chart IELTS academic task 1 sample essay 5: Common budget items chart.
This IELTS diagram model answer is estimated at band score 9. It is possible to have a diagram in your IELTS writing task 1 academic paper. A diagram is also known as a process. The diagram shown below is from IELTS Cambridge Book 8, Test 3. The diagram below shows the stages and equipment used in the cement-making process, and how cement is ...
How to Get Band 9 in IELTS in General Writing Task 1? #Recognize the kind of letter you are being expected to compose - Formal, Semi-formal & Informal. #Recognise the objective of the letter. #Open and finish off the letter correctly. Do this on the kind and objective of the letter. #Commence the letter suitably.
Final Takeaways for IELTS Academic Writing Task 1 Band 9. Approaching the graph writing task can feel overwhelming at first. Luckily, though, the IELTS rubric is really clear about what it takes to get an IELTS Writing Task 1 academic band 9 score! By staying on topic, developing your grammar skills, using a broad and precise vocabulary, and ...
IELTS Writing Task 1 Academic Sample (Maps), Band 9, Written by Dave Lang, Modified by Mohsen Keshmiri. The maps below show Pebbleton 20 years ago and today. ... Paraphrase the overall essay topic. Write a general over for the map. Include the major changes and group them generally. 1.
A: Do pay attention to time - task 1 is worth one third of the total marks (while task 2 is worth two thirds), Don't let nervousness stop you from trying your best. Get more tips to help you prepare for the writing tasks. Task 1 - Take a look at the chart below and perform the task as outlined:
Academic writing task 1 requires that you summarise and compare a diagram, chart or graph, talking about the main features. You should use at least 150 words for the task. This section is not an essay. It is a summary. You should use formal language and it must factual.
According to the Task 1 IELTS Band Descriptors, a Band 8 requires that you "cover all requirements of the task sufficiently" and that means that you "present, highlight and illustrate bullet points clearly and appropriately". ... In the model essay, the paragraphs as well as the sentences within them are well-organised and well ...
IELTS Line Graph Model (Band Score 9) This model line graph for IELTS is estimated at band score 9. The model answer below is for IELTS writing task 1 academic paper. Use this sample writing as a template for structure, key features and language for any IELTS line graph. There are also some tips given below to guide you and help you understand ...
Home » General Task 1 » IELTS Sample Letters - Band 9 In the General writing task of the IELTS test, for task 1 you will be asked to write a letter. This may be a formal, semi-formal or informal letter. You are expected to write at least 150 words although you will not be penalised for writing less. To get a band score of 9 on the IELTS ...
Band 9 Essay Sample. 34219. IELTS Materials. IELTS Bar Graph. IELTS Line Graph. IELTS Table Chart. IELTS Flow Chart. IELTS Pie Chart. IELTS Letter Writing.
The IELTS table below is taken from IELTS Cambridge book 7. The sample answer is estimated at band score 9. This page was last up-dated 2019. ... you will get a lower score for Task Response. Writing task 1 is not an essay, it is a report. An overview is required for task 1. It is more logical to give the key features before the smaller details ...
35 Sample Band 9 IELTS Essays. Take a look at these 35 sample Band 9 IELTS essays for writing task 2 of the IELTS exam. Task 2 can cover a wide range of essay topics for the IELTS writing task section of the test, so preparation is key. Use the following samples when preparing your IELTS essays to see how close you are to a band 9!